Litton C.W., . Reynolds D.C., Collins T.C. Zinc Oxide Materials for Electronic and Optoelectronic Device Applications
Подождите немного. Документ загружается.

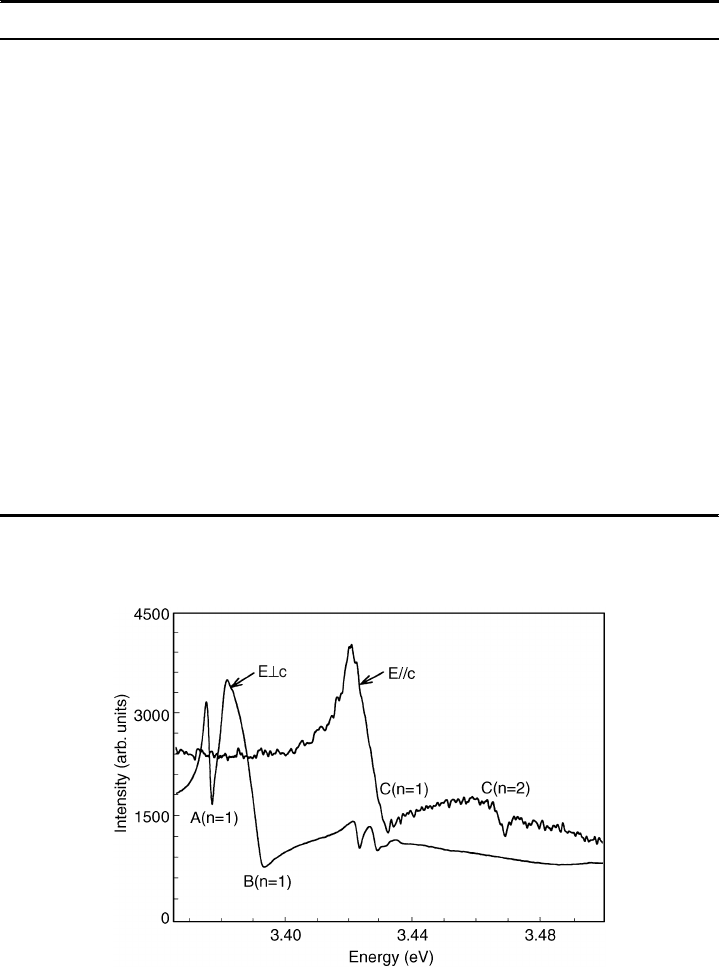
Table 2.1 Parameters pertinent to ZnO
Parameters Values (eV) Measured PL spectra Derived
A-exciton G
5
ground state energy 3.3773 X
n ¼2 energy 3.4221 X
n ¼3 energy 3.4303 X
Binding energy n ¼2 0.0597 X
Binding energy n ¼3 0.0596 X
Band gap energy 3.4370 X
A-exciton G
6
ground state energy 3.3756 X
n ¼2 energy 3.4209 X
n ¼3 energy 3.4288 X
Binding energy n ¼2 0.060 X
Binding energy n ¼3 0.0598 X
B-exciton ground state energy 3.3895 X
n ¼2 energy 3.4325 X
Binding energy 0.057 X
Band gap energy 3.4465 X
E
AB
, G
9
-G
7
0.0095 X
Measured reflection spectra
A-exciton reflection minima 3.3776 X
B-exciton reflection minima 3.3938 X
C-exciton reflection minima 3.4335 X
E
BC
, G
7
-G
7
0.0397 X
Spin-orbit parameter 0.016 X
Crystal-field parameter 0.043 X
Figure 2.4 Reflection spectra for the orientation E ?c and E kc. The reflection minima are as
follows: A, exciton 3.3776 eV; B, exciton 3.3938 eV; C, exciton 3.4335 eV; and C (n ¼2),
exciton 3.4700 eV. Reprinted with permission from Donald Reynolds. Copyright American
Institute of Physics
32 Optical Properties of ZnO
A- and B-bands. From this one can obtain the energy separation of the A- and B-bands.
One can obtain an estimate of the energy separ ation of the B- and C-bands from the
reflection minimum of each band, if one assumes that t he energy of the oscillator has the
same relationship to the reflection minimum in both bands. This estimate is a lso
reported in Table 2 .1.
The contributions of the spin-orbit interaction and the crystal field pertu rbation to the
experimentally observable splittings, E
l,2
(which is the energy difference between the A
and B band gaps) and E
2,3
(which is the energy difference between the B and C band gaps)
have been calculated by several investigators.
[7–12]
For the case in which the wurtzite
energy levels are treated as a perturbation of those in zinc blende, Hopfield and Thomas
[12]
have derived the relationships:
E
1
¼ 0
E
2
¼
d þD
2
þ
ffiffiffiffiffiffiffiffiffiffiffiffiffiffiffiffiffiffiffiffiffiffiffiffiffiffiffiffiffiffiffiffiffiffiffiffiffiffiffi
d þD
2
2
2
3
dD
"#
v
u
u
t
E
3
¼
d þD
2
ffiffiffiffiffiffiffiffiffiffiffiffiffiffiffiffiffiffiffiffiffiffiffiffiffiffiffiffiffiffiffiffiffiffiffiffiffiffiffi
d þD
2
2
2
3
dD
"#
v
u
u
t
where D and d represent the contributions of uniaxial field and spin-orbit interaction,
respectively, to the splittings E
1,2
and E
2,3
. H aving observed t he excited state transi-
tions in emission from the A- and B-bands, one can make a determination o f the band
gap energies, the difference of which gives a reliable e nergy separation of those bands
of 0.0095 eV. The difference between the B and C exciton transition energies is
estimated from the reflection spectra since the C exciton in emission was not observed.
The energies of the reflection minima were taken as the exciton transition energies,
realizing that these are not the energy positions of the oscillators. Since we are
concerned only with the energy difference, this allows an estimate for the value of E
2,3
.
Assuming that the binding energies of the B and C excitons are re asonabl y close, this
will also be the difference between the B and C band gaps. This gives a n E
2,3
value of
0.0397 eV. Substituting the E
1,2
and E
2,3
values into the quasicubic model, the spin-
orbit and crystal-field parameters can be estimated. Assuming d G D, the spin-orbit
parameter is 16 meV, while the crystal-field parameter is 43 meV. One would expect the
spin-orbit parameter to be small due to the small atomic number of oxygen. The
parameters that have been determined from the exciton spectra of ZnO are compiled
in Table 2.1.
Defect pair spectra have been observed in the ZnO samples being investigated.
[18]
This
results in a number of PL lines at slightly different energies due to different pair
separations. These pairs are not of the usual donor–acceptor nature, but behave simply
as neutral-donor complexes; the emission then results from the collapse of excitons bound
to the donors. On the high-energy side of the neutral-donor-bound exciton complex lines is
a similar set of lines, which are excited states of the lower-energy complex structure. These
Free Excitons 33
excited states are analogous to the rotational states of the H
2
molecule. A model for the
rotational states was proposed by Rorison et al.
[19]
to explain their high-magnetic-field
results in InP. In this model, the donor-bound exciton D
,X is considered to be a free
exciton orbiting a neutral donor; one electron was considered to be strongly correlated
with the hole and the other with the donor. Some of the rotator states associated with the
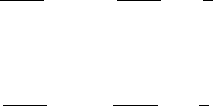
defect-donor-bound excitons in ZnO are shown in Figure 2.5, along with the free exciton
transitions. These transitions are shown for E ?c in zero magnetic field, and for an applied
magnetic field oriented H ?c and H kc. In zero magnetic field, the G
5
free exciton as well
as the G
5
exciton associated with D
,X rotator states are observed. When H ?c is turned
on, the G
6
free exciton as well as the G
6
exciton associated with the rotator state appear.
The 3.3702 eV G
6
rotator state and the 3.3714 eV G
5
rotator state are associated with the
3.3594 eV D
,X transition, not shown here but reported in Reynolds et al.
[18]
When H kc
is turned on, both the G
6
free exciton and the G
6
rotator state show a magnetic field
splitting. Assuming the unallowed G
6
excitons were G
2
excitons they would not be
expected to split in a magnetic field since the G
2
is a singlet exciton. This is consistent with
a G
7
G
9
transition rather than a G
7
G
7
transition. It is seen in Figure 2.5 that the G
6
free
exciton and the G
6
rotator exciton show essentially the same magnetic field splitting.
Additional splittings are observed on the high energy side of the 3.3702 eV G
6
rotator state.
These result from G
6
excitons associated with other donor-bound excitons, where the G
6
rotators are masked by G
5
rotators associated with different D
,X lines in zero field. The
defect pair spectra will be further discussed in Section 3.5.
Figure 2.5 The G
5
and G
6
free exciton transitions along with several donor-bound exciton
rotator state transitions. These transitions are shown in zero field and with applied fields in the
orientations H ?c and H kc. In zero magnetic field the lowest energy G
5
rotator state occurs at
3.3714 eV. In an applied magnetic field (H ?c), the lowest energy G
6
rotator state occurs at
3.3702 eV. In an applied magnetic field of 33.6 kG (H kc), the split components of the G
6
free
exciton occur at 3.3752 eV and 3.3746 eV, and the split components of the G
6
rotator state
occur at 3.3704 eV and 3.3698 eV. Reprinted with permission from Donald Reynolds. Copy-
right American Institute of Physics
34 Optical Properties of ZnO
2.3 Strain Splitting of the G
5
and G
6
Free Excitons in ZnO
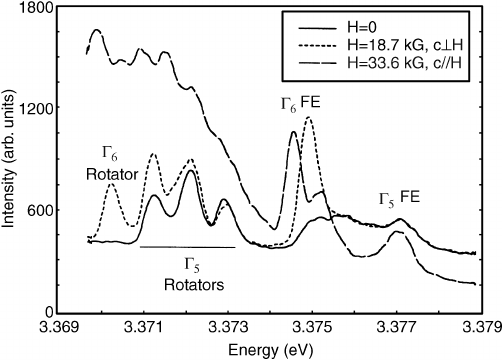
A strain splitting of the G
5
and G
6
excitons in ZnO has also been obser ved. The splitting
of exciton lines in wurtzite crystals when exposed to an applied stress was first reported
by Koda and Langer.
[20]
In the case of wurtzite crystals all of the orbital degeneracies of
the valence band are lifted by the trigona l crystal field and spin-orbit interactions. The
above phenomena could not be explained by the one-electron band scheme and
deformation potential theory. A theoretical interpretation was provided by Akimoto and
Hasegawa.
[21]
They found that the combined effects of stress and the electron hole
exchange interaction in a quasicubic model were able to predict the splitting and
polarization pattern of the free exciton. These investigations were extended to several
materials by Langer et al.
[22]
Their investigations primarily involved reflection measure-
ments; as a result the individual excitons that make up the band were not resolved. In the
analysis of Akimoto and Hasegawa
[21]
only the splitting of the G
5
exciton was treated.
The G
6
and G
2
excitons were not considered since they are forbidden. In the current
experiment the excitons are being observed in emission and both the G
5
and a forbidden
exciton are resolved. In the absence of a magnetic field the forbidden exciton is only
observed in samples containing in-grown strain. It would be expected that strain would
relax selection rules since it changes the symmetry of the sample. Not only is the
forbidden exciton observed in the presence of strain but it also splits. When viewing the
G
5
and G
6
excitons in gratin g second order, a well-resolved splitting of the G
6
exciton is
observed (solid line Figure 2.6). The emission line from the G
5
exciton is broadened,
suggesting a splitting which is not resolved. In Akimoto and Has egawa
[21]
it was pointed
out that it is the combined effect of strain and exchange coupling which causes line
splitting. If either one is zero, the line splitting is also zero. This allows the identification
Figure 2.6 Second-order emission spectra in G
5
, G
6
free-exciton region of ZnO. Reprinted with
permission from Donald Reynolds. Copyright American Institute of Physics
Strain Splitting of the G
5
and G
6
Free Excitons in ZnO 35
of the unallowed exciton as a G
6
exciton rather than a G
2
exciton since the latter is a
singlet and would not split. These data are therefore consistent with the top valence band
in ZnO having G
9
symmetry.
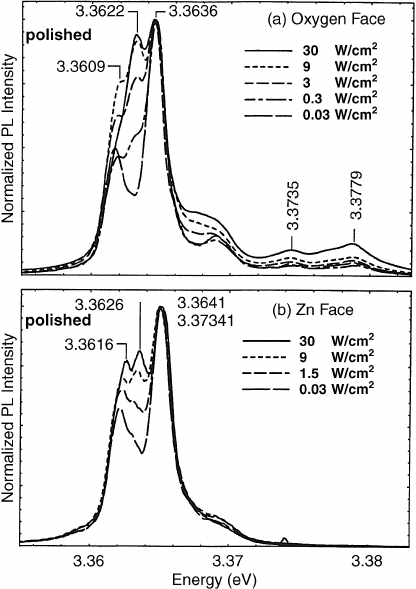
2.4 Photoluminescence from the Two Polar Faces of ZnO
The crystal structure of ZnO is wurtzite and the stacking sequence of atomic layers along
the “c”-axis is not symmetric. As a result, a ZnO crystal surface that is normal to the
“c”-axis exposes one of two distinct polar faces, with (000
I) being considered the O face
and (0001) the Zn face. PL measurements on the two faces reveal a striking difference.
Two transitions are observed in PL from the O face that are not in PL from the Zn face.
These lines are identified as phonon replicas of a particular D
,X transition using energy
separations, excitation dependence, and time-resolved PL measurements. In addition, PL
emission from free excitons and from excited states of donor-bound excitons is found to be
more intense from the O face than from the Zn face.
PL spectra from the O face of the ZnO sam ple are shown in Figure 2.7(a) for various
excitation intensities. The strong set of lines near 3.36 eV result from neutral-donor-bound
exciton complexes (D
,X) associated with defect pairs.
[18]
The peak at 3.3735 eV is
emission from the excited states of the donor-bound excitons, while the peak at 3.3779 eV
is the free exciton emission. Note the strong excitation dependence of the 3.3622 eV line
compared with that of other D
,X lines–at the lowest exciting intensity, it is not even
visible. PL spectra from the Zn face of the same sample are shown in Figur e 2.7(b). Except
for a small shift in energy, the D
,X lines behave similarly on both faces. In contrast, the
free exciton and D
,X excited state lines observed in the O-face PL are essent ially absent
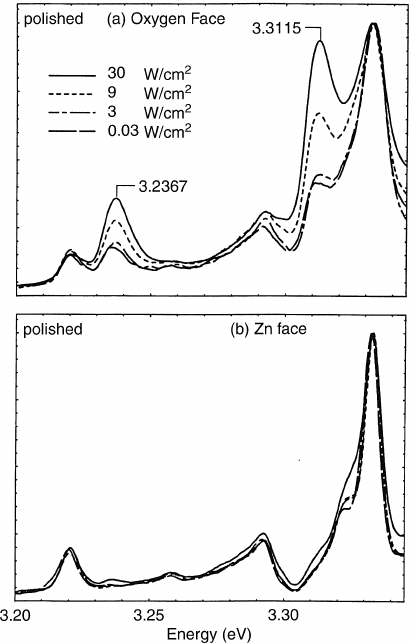
in the Zn-face PL. A more striking contrast in PL from the two faces is evident in
Figure 2.8, which displays spectra for energies below 3.35 eV. The spectra from the O face
in Figure 2.8(a) display lines at 3.2367 eV and 3.3115 eV that are not evident in the spectra
from the Zn face in Figure 2.8(b). These lines also depend more strongly on excitation
intensity than do the surrounding spectral features, reminiscent of the 3.3622 line in
Figure 2.7(a).
Since the 3.3622 eV line results from direct recombination of a pa rticular D
,X
complex, it is suggested that the 3.3115 eV line results from collapse of the same
complex along with emission of an E
1
-TO phonon, and the 3.2367 eV line results from
collapse of the complex with emission of both an E
1
-TO phonon and an E
1
-LO phonon.
The observed energy separations imply e nergies of 50.7 meV for the E
1
-TO phonon and
74.8 meV for the E
1
-LO phonon, in c lose agreement with 50.5 meV and 72.3 meV
obtained from Raman measurements.
[23]
Curiously, no phonon replica is observed
near 3.2874 implying that the D
,X com plex does not collapse and excite only a single
E
1
-LO phonon. This may suggest that the coupling between the E
1
-LO phonon and the
transverse exciton is weak.
Both reduced free-exciton emission and the absence of phonon replicas suggest that the
local crystal environment near the Zn face is different from that near the O face. Perhaps
the Zn face is more subject to atmospheric contamination than the O face. The resulting
surface state defects could lead to band tailing that would absorb the near-band-edge free-
36 Optical Properties of ZnO
exciton and excited donor-bound-exciton emiss ions. The fact that PL from the Zn face
clearly exhibits the parent D
,X transition [Figure 2.7(b)] but not the phonon replicas
[Figure 2.8(b)] indicates that either the D
,X transition cannot couple to phonons near the
Zn face, or the requisite phonons are not created near the Zn face. Either case might result
if the Zn face is more susceptible to polishing dam age than the O face, with the resulting
sub-surface damage affecting the phonon spectrum.
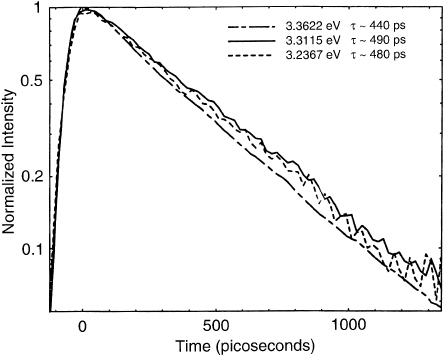
To further verify the identification of the phonon replicas, time-resolved PL was used to
measure the decay lifetimes for the 3.3622 eV, 3.3115 eV and 3.2367 eV lines. Results are
shown in Figure 2.9. The data display single exponential decays for all of the transitions
over several times the radiative recombination lifetime. Decay times were obtained from a
least-squares fit of the data to a single exponential for intensities between 0.85 and 0.05.
The decay time for the D
,X transition at 3.3622 eV was 440 ps while the decay times for
the phonon replicas at 3.3115 eV and 3.2367 eV were 490 ps and 480 ps, respectively.
Figure 2.7 Normalized ZnO PL spectra (above 3.35 eV) from (a) the O face and (b) the Zn
face. Excitation intensities are given in the key. The O-face spectra at the two highest excitation
intensities exhibited small shifts in emission energy, possibly from band-renormalization effects.
These shifts were removed from the figure for improved clarity: the 30 W cm
2
spectrum was
shifted by þ0.59 meV, and the 9 W cm
2
spectrum was shifted by þ0.25 meV. Reprinted with
permission from Donald Reynolds. Copyright American Institute of Physics
Photoluminescence from the Two Polar Faces of ZnO 37
Since the phonon replicas presuma bly result from low-probability decay branches for
the D
,X state, one would expect their intensities to track the decaying D
,X state
population. This would make the replica decay lifetimes match the parent transition
lifetime, as is observed.
2.5 Bound-Exciton Complexes in ZnO
Defect pair spectra have been extensively studied in GaAs.
[24–34]
A large number of PL
lines were observed in ZnO resulting from excitons being bound to the defect pairs (the
term “defect” can include both foreign impurities as well as native defects). Several of the
lines were observed to be strongly polarized.
[30]
The polarization of the lines suggests that
during growth, defect complexes are preferentially incorporated in certain crystallograp hic
orientations. The crystal will be strained in the vicinity of the defect pairs with the strain
Figure 2.8 Normalized ZnO PL spectra (below 3.35 eV) from (a) the O face and (b) the Zn
face. The excitation intensities in the key apply to both (a) and (b). Reprinted with permission
from Donald Reynolds. Copyright American Institute of Physics
38 Optical Properties of ZnO
being oriented in the direction of the pair. This results in the electric vector being parallel
to the strain direct ion. Similar polarization properties were reported by Langer et al.
[35]
from uniaxial pressure measurements on ZnO crystals.
The defect pairs have the properties of neutral donors and the emission lines result
from the collapse of excitons bound to the neutral donor complexes. The chemical
make-up of th e de fect pair is no t kn own, but from the PL analysis , it must simul ate a
neutral donor. One would speculate that in the growth process the first component of the
pair would be incorporated, perhaps at a lattice site. This would then be conducive to
the incorporation of the second component which would occupy a nearest neighbor
lattice, or interstitial, or more distant site. The pair would then be crystallographically
oriented. Annealing studies show that as the annealing temperature is increased, the
higher energy PL lines disappear and, at an annealing temperature of 800
C, essen-
tially all of the emission intensity goes into the lowest energy emission line, which is
believed to be the near neighbor alignment. It would appear that annealing results in
defect diffusion which ultimately produces nearest neighbor defect pairs. The P L
spectrum of this final pair also shows polarization properties which are consistent with
defect pair structure.
On the high energy side of the neutral donor-bound-exciton complex lines is a similar
set of lines which are believed to be excited states of the lower energy complex structure.
Similar emission lines have been observed in many other materials, such as ZnSe,
[36]
CdTe,
[37]
GaAs,
[37,39]
and CdS.
[40]
These transitions were first interpreted as excited states
of the neutral donor-bound-exciton D
,X but with very little detail as to their nature. Later,
Guillaume and Lavallard
[41]
proposed a rigid rotation model to explain these excited states
in CdTe. In this model the hole is excited to rotate around the fixed donor, analogous to
rotation of diatomic molecules. This model had difficulty in predicting the observed
energies for the excited-state transitions. A nonrigid-rotator model was subsequently
Figure 2.9 Time-resolved PL intensity decays for the D
,X line at 3.3622 eV and its phonon
replicas at 3.3115 eV and 3.2367 eV. Reprinted with permission from Donald Reynolds.
Copyright American Institute of Physics
Bound-Exciton Complexes in ZnO 39
proposed by Ruhle and Klingenstein,
[42]
which was successful in predicting the excited
state energies in InP and GaAs. A more sophisticated model was applied to the D
,X
ground and excited states by Herbert;
[43]
this model predicts the energy ordering o f the
excited states.
A final model was proposed by Rorison et al.
[19]
to explain their high-magnetic-field
results in InP. In this model D
,X is considered to be a free exciton orbiting a neutral donor;
one electron was considered to be strongly correlated with the hole and the other with the
donor. This model was capable of explaining the relative intensities of the PL transition in
the ground- and excited-state regions of InP.
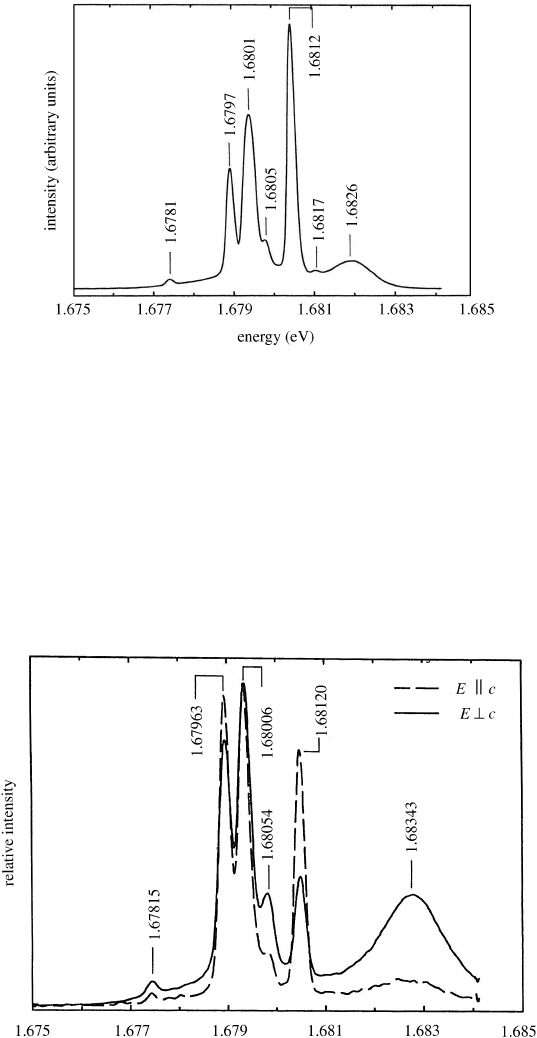
The neutral donor defect pair spectra are shown in Figure 2.10. The spectra are
recorded in first order a nd result from excitons bound to the neutral donor defect pairs.
The same spectra recorded in second order are shown in Figure 2.11. In these spectra
more lines are resolved. Defect pair spectr a would be expected to show polarization
effects. Local strains oriented in the dir ection of the pair will result, and the electric
vector will orient in the directi on of the strain. Polarization effects are shown in
Figure 2.12. The solid line s hows the spectra with the electric vector perpendicular to
the “c”-axis of the crystal, E ?c. The dashed line shows the spectra with the electric
vector parallel to the “c”-axis of the crystal, E kc. Some of the lines show strong
polarization, indicating the direction of the pairs. This evidence supports the contention
that these emission lines are associated with defect pair complexes. The emission
results from the collapse of excitons bound to the defect pair complexes which simulate
neutral donors. These complexes are shown to have the electronic character of neutral
donors. The magnetic field splitting of the lines is consistent with neutral-donor-bound-
excitons in the wurtzit e structure. Plotted in Figure 2.13 is the splitting a s a function of
magnetic field, w ith the crystalline “c”-axis oriented perpendicular to the magnetic field
(c ?H). The magnetic field data are for the line at 3.36012 eV. One would expect a
doublet splitting (with c ?H) to arise from an exciton bound to a neutral donor or
Figure 2.10 Neutral donor defect pair spectra in ZnO, first-order spectrum. Reprinted with
permission from Donald Reynolds. Copyright American Institute of Physics
40 Optical Properties of ZnO
acceptor in the wurtzite symmetry. In this orientation the hole g-value in the upper state goes
to zero (g
h
¼g
hll
cosu), so the magnetic field splitting results from the electron spin splitting
in the final state. From these data, the electron g-value is measured, giving a value g
e
¼1.85 in
good agreement with the previously measured g
e
¼1.95.
[47]
A magnetic field splitting for
the orientation c kH was not observed. In this orientation, a contribution from both the
electron and hole spins is expected. The spin-up, spin-down transitions leading to a sum of the
Figure 2.11 Second-order spectrum of defect pair spectra in Figure 2.10. Reprinted with
permission from Donald Reynolds. Copyright American Institute of Physics
Figure 2.12 Polarized spectra of Figure 2.11. Reprinted with permission from Donald
Reynolds. Copyright American Institute of Physics
Bound-Exciton Complexes in ZnO 41