Lin S.D. Water and Wastewater Calculations Manual
Подождите немного. Документ загружается.

Step 2. Compute ⌺y/ ⌺ty
Step 3. Find K
1
and L
a
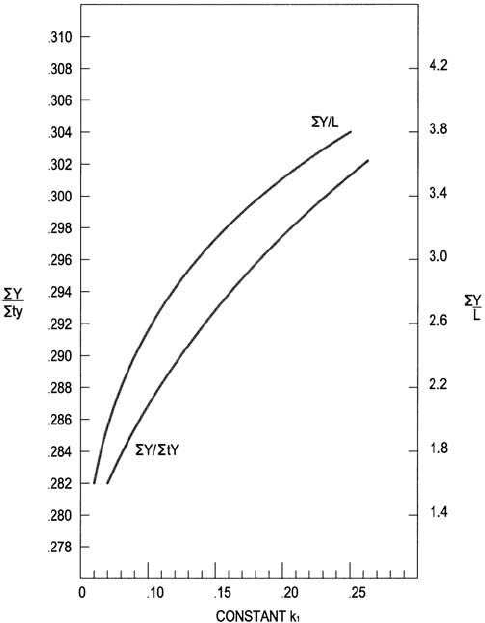
On the 7-day time sequence graph (Fig. 1.5), enter the value 0.288 on the
⌺y/⌺ty scale, extend a horizontal line to the curve labeled ⌺y/⌺ty, and from
this point, follow a vertical line to the k
1
scale. A value of k
1
⫽ 0.264.
5 0.608 sper dayd
K
1
5 2.3026 3 k
1
5 2.3026 3 0.264
⌺y/⌺ty 5 635.2/2786 5 0.228
Streams and Rivers 25
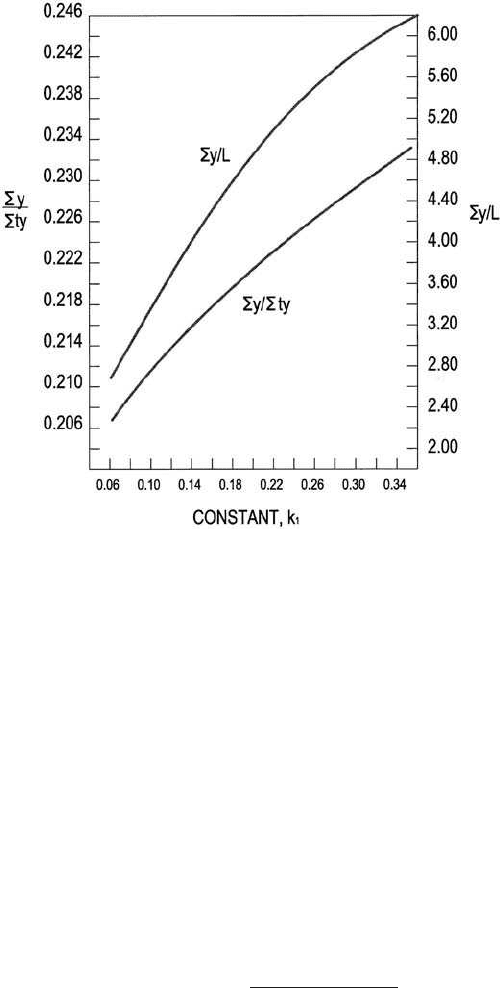
Figure 1.4 ⌺y/L and ⌺y/⌺ty for various values of k
1
in a 5-day
sequence.
Extend the same vertical line to the curve labeled ⌺y/L
a
, obtaining a value
of 5.81. Since
The technique of the moment method for analyzing a set of BOD data con-
taining a lag phase is as follows:
1. Compute ⌺t, ⌺y, and ⌺ty
2. Compute t
2
and t
2
y and take the sum of the values of each quantity as ⌺t
2
and ⌺t
2
y
3. Compute the derived quantity:
in which n is the number of observations
⌺ty/⌺t 2 ⌺y/n
⌺st
2
yd/⌺t
2
2 ⌺y/n
5 109.3 smg/Ld
L
a
5 ⌺y/5.81 5 635.2/5.81
26 Chapter 1
Figure 1.5 ⌺y/L and ⌺y/⌺ty for various values of k
1
in a 7-day
sequence.
4. Enter the above quantity on appropriate curve to find k
1
5. Project to other curves for values and solve equations for C and L
a
. The
BOD equation with log phase is expressed as
(1.14b)
(1.14c)
in which t
0
is the lag period and
Example 2: With a lag phase BOD data, BOD values are shown in Table 1.8.
Find K
1
and L
a
, and complete an equation of the curve of best fit for the BOD
data.
C 5 10
k
1
t
0
y 5 L
a
[1 2 C10
2k
1
t
]
y 5 L[1 2 10
2k
1
st2t
0
d
]
Streams and Rivers 27
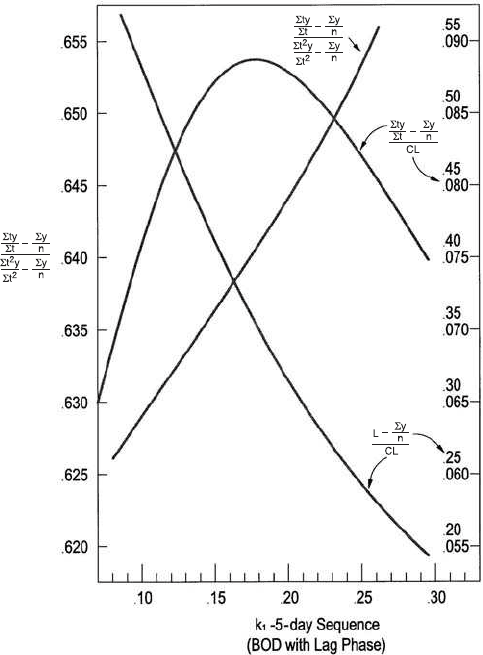
Figure 1.6 Curves for BOD computation with lag phase, based on
a 5-day time sequence.

solution:
Step 1. Compute ⌺t, ⌺y, ⌺ty, ⌺t
2
, and ⌺t
2
y (Table 1.8)
Step 2. Compute some quantities
and
Step 3. Enter in Fig. 1.6 on the vertical axis labeled
with the value 0.640, and proceed horizontally to the diagonal straight line.
Extend a vertical line to the axis labeled k
1
and read k
1
⫽ 0.173 per day (K
1
⫽
0.173 per day ⫻ 2.3026 ⫽ 0.398 per day). Extend the vertical line to curve labeled
⌺ty/⌺t 2 ⌺y/n
CL
⌺ty/⌺t 2 ⌺y/n
⌺t
2
y/⌺t
2
2 ⌺y/n
⌺ty/⌺t 2 ⌺y/n
⌺t
2
y/⌺t
2
2 ⌺y/n
5
113.13 2 91.8
125.14 2 91.8
5 0.640
⌺t
2
y/⌺t
2
5 6883/55 5 125.14
⌺y/n 5 459/5 5 91.8
⌺ty/⌺t 5 1697/15 5 113.13
28 Chapter 1
TABLE 1.8 Computations of ⌺t, ⌺y, ⌺ty, ⌺t
2
, and ⌺t
2
y
t y ty t
2
t
2
y
112 12 1 12
2 74 148 4 296
3 101 303 9 909
4 126 504 16 2016
5 146 730 25 3650
15 459 1697 55 6883
TABLE 1.7 Calculation of ⌺y and ⌺ty
ty ty
1 56.2 56.2
2 74.4 148.8
3 87.6 262.8
4 96.2 384.8
5 102.4 512.0
6 107.4 644.4
7 111.0 777.0
Sum 635.2 2786.0
and proceed horizontally from the intersection to the scale at the far right;
read
Step 4. Find CL
Step 5. Find L
a
, L
a
⫽ L for this case
Continue to the same vertical line to the curve labeled
and read horizontally on the inside right-hand scale
Then
Also
and lag period
Step 6. Write complete equation of the best fit for the data
or
y 5 177.6[1 2 e
20.398st20.787d
]
y 5 177.6[1 2 10
20.173st20.787d
]
5 0.787 sdaysd
5
1
0.173
log
10
1.368
t
0
5
1
k
1
log
10
C
C 5
CL
L
5
242.94
177.6
5 1.368
5 177.6 smg/Ld
L 5 L
a
5 0.353s242.94d 1 91.8
L 2 ⌺y/n
CL
5 0.353
L 2 ⌺y/n
CL
CL 5
113.13 2 91.8
0.0878
5 242.94
⌺ty/⌺t 2 ⌺y/n
CL
5 0.0878
Streams and Rivers 29

Logarithmic formula. Orford and Ingram (1953) reported that there is
a relationship between the observed BOD from domestic sewage and the
logarithm of the time of observation. If the BOD data are plotted against
the logarithm of time, the resultant curve is approximately a straight
line. The general equation is expressed as
y
t
⫽ m logt ⫹ b (1.22)
where m is the slope of the line and b is a constant (the intercept).
The general equation can be transformed by dividing each side by the
5-day BOD
5
intercept of the line to give
(1.22a)
or
y
t
⫽ s(M log t ⫹ B) (1.22b)
where s ⫽ BOD
5
intercept of the line
M ⫽ m/s, BOD rate parameter
B ⫽ b/s, BOD rate parameter
For domestic sewage oxidation at 20⬚C, the straight line through the
observed plotted points, when extrapolated to the logt axis, intercepts
the logt axis at 0.333 days. The general equation is
y
t
⫽ s(0.85 logt ⫹ 0.41) (1.23a)
where 0.41 is the BOD rate parameter for domestic sewage.
For any observed BOD curve with different oxidation time, the above
equation may be generalized as
y
t
⫽ S(log at ⫹ 0.41) (1.23b)
where S ⫽ BOD intercept (y-axis) of the line at 5/a days
⫽ 5-day BOD at the standardized
domestic sewage oxidation rate, when a ⫽ 1
⫽ strength factor
a ⫽ log t at x-axis intercept of normal domestic
sewage BOD curve divided by the x-axis intercept of
⫽
⫽ 1 for a standardized domestic sewage BOD
5
curve
0.333
x-axis intercept
y
t
s
5 M logt 1 B
y
t
s
5
m
s
logt 1
b
s
30 Chapter 1

The oxidation rate
(1.24a)
or
(1.24b)
For the logarithmic formula method, you need to determine the two
constants S and a. Observed BOD data are plotted on semilogarithmic
graph paper. Time in days is plotted on a logarithmic scale on the x-
axis and percent of 5-day BOD on a regular scale on the y-axis. The
straight line of best fix is drawn through the plotted points. The time
value of the x-axis intercept is then read, x
1
(for a standardized domes-
tic sewage sample, this is 0.333). The a value can be calculated by
a ⫽ 0.333/x
1
.
Example: At 20⬚C, S ⫽ 95 mg/L and x
1
⫽ 0.222 days. What is the BOD
equation and K
1
for the sample?
solution:
Step 1. Compute a
Step 2. Determine the simplified Eq. (1.23b)
Step 3. Compute the oxidation rate at t ⫽ 5 days, using Eq. (1.24a)
Step 4. Determine L
a
when t ⫽ 20 days from Step 2
5 158 smg/Ld
L
a
5 y
20
5 95s0.85 logs1.5 3 20d 1 0.41d
5 16.15[mg/sL
#
dd]
dy
dt
5
0.85S
t
5
0.85 3 95 mg/L
5 days
5 95s0.85 log 1.5t 1 0.41d
y
t
5 Ss0.85 log at 1 0.41d
5 1.5
a 5 0.333/x
1
5 0.333/0.222
0.85S
2.303t
5 k
1
sL
a
2 y
t
d
dy
dt
5
0.85S
t
5 K
1
sL
a
2 y
t
d
Streams and Rivers 31

Step 5. Compute K
1
Rapid methods. Sheehy (1960) developed two rapid methods for solv-
ing first-order BOD equations. The first method, using the “BOD slide
rule,” is applicable to the ratios of observations on whole day intervals,
from 1 to 8 days, to the 5-day BOD. The second method, the graphical
method, can be used with whole or fractional day BOD values.
The BOD slide rule consists of scales A and B for multiplication and
division. Scales C and D are the values of and plotted
in relation to values of k
1
t on the B scale. From given BOD values, the
k
1
value is easily determined from the BOD slide rule. Unfortunately,
the BOD slide rule is not on the market.
The graphical method is based on the same principles as the BOD slide
rule method. Two figures are used to determine k
1
values directly. One
figure contains k
1
values based on the ratios of BOD at time t (BOD
t
) to
the 5-day BOD for t less than 5 days. The other figure contains k
1
val-
ues based on the ratio of BOD
t
to BOD
5
at times t greater than 5 days.
The value of k
1
is determined easily from any one of these figures based
on the ratio of BOD
t
to BOD
5
.
8.3 Temperature effect on
K
1
A general expression of the temperature effect on the deoxygenation
coefficient (rate) is
(1.25)
where K
1a
⫽ reaction rate at temperature T
a
, per day
K
1b
⫽ reaction rate at temperature T
b
, per day
u ⫽ temperature coefficient
On the basis of experimental results over the usual range of river tem-
perature, u is accepted as 1.047. Therefore the BOD reaction rate at any
T in Celsius (working temperature), deviated from 20⬚C, is
(1.26)
K
1sTd
5 K
1s208Cd
3 1.047
sT220d
K
1a
K
1b
5 u
sT
a
2T
b
d
10
2k
1
t
1 2 10
2k
1
t
5 0.256 sper dayd
K
1
5
16.15 mg/sL
#
dd
s158 2 95d mg/L
dy
dt
5 K
1
sL
a
2 y
5
d
32 Chapter 1
or
(1.26a)
Thus
(1.27)
or
(1.28)
Example 1: A river water sample has k
1
⫽ 0.10 (one base 10) and L
a
⫽
280 mg/L at 20⬚C. Find k
1
and L
a
at temperatures 14⬚C and 29⬚C.
solution:
Step 1.
Using Eq. (1.26a)
at 14⬚C
at 29⬚C
Step 2. Find L
a(T)
, using Eq. (1.28)
at 14⬚C
5 246 smg/Ld
5 280s0.6 1 0.02 3 14d
L
as148Cd
5 L
as208Cd
s0.6 1 0.02T d
L
asTd
5 L
as208Cd
s0.6 1 0.02T d
5 0.15 sper dayd
5 0.10 3 1.047
9
k
1s298Cd
5 k
1s208Cd
3 1.047
s29220d
5 0.076 sper dayd
5 0.10 3 1.047
26
k
1s148Cd
5 k
1s208Cd
3 1.047
s14220d
k
1sTd
5 k
1s208Cd
3 1.047
sT220d
L
asTd
5 L
as208Cd
s0.6 1 0.2Td
L
asTd
5 L
as208Cd
[1 1 0.02sT 2 20d]
k
1sTd
5 k
1s208Cd
3 1.047
sT220d
Streams and Rivers 33

at 29⬚C
The ultimate BOD and K
1
values found in the laboratory at 20⬚C have to
be adjusted to river temperatures using the above formulas. Three types of
BOD can be determined: i.e. total, carbonaceous, and nitrogenous. TBOD
(uninhibited) and CBOD (inhibited with trichloromethylpyridine for nitrifi-
cation) are measured directly, while NBOD can be computed by subtracting
CBOD values from TBOD values for given time elements.
Example 2: Tables 1.9 and 1.10 show typical long-term (20-day) BOD
data for the Upper Illinois Waterway downstream of Lockport (Butts and
Shackleford, 1992). The graphical plots of these BOD progressive curves
are presented in Figs. 1.7 to 1.9. Explain what are their unique
characteristics.
5 330 smg/Ld
L
as298Cd
5 280s0.6 1 0.02 3 29d
34 Chapter 1
TABLE 1.9 Biochemical Oxygen Demand at 20ⴗC in the Upper Illinois
Waterway
Station sample: Lockport 18 Station sample: Lockport 36
Date: 01/16/90 Date: 09/26/90
pH: 7.03 pH: 6.98
Temp: 16.05⬚C Temp: 19.10⬚C
Time, TBOD, CBOD, NBOD, Time, TBOD, CBOD, NBOD,
days mg/L mg/L mg/L days mg/L mg/L mg/L
0.89 1.09 0.98 0.11 0.72 0.19 0.18 1.01
1.88 1.99 1.73 0.25 1.69 0.66 0.18 0.48
2.87 2.74 2.06 0.68 2.65 0.99 0.92 0.07
3.87 3.39 2.25 1.14 3.65 1.38 1.25 0.13
4.87 4.60 3.08 1.52 4.72 1.81 1.25 0.56
5.62 5.48 3.45 2.04 5.80 2.74 1.62 1.12
6.58 7.41 4.17 3.24 6.75 3.51 2.09 1.43
7.62 9.87 4.83 5.04 7.79 4.17 2.53 1.64
8.57 12.62 5.28 7.34 8.67 4.65 2.92 1.74
9.62 16.45 6.15 10.30 9.73 5.59 2.92 2.67
10.94 21.55 6.62 14.94 10.69 6.22 3.08 3.14
11.73 25.21 6.96 18.25 11.74 6.95 3.08 3.88
12.58 29.66 7.26 22.40 12.66 7.28 3.12 4.16
13.62 34.19 7.90 26.29 13.69 7.79 3.56 4.23
14.67 35.68 8.14 27.55 14.66 7.79 3.56 4.23
15.67 36.43 8.38 28.05 15.65 8.36 3.56 4.80
16.58 37.08 8.75 28.33 16.64 8.56 3.57 4.99
17.81 37.45 8.92 28.53 17.76 8.80 3.82 4.99
18.80 37.64 9.16 28.47 17.67 8.80 3.82 4.98
19.90 38.19 9.39 28.79 19.66 8.92 3.87 5.05
20.60 38.56 9.55 29.01