Kline R.B. Principles and Practice of Structural Equation Modeling
Подождите немного. Документ загружается.


64 CONCEPTS AND TOOLS
should add a constant to the reflected scores so that the minimum score is at least 1.0
before taking the inverse.
2. Negative skew. All the transformations just mentioned also work for negative
skew when they are applied as follows: First, reflect the scores, and then add a constant
so that the lowest score equals 1.0. Next, apply the transformation, and then reflect the
scores again to restore the original ordering (Osborne, 2002).
3. Other types of non-normality. Odd-root functions, such as X
1/3
, and sine func-
tions tend to bring in outliers from both tails of the distribution toward the mean. Odd-
powered polynomial transformations, such as X
3
, may help for negative kurtosis.
There are many other kinds of transformations, and this is one of their potential prob-
lems: It can be difficult to find one that works with a particular set of scores. A class
of power transformations known as Box–Cox transformations (Box & Cox, 1964)
may require less trial and error. The most basic form of the Box–Cox transformation is
defined only for positive data values, but you can always add a constant to the scores so
that there are no negative values. The basic Box–Cox transformation is
()
1
, if 0;
log , if 0.
X
X
X
λ
λ
−
λ≠
=
λ
λ=
(3.5)
where the exponent λ is a constant selected to normalize a set of scores. There are com-
puter algorithms for finding an optimal value of λ, one that both normalizes the scores
and results in the maximum correlation between the original and transformed scores.
It is relatively easy to find on the Internet macros for implementing the Box–Cox trans-
formation in SAS/STAT (e.g., Friendly, 2006). There are many variations on the basic
Box–Cox transformation, some for more specialized situations (Yeo & Johnson, 2000).
Box–Cox transformations are also applied in regression analyses to deal with heterosce-
dasticity, which is considered momentarily.
Other potential drawbacks of transformations are briefly considered. Some distribu-
tions can be so severely non-normal that basically no transformation will work. Another
problem is that the scale of the original variable is lost when scores are transformed. If
that scale is meaningful, such as postoperative survival time, then its loss could be a
sacrifice. Results of statistical analyses of transformed scores do not directly apply to
the original scores.
An example of using transformations to normalize the scores in Figure 3.2 where
SI = 3.10 and KI = 15.73 is presented next. I added a constant (–9.0) to these scores so
that the lowest score is 1.0 before applying the transformation X
1/2
. For the square-root-
transformed scores, SI = 1.24 and KI = 4.13. Even greater reduction in nonnormality for
these data is afforded by the transformation ln X, for which SI = –.04 and KI = .46 after
its application.
Data Preparation 65
linearity and homoscedasticity
Linear relations and homoscedasticity (uniform distributions) among residuals are
aspects of multivariate normality. The presence of bivariate curvilinear relations is easy
to detect by looking at scatterplots. It is possible in SEM to estimate curvilinear rela-
tions—and interaction effects, too—using the same basic method as in multiple regres-
sion. Chapter 12 deals with this topic.
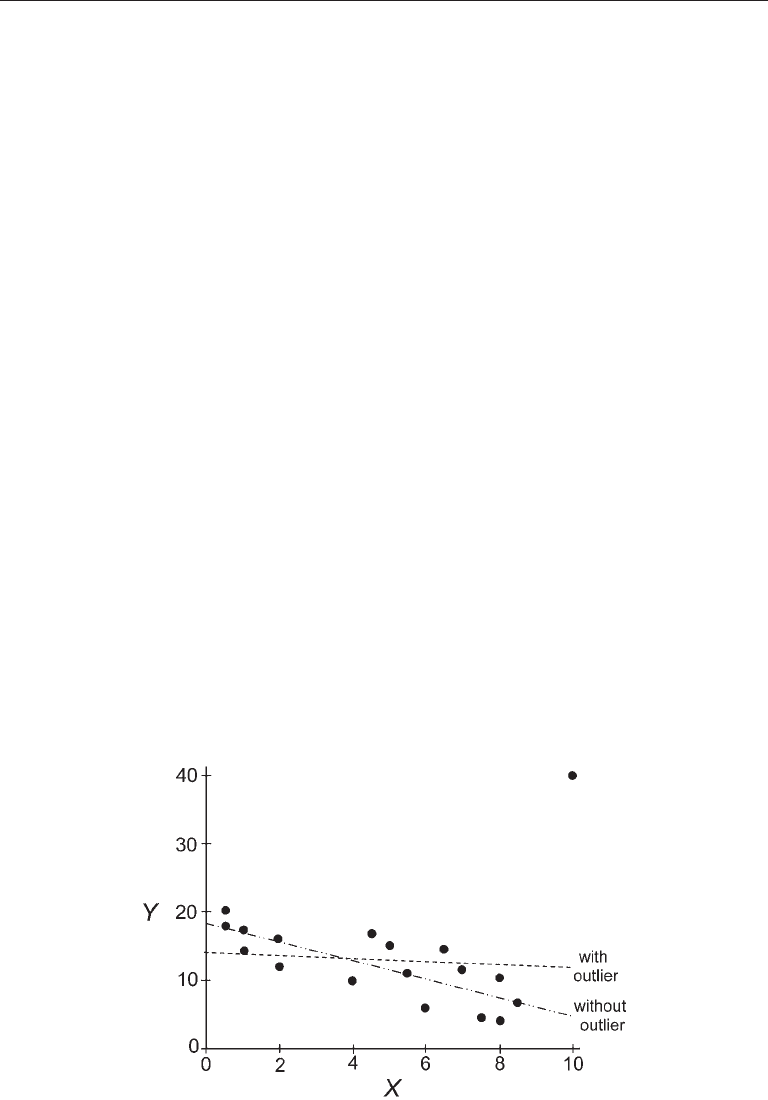
Heteroscedasticity (nonuniform distributions) among residuals may be caused by
non-normality in X or Y, more random error at some levels of X or Y than at others, or
outliers. For example, presented in Figure 3.3 is a scatterplot for N = 18 scores. One case
has an extreme score (40) on Y that is more than three standard deviations above the
mean. For these data, r
XY
= –.074, and the linear regression line is nearly horizontal.
However, these results are affected by the outlier. When the outlier case is removed,
then r
XY
= –.772 for N = 17, and the new regression line better fits the remaining data
(see Figure 3.3).
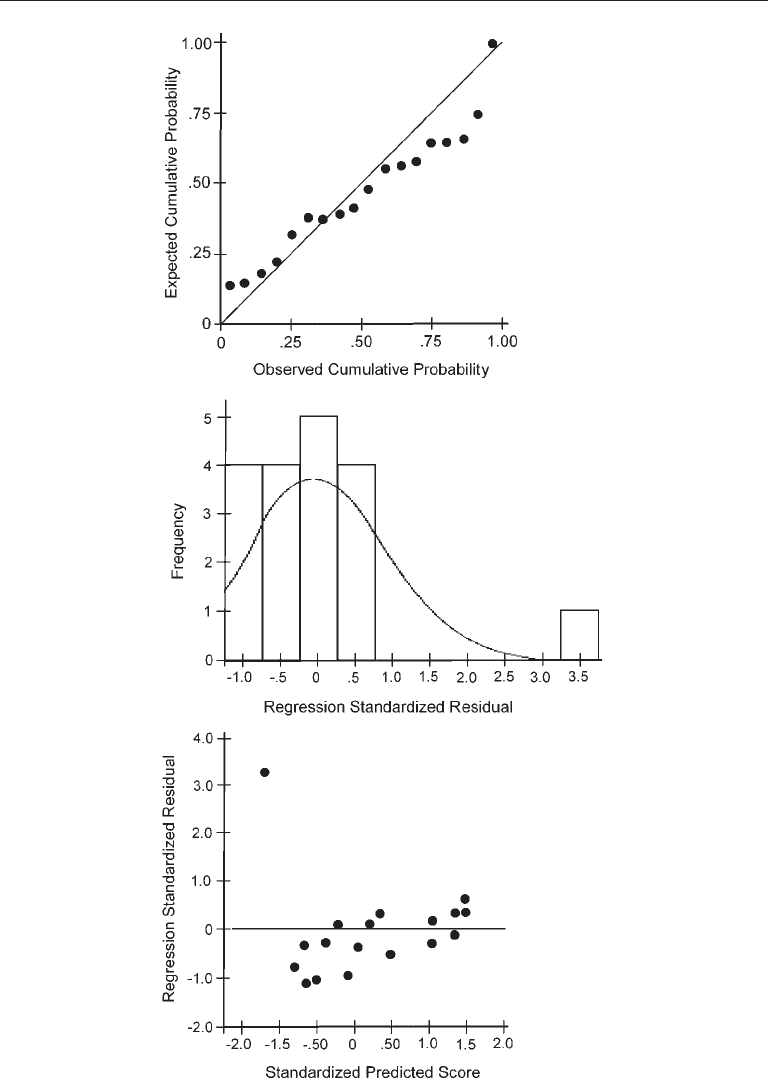
Presented in the top part of Figure 3.4 is the normal probability plot for the stan-
dardized regression residuals (converted to z scores) for the data in Figure 3.3 with
the outlier included. The plotted points of the expected versus observed cumulative
probabilities for the residuals clearly do not fall along a diagonal line. Presented in the
middle part of Figure 3.4 is the histogram of the standardized residuals for the same data
with a superimposed normal curve. Both kinds of displays just described indicate that
the residuals for the data in Figure 3.3 are not normally distributed when the outlier
is included. At the bottom of Figure 3.4 is a scatterplot of the standardized residuals
against the standardized predicted scores (
ˆ
Y
z
) for the same data. The residuals are not
evenly distributed around zero throughout the entire length of this scatterplot. See Bels-
ley, Kuh, and Welsch (2004) for more information about regression diagnostics.
FIgure 3.3. Scatterplot with outlier (N = 18) and the linear regression lines with and without
(N = 17) the outlier.
66 CONCEPTS AND TOOLS
FIgure 3.4. Plots for regression diagnostics: A normal probability plot of the standardized
residuals (top), a histogram of the standardized residuals (middle), and a scatterplot of the
standardized residuals and predicted scores (bottom) for the data in Figure 3.3 with the outlier
included (N = 18).

Data Preparation 67
Transformations can be helpful in remedying heteroscedasticity due to non-normal-
ity but may not be very useful when the cause is differential score reliability. Some het-
eroscedastic relations are expected, especially for developmental variables. For instance,
age is related to height, but variation in height increases from childhood to adulthood.
One way to take direct account of expected heterogeneity is to analyze a latent growth
model, in which it is no special problem to estimate different variances across occa-
sions of a repeated measures variable. The analysis of latent growth models in SEM is
discussed in Chapter 11.
relative variances
Covariance matrices in which the ratio of the largest to the smallest variance is greater
than, say, 10.0, are ill scaled. Analysis of an ill-scaled covariance matrix in SEM can
cause problems. Most estimation methods in SEM are iterative, which means that initial
estimates are derived by the computer and then modified through subsequent cycles of
calculation. The goal of iterative estimation is to derive better estimates at each stage,
ones that improve the overall fit of the model to the data. When improvements from step
to step become small, iterative estimation stops because the solution is stable. However,
if the estimates do not converge to stable values, then the process may fail. One cause is
variances of observed variables that are very different in magnitude, such as
2
X
s
= 12.00
and
2
Y
s
= .12. When the computer adjusts the estimates from one step to the next in an
iterative process for an ill-scaled matrix, the sizes of these changes may be huge for vari-
ables with small variances but trivial for others with large variances. Consequently, the
entire set of estimates may head toward worse rather than better fit.
To prevent this problem, variables with extremely high or low variances can be
rescaled by multiplying their scores by a constant, which changes the variance by a fac-
tor that equals the squared constant. For example:
2
X
s
= 12.00; so
2
.10X
s
×
= .10
2
× 12.00 = .12
Likewise:
2
Y
s
= .12; so
2
10Y
s
×
= 10
2
× .12 = 12.00
Rescaling a variable in this way changes its mean and variance but not its correlation
with other variables. This is because multiplying a variable by a constant is just a linear
transformation that does not affect relative differences among the scores. An example
with real data follows.
Roth, Wiebe, Fillingim, and Shay (1989) administered measures of exercise, hardi-
ness, fitness, stress, and illness in a sample of university students. Reported in Table 3.4
is a matrix summary of these data (correlations and variances). The largest variance and
smallest variances in this matrix (see the table) differ by a factor of more than 27,000,
so the covariance matrix is ill scaled. I have seen some SEM computer programs fail to

68 CONCEPTS AND TOOLS
analyze this matrix due to this characteristic. To correct this problem, I multiplied the
original variables by the constants listed in Table 3.4 (e.g., 10.0 for hardiness) in order
to make their variances more homogeneous. Among the rescaled variables, the largest
variance is 4,489.00 for stress, and the smallest variance is 1,354.24 for fitness, about a
4:1 ratio. The rescaled matrix is not ill scaled.
seleCtIng good Measures and rePortIng aBout theM
It is just as critical in SEM as in other types of statistical analyses to (1) select measures
with strong psychometric characteristics and (2) report these characteristics in written
summaries. This is because the product of measures, or scores, is what you analyze. If
the scores do not have good psychometric properties, then your results can be meaning-
less. Unfortunately, the quality of instruction about measurement has declined over the
last 30 years or so. For example, about one-third of psychology PhD programs in North
America offer no formal training in measurement, and measurement courses have dis-
appeared from many undergraduate psychology programs (Aiken, West, Sechrest, &
Reno, 1990; Frederich, Buday, & Kerr, 2000). This state of affairs puts both students
and established researchers in a difficult spot: They are expected to select measures for
their research, but they may lack the skills needed in order to critically evaluate those
measures.
It also seems that lax education about measurement has begotten widespread poor
reporting practices in our research literature. For example, Vacha-Haase, Ness, Nilsson,
and Reetz (1999) found no mention of score reliability in one-third of the articles pub-
lished from 1990 to 1997 in three different counseling or psychology journals. Only
about one-third reported reliability coefficients for the scores actually analyzed in the
study, and the rest described score reliability information from previous studies or
taBle 3.4. example of an Ill-scaled data Matrix
Variable 1 2 3 4 5
1. Exercise
—
2. Hardiness
−.03 —
3. Fitness
.39 .07 —
4. Stress
−.05 −.23 −.13 —
5. Illness
−.08 −.16 −.29 .34 —
Original s
2
4,422.25 14.44 338.56 44.89 390,375.04
Constant
1.00 10.00 2.00 10.00 .10
Rescaled s
2
4,422.25 1,440.00 1,354.24 4,489.00 3,903.75
Rescaled SD
66.50 37.95 36.80 67.00 62.48
Note. These data (correlations and variances) are from Roth et al. (1989); N = 373. Note that low scores on
the hardiness measure used by these authors indicate greater hardiness. In order to avoid confusion due to
negative correlations, the signs of the correlations that involve the hardiness measure were reversed before
they were recorded in this table.

Data Preparation 69
sources, such as test manuals. The latter practice is reliability induction. Too many
authors who invoke reliability induction (inferring from particular coefficients calcu-
lated in other samples to a different population) fail to explicitly compare characteristics
of their sample with those from cited studies.
Thompson and Vacha-Haase (2000) speculated that another cause of poor reporting
practices is the apparently widespread but false belief that it is tests that are reliable or
unreliable, not scores in a particular sample. That is, if researchers believe that reliabil-
ity, once established, is an immutable property of the test, then they may put little effort
into estimating score reliability in their own samples. They may also adopt a “black box”
view of reliability that assumes that reliability can be established by others, such as a
select few academics who conduct measurement research. This false belief also implies
that it is wasteful to devote significant resources to teaching about measurement.
Fortunately, there are some bright spots in this otherwise bleak picture. If you have
already taken a measurement course, then you are at some advantage in learning about
SEM. Otherwise, you are encouraged to recognize that this gap in your background
is a potential handicap. Formal coursework is not the only way to learn more about
measurement. Just like learning about SEM, more informal ways to learn measurement
theory include participation in seminars or workshops and self study. For self-study
I recommend Thorndike and Thorndike-Christ (2010) as a good undergraduate-level
book and Nunnally and Bernstein (1994) as a strong graduate-level book that covers
both classical test theory and more modern approaches.
score reliability
Score reliability, the degree to which scores in a particular sample are free from random
measurement error, is estimated as one minus the proportion of total observed variance
due to random error. These estimates are reliability coefficients, and a reliability for the
scores of variable X is often designated with the symbol r
XX
. Because r
XX
is a proportion
of variance, its theoretical range is 0–1.00. For example, if r
XX
= .80, then it is estimated
that 1 – .80 = .20, or 20% of total observed score variance is due to random error. As r
XX
approaches zero, the scores are more and more like random numbers, and random num-
bers measure nothing. It can happen that an empirical reliability coefficient is less than
zero. A negative reliability coefficient is usually interpreted as though its value were
zero, but such a result (r
XX
< 0) indicates a serious problem with the scores.
The type of reliability coefficient reported most often in the literature is coefficient
alpha also called Cronbach’s alpha. This statistic measures internal consistency reli-
ability, the degree to which responses are consistent across the items within a measure.
If internal consistency is low, then the content of the items may be so heterogeneous
that the total score is not the best possible unit of analysis for the measure. A conceptual
equation is
α
C
=
1 ( 1 )
ij
ij
nr
nr+−
(3.6)

70 CONCEPTS AND TOOLS
where n is the number of items (not cases) and
ij
r
is the average Pearson correlation
between all pairs of items. For example, given n = 20 items with a mean interitem cor-
relation of .30, then
α
C
= 20 (.30)/[1 + (20 – 1) .30] = .90
Internal consistency reliability is greater as there are more items, or the mean inter-
item correlation is increasingly positive. In manifest variable analyses where there is
no direct representation of latent variables, it is generally best to analyze measures that
are internally consistent. This is also generally good advice for latent variable methods,
including SEM, but see Little, Lindenberger, and Nesselroade (1999, p. 207) for more
information about some exceptions to this general rule.
Estimation of other kinds of score reliability may require multiple measurement
occasions, test forms, or examiners. For example, test–retest reliability involves the
readministration of a measure to the same group on a second occasion. If the two sets of
scores are highly correlated, then random error due to temporal factors may be minimal.
Alternate- (parallel-) forms reliability involves the evaluation of the stability of scores
across different versions of the same test. Interrater reliability is relevant for subjec-
tively scored measures: if independent examiners do not consistently agree in their scor-
ing, then examiner-specific factors may contribute unduly to observed score variability.
In manifest variable analyses, there is no gold standard as to how high coefficients
should be in order to consider score reliability as “good,” but here are some guidelines:
Generally, reliability coefficients around .90 are considered “excellent,” values around
.80 are “very good,” and values around .70 are “adequate.” If r
XX
< .50, most of the
observed score variance is due to random error, an unacceptable amount of imprecision
in most research. Note that somewhat lower levels of score reliability can be tolerated
in latent variable methods compared with observed variable methods, if the sample size
is sufficiently large (e.g., Little et al., 1999). Whenever possible—and it usually is, espe-
cially for internal consistency reliability—report score reliability coefficients in your
own samples. You should also cite values of reliability coefficients reported in other
published sources (reliability induction), but note that published coefficients may not
generalize to your particular sample. So tell your readers whether or not they do based
on similarities between your sample and samples described in published sources.
Low score reliability has many detrimental effects in manifest variable analyses.
Poor reliability reduces the power of statistical tests; it also generally attenuates effect
sizes below their true (population) values. Unreliability in the scores of two different
variables, X or Y, attenuates their observed correlation. This formula from classical mea-
surement theory shows the exact relation:
ˆ
max
XY
r
=
X X Y Y
rr
(3.7)
where
ˆ
max
XY
r
is the theoretical (estimated) maximum absolute value of the correla-
tion. That is, the absolute correlation between X and Y can equal 1.00 only if scores on

Data Preparation 71
both variables are perfectly reliable. Suppose that r
XX
= .10 and r
YY
= .90. Given this
information, the theoretical maximum absolute value of r
XY
can be no higher than (.10 ×
.90)
1/2
, or .30. A variation of Equation 3.7 is the correction for attenuation:
ˆ
XY
XY
X X YY
r
r
rr
=
(3.8)
where
ˆ
X Y
r
is the estimated validity coefficient if scores on both measures were perfectly
reliable and r
XY
is the observed (sample) validity coefficient. In general,
ˆ
X Y
r
is greater in
absolute value than r
XY
. For example, given r
XY
= .30, r
XX
= .90, and r
YY
= .40, then
ˆ
X Y
r
=
.50. That is, we expect that the “true” correlation between X and Y would be .50, if scores
on both measures were perfectly reliable. Because disattenuated correlations are only
estimates, it can happen that their absolute values exceed 1.00. Disattenuating observed
correlations is one way to take measurement error into account. A better way to do so is
to use SEM where constructs are specified as latent variables, each measured by multiple
indicators (i.e., analyze a measurement model). In fact, SEM is much more accurate at
estimating correlations between factors or between indicators and factors than manifest
variable methods (e.g., Little et al., 1999). Indeed, this property of SEM provides a major
motivation for its use over observed variable methods.
score validity
Score validity concerns the soundness of the inferences based on the scores, and infor-
mation about score validity conveys to the researcher whether applying a test is capable
of achieving certain aims. All forms of score validity are subsumed under the broader
concept of construct validity, which concerns whether scores measure the hypotheti-
cal construct the researcher believes they do. Hypothetical constructs are not directly
observable (they are latent) and thus can be measured only indirectly through observed
scores, or indicators. Messick (1995) expanded the concept of construct validity to
include the relevance, utility, value implications, and social consequences of test use and
interpretation. An example of the social consequences of testing includes the accurate
and fair assessment of scholastic skills among minority children.
There is no single, definitive test of construct validity, nor is it established in a single
study. Instead, measurement-related research usually concerns a particular facet of con-
struct validity. Also, the relative importance of these facets usually depends on the con-
text (setting, values, etc.), content (which trait is assessed), and goals of measurement.
For example, the facet of criterion-related validity concerns whether the scores (X)
relate to an external criterion (Y) against which the scores can be evaluated. Specifically,
are sample values of r
XY
large enough to support the claim that a test explains an appre-
ciable amount of the variability on the criterion? Whether an admissions test for univer-
sity predicts eventual grade point average is a question of criterion-related validity.
Convergent validity and discriminant validity involve the evaluation of measures
against each other instead of against an external standard. A set of variables presumed
to measure the same construct shows convergent validity if their intercorrelations are

72 CONCEPTS AND TOOLS
at least moderate in magnitude. In contrast, a set of variables presumed to measure dif-
ferent constructs shows discriminant validity if their intercorrelations are not too high.
If r
XY
= .90, for instance, then we can hardly say that variables X and Y measure distinct
constructs. The SEM technique of confirmatory factor analysis (CFA) is one statistical
tool (among others) for testing hypotheses about convergent and discriminant validity
(Chapter 9).
Another facet of score validity is content validity, which concerns whether test
items are representative of the domains they are supposed to measure. Content valid-
ity is often a critical concern for achievement tests, especially tests that are supposed
to measure skills specific to a particular grade level, such as Grade 3 mathematics. It
is important for other kinds of tests, too, such as symptom rating scales and attitude
scales. For example, the items of a depression rating scale should represent the symp-
toms domains that make up clinical depression, including vegetative symptoms (e.g.,
poor sleep) and negative self-evaluation. Expert opinion is the basis for establishing
content validity, not statistical analysis.
As in other kinds of statistical methods in the behavioral sciences, SEM requires
the analysis of measures with good evidence for score validity. Because score reliability
is generally required for score validity—but does not guarantee it—this requirement
includes good score reliability, too (but see Little et al., 1999, for discussion of some
exceptions to this general rule in SEM). Otherwise, the accuracy of the interpretation
of the results is doubtful. That is, using SEM does not somehow free researchers from
having to think about measurement.
suMMarY
The most widely used estimation methods in SEM require screening the data for multi-
variate normality. It is also critical to select appropriate methods for handling missing
data. These methods generally assume that the data loss pattern is random. The pair-
wise deletion of incomplete cases may be problematic because it can lead to covariance
matrices that are not positive definite, and a positive definite data matrix is generally
required in SEM. Computer tools for SEM typically accept either raw data files or matrix
summaries of the data. Because most estimation methods in SEM assume the analysis
of unstandardized variables, a covariance matrix is preferred over a correlation matrix
without standard deviations when a matrix summary is the input and means are not
analyzed. In written reports of the analysis you should provide information about the
psychometric characteristics of your scores, such as their reliability, in your own sam-
ples. The analysis of measures with poor score reliability or validity can jeopardize the
integrity of the results. Computer tools for SEM are described in the next chapter.
reCoMMended readIngs
Allison (2003) gives clear descriptions of missing data techniques for SEM, including the spe-
cial ML method for incomplete raw data files. Little, Lindenberger, and Nesselroade (1999)

Data Preparation 73
describe a conceptual and statistical framework for understanding the relation between indica-
tor selection, indicator psychometric characteristics, and construct measurement. Peng, Har-
well, Liou, and Ehman (2007) describe modern techniques for analyzing incomplete data and
characteristics of software tools in this area. Wothke (1993) offers many helpful suggestions
for diagnosing nonpositive definiteness in data matrices and other instances of this problem
in SEM. You can find a concise summary of score reliability and related topics in Thompson
(2003).
Allison, P. D. (2003). Missing data techniques for structural equation modeling. Journal of
Abnormal Psychology, 112, 545–557.
Little, T. D., Lindenberger, U., & Nesselroade, J. R. (1999). On selecting indicators for multivari-
ate measurement and modeling with latent variables: When “good” indicators are bad
and “bad” indicators are good. Psychological Methods, 4, 192–211.
Peng, C.-Y. J., Harwell, M., Liou, S.-M., & Ehman, L. H. (2007). Advances in missing data
methods and implications for educational research. In S. S. Sawilowsky (Ed.), Real data
analysis (pp. 31–78). Charlotte, NC: IAP.
Thompson, B. (Ed.). (2003). Score reliability. Thousand Oaks, CA: Sage.
Wothke, W. (1993). Nonpositive definite matrices in structural equation modeling. In K. A.
Bollen & J. S. Long (Eds.), Testing structural equation models (pp. 256–293). Newbury
Park, CA: Sage.
eXerCIses
1. Calculate the correlation matrix given the covariance matrix in lower diagonal
form for variables X, W, and Y (in this order) presented next:
42.25
31.72 148.84
63.05 82.84 376.36
2. Presented next are scores for 10 cases reported as (X, Y, W) and where a miss-
ing observation is coded as –9. Enter these scores into a data file with the
appropriate missing data specification. Calculate the bivariate correlations
using listwise deletion, pairwise deletion, and mean substitution. Describe the
results:
(–9,15,–9), (1 2,23,48), (13,25,38), (–9,18,38),
(15,20,39), (13,1 5,35), (17,–9,36), (18,24,47),
(19,21,42), (17,–9,–9)
3. Given cov
XY
= 13.00,
2
X
s
= 12.00, and
2
Y
s
= 10.00, show that the corresponding
correlation is out of bounds.
4. Calculate the covariance matrix for the incomplete data in Table 3.3 using pair-
wise deletion. Show that this matrix is nonpositive definitive. Also show that
the corresponding correlation matrix contains an out-of-bounds value.