Jackson S.L. Research Methods and Statistics: A Critical Thinking Approach
Подождите немного. Документ загружается.

402
■ ■
APPENDIX C
7. test-retest reliability
8. Interrater reliability
9. Content validity
10. construct validity
Multiple-Choice Self-Test Answers
1. d
2. b
3. a
4. b
5. a
6. b
7. a
8. d
9. c
10. b
11. d
12. b
Chapter 4
1. This research might best be conducted using
some form of naturalistic observation. It would
probably be best to use a disguised type of
observation, either nonparticipant or par-
ticipant. Thus, the researcher could have data
collectors stationed at all of the locations of
interest. These individuals either could be hid-
den or could appear to be part of the natural
environment. In either situation, drivers would
not notice that data were being collected. If the
data recorders were hidden, they could use a
checklist. However, if the data recorders were
disguised participants, then a narrative record
might be best so that drivers would not notice
they were being observed. Thus, the person
collecting data could either use a hidden tape
recorder or communicate with another individ-
ual by cell phone. The concerns would be those
already indicated.
3. a. This is a loaded question because of the
phrases capitalist bankers and such high
interest rates. A better question would be “Do
you believe bankers charge appropriate inter-
est rates on credit card balances?”
b. The problem with this question is in the alter-
natives. Students who charged an amount
between the alternatives (say, $450) would not
know which alternative to choose.
c. This is a leading question. The phrase Most
Americans believe leads the respondent to
agree with the question. A better question
would be “Do you believe that a credit card
is a necessity?”
Answers to Chapter 4
Review Exercises
Fill-in Self-Test Answers
1. nonparticipant
2. ecological validity
3. disguised
4. Narrative records
5. static
6. Sampling bias
7. socially desirable response
8. random selection
9. Stratified random sampling
10. closed-ended questions
11. rating scale
12. leading question
Multiple-Choice Self-Test Answers
1. c
2. a
3. a
4. c
5. b
6. a
7. b
8. d
9. a
10. d
11. c
12. a
13. b
14. a
Chapter 5
1. Speed f rf
62 1 .05
64 3 .15
65 4 .20
67 3 .15
68 2 .10
70 2 .10
72 1 .05
10017_17_appndixC.indd 402 2/1/08 1:42:28 PM
Answers to Odd-Numbered Chapter Exercises and All Review Exercises
■ ■
403
Speed f rf
73 1 .05
76 1 .05
79 1 .05
80 1 .05
20 1.00
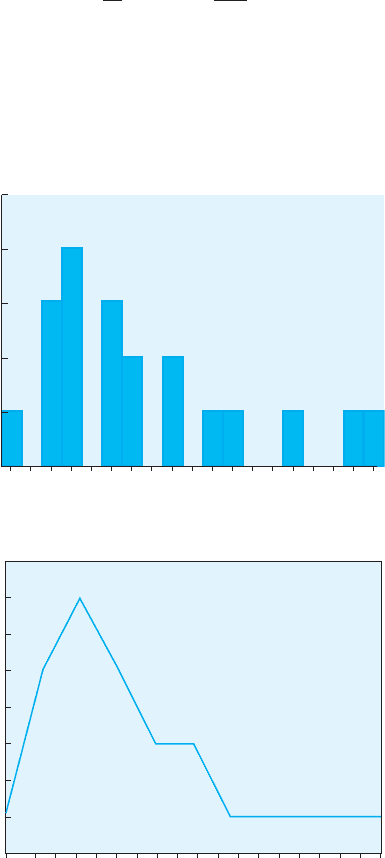
3. Either a histogram or a frequency polygon could
be used to graph these data. Because of the
continuous nature of the speed data, a frequency
polygon might be more appropriate. Both a his-
togram and a frequency polygon of the data are
shown here.
0
1
2
3
4
5
7068666462 80787674727169676563 79777573
Speed (mph)
Frequency
0
1.0
2.0
3.0
3.5
4.5
2.5
1.5
4.0
68 7067656462 8079767372
Speed (mph)
Frequency
5. a.
X 7.3
Median 8.5
Mode 11
b.
X 4.83
Median 5
Mode 5
c.
X 6.17
Median 6.5
Mode 3, 8
d.
X 5.5
Median 6
Mode 6
7. a. z 2.57; proportion of cars that cost an
equal amount or more .0051
b. z 2.0; proportion of cars that cost an equal
amount or more .9772
c. z 2.0; percentile rank 97.72
d. z 3.14; percentile rank 0.08
e. z 3.14, z 2.0; proportion between
.4992 .4772 .9764
f. 16th percentile converts to a z-score of 0.99;
0.99(3,500) 23,000 $19,535
9. X z-Score Percentile Rank
Ken 73.00 0.22 41.29
Drew 88.95 1.55 93.94
Cecil 83.28 0.92 82.00
Answers to Chapter 5
Review Exercises
Fill-in Self-Test Answers
1. frequency distribution
2. qualitative
3. histogram
4. central tendency
5. median
6. variation
7. average deviation
8. unbiased estimator
9. population; sample
10. positively
11. z-score
12. standard normal distribution
Multiple-Choice Self-Test Answers
1. c
2. d
3. d
4. c
5. b
6. b
7. c
10017_17_appndixC.indd 403 2/1/08 1:42:29 PM
404
■ ■
APPENDIX C
8. a
9. a
10. a
11. b
12. b
13. b
14. a
15. c
Answers to Self-Test Problems
1.
X 6.25, Md 6.5, Mo 11
2. range 6, A.D. 2, 2.26
3. a. z 1.67, proportion .9526
b. z .80, percentile rank 78.81
c. $87,400
Chapter 6
1. The first problem is with the correlation coeffi-
cient that was calculated. Correlation coefficients
can vary between 1.0 and 1.0; they cannot be
greater than ±1.0. Thus, the calculated correla-
tion coefficient is incorrect. Second, correlation
does not mean causation. Thus, observing a cor-
relation between exercise and health does not
mean we can conclude that exercise causes bet-
ter health—they are simply related.
3. We would expect the correlation between GRE
scores and graduate school GPAs to be much
lower than that between SAT scores and under-
graduate GPAs because both GRE scores and
graduate school GPAs are restricted in range.
5. IQ with psychology exam scores: r .553,
r
2
30.6%
IQ with statistics exam scores: r .682, r
2
46.5%
Psychology exam scores with statistics exam
scores: r .626, r
2
39.2%
All of the correlation coefficients are of moderate
strength, with the correlation between IQ scores
and statistics exam scores being the strongest
and accounting for the most variability.
Answers to Chapter 6
Review Exercises
Fill-in Self-Test Answers
1. scatterplot
2. negative
3. causality; directionality
4. restricted range
5. Pearson product-moment
6. point-biserial
7. coefficient of determination
8. Regression analysis
Multiple-Choice Self-Test Answers
1. c
2. b
3. c
4. c
5. d
6. b
7. d
8. a
9. a
10. c
11. b
12. a
Chapter 7
1. H
0
:
freshmen
all other classes
, or
H
0
:
freshmen
all other classes
H
a
:
freshmen
>
all other classes
This is a one-tailed test.
3. H
0
:
family size now
family size in previous decade
, or
H
0
:
family size now
family size in previous decade
H
a
:
family size now
>
family size in previous decade
This is a one-tailed test.
5. a. Type I error
b. Type II error
c. Type I error
d. Type II error
7. a. This is a one-tailed test.
b. H
0
:
private HS
HS in general
, or
H
0
:
private HS
HS in general
H
a
:
private HS
HS in general
c. z
obt
2.37
d. z
cv
±1.645 (one-tailed critical value)
e. Reject H
0
. High school students at private high
schools score significantly higher on the SAT.
f. The 95% CI is 1008.68–1091.32.
9. The t distributions are a family of symmetrical
distributions that differ for each sample size.
Therefore, t
cv
changes for samples of different
sizes. We must compute the degrees of freedom
in order to determine t
cv
.
11. a. This is a one-tailed test.
b. H
0
:
headphones
no headphones
, or
H
0
:
headphones
no headphones
H
a
:
headphones
no headphones
c. t
obt
–3.37
d. t
cv
–1.796
10017_17_appndixC.indd 404 2/1/08 1:42:30 PM
Answers to Odd-Numbered Chapter Exercises and All Review Exercises
■ ■
405
e. Reject H
0
. Those who listen to music via head-
phones score significantly lower on a hearing
test.
f. The 95% CI is 16.43–21.23.
13. It is appropriate to use a chi-square test when the
data are nominal and no parameters are known.
15. a.
obt
2
8.94
b. df 1
c.
cv
2
3.841
d. The number of students who go on to college
from the teacher’s high school is significantly
greater than the number in the general
population.
Answers to Chapter 7
Review Exercises
Fill-in Self-Test Answers
1. null
2. one-tailed (directional)
3. Type I
4. statistical significance
5. Nonparametric
6. sampling distribution
7. standard error of the mean
8. Student’s t distribution
9. t test
10. Observed; expected
Multiple-Choice Self-Test Answers
1. b
2. b
3. c
4. c
5. a
6. d
7. b
8. b
9. d
10. a
11. a
12. d
13. d
14. d
Answers to Self-Test Problems
1. a. one-tailed
b. H
0
:
chess
general population
, or
H
0
:
chess
general population
H
a
:
chess
general population
c. z
obt
3.03
d. z
cv
±1.645
e. Reject H
0
. Students who play chess score
significantly higher on the SAT.
f. The 95% CI is 1024.74–1115.26.
2. a. one-tailed
b. H
0
:
classical music
general population
, or
H
0
:
classical music
general population
H
a
:
classical music
general population
c. t
obt
3.05
d. t
cv
±1.796
e. Reject H
0
. Those who listen to classical music
score significantly higher on the concentration
test.
f. The 95% CI is 16.43–21.23.
3. a.
obt
2
1.45
b. df 1
c.
cv
2
3.841
d. The percentage of people who smoke in the
South does not differ significantly from that
in the general population.
Chapter 8
1. This is a between-participants design. If partici-
pants are randomly assigned to one of the two
conditions, then different participants are used
in each condition.
3. It is possible that there was a ceiling effect.
In other words, the test was so easy that
everyone in the class did well (performed at
the top). In this case, the test was not sensitive
enough to detect differences in knowledge of
biology.
5. A Latin square design allows a researcher to use
a form of incomplete counterbalancing. Thus,
with designs that have several conditions, the
researcher uses as many orders as there are
conditions. For example, in a design with four
conditions, the researcher uses 4 orders rather
than the 24 orders that would be necessary if
complete counterbalancing were used. This
means that the research can still counterbalance
the study without the counterbalancing proce-
dure becoming too difficult.
Answers to Chapter 8
Review Exercises
Fill-in Self-Test Answers
1. between-participants design
2. random assignment
10017_17_appndixC.indd 405 2/1/08 11:00:57 PM
406
■ ■
APPENDIX C
3. pretest-posttest control group design
4. Internal validity
5. maturation effect
6. instrumentation
7. diffusion of treatment
8. double-blind
9. ceiling
10. external validity
11. conceptual
12. order effects
Multiple-Choice Self-Test Answers
1. a
2. b
3. c
4. b
5. c
6. b
7. c
8. d
9. d
10. b
11. d
12. b
Chapter 9
1. a. An independent-samples t test should be
used.
b. H
0
:
females
males
H
a
:
females
males
c. t (12) 0.79, not significant
d. Fail to reject H
0
. There are no signifi-
cant differences in the amount of study
time per week for females versus
males.
e. Not necessary
f. Not necessary
3. a. A correlated-groups t test should be used.
b. H
0
:
before
after
, or
H
0
:
before
after
H
a
:
before
after
c. t (5) 6.82, p < .005
d. Reject H
0
. Participating in sports leads to
significantly higher self-esteem scores.
e. d 2.78, a large effect size, and r
2
.90, a
large effect size.
f.
35
37
39
41
43
45
After SportsBefore Sports
Test Condition
Self-esteem
g. The 95% CI is .93–2.07.
5. a. The Wilcoxon rank-sum test should be used.
b. H
0
: Md
no service
Md
service
, or
H
0
: Md
no service
Md
service
H
a
: Md
no service
Md
service
c. W(n
1
6, n
2
6) 23.5, p .01
d. Yes, reject H
0
. Students who completed com-
munity service had significantly higher matu-
rity scores.
7. a. The Wilcoxon matched-pairs signed-ranks
T test should be used.
b. H
0
: Md
red sauce
Md
green sauce
, or
H
0
: Md
red sauce
Md
green sauce
H
a
: Md
red sauce
Md
green sauce
c. T(N 7) 3, not significant
d. Fail to reject H
0
. Taste scores for the two
sauces did not differ significantly.
9. a. A t test for independent groups should be used.
b. A Wilcoxon’s rank-sum test should be used.
c. A chi-square test of independence should be
used.
d. A t-test for independent groups should be used.
Answers to Chapter 9
Review Questions
Fill-in Self-Test Answers
1. independent-groups t test
2. Cohen’s d or r
2
3. correlated-groups t test
4. difference scores
5. standard error of the difference scores
10017_17_appndixC.indd 406 2/1/08 1:42:31 PM
Answers to Odd-Numbered Chapter Exercises and All Review Exercises
■ ■
407
6. observed; expected
7. Wilcoxon rank-sum test
8.
2
test of independence
9. phi coefficient
10. matched-pairs signed-ranks T
11. between-participants
12. nominal; ordinal
Multiple-Choice Self-Test Answers
1. b
2. a
3. a
4. b
5. c
6. d
7. b
8. c
9. a
10. c
11. a
12. d
13. d
14. d
15. c
16. c
17. b
18. a
Answers to Self-Test Problems
1. a. An independent-groups t test.
b. H
0
:
1
2
, H
a
:
1
2
c. t(10) 2.99, p < .02
d. Reject H
0
. Females spend significantly more
time volunteering than males.
e. d 1.72 or r
2
.47. This is a large effect size.
f.
0
10
20
30
40
50
FemalesMales
Gender
Time
g. The 95% CI is 21.51 to 3.15.
2. a. A correlated-groups t test.
b. H
0
:
1
2
, H
a
:
1
2
c. t(5) 2.78, p .05
d. Reject H
0
. When participants studied with music,
they scored significantly lower on the quiz.
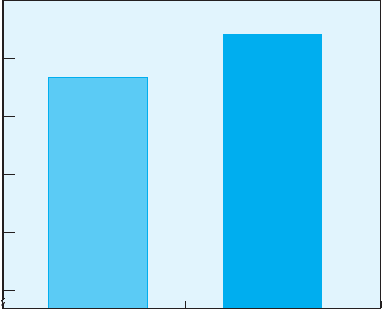
e.
16
16.5
17
17.5
18
No MusicMusic
Study Condition
Quiz Score
f. The 95% CI is 1.93- .07.
3. a. The Wilcoxon rank-sum test.
b. H
0
: Md
red
Md
green
, or H
0
: Md
red
Md
green
H
a
: Md
red
Md
green
c. W
s
(n
1
7, n
2
7) 41, not significant.
d. No. Fail to reject H
0.
There is no significant
difference in tastiness scores.
4. a. The
2
test for independence.
b. H
0
: There is no difference in the frequency of
workout preferences for males and females.
H
a
: There is a difference in the frequency of
workout preferences for males and females.
c.
2
(N 68) 8.5, p < .01.
d. Reject H
0
. There is a significant difference
in the frequency of workout preferences for
males and females. Females prefer to work
out together more than males.
Chapter 10
1. Conducting a study with three or more levels
of the independent variable allows a researcher
to compare more than two kinds of treatment
in one study, to compare two or more kinds of
treatment with a control group, and to compare
a placebo group with both the control and exper-
imental groups.
3. Between-groups variance is the variance attrib-
utable to both systematic variance and error
variance. Systematic variance may be due either
to the effects of the independent variable or
to confounds. Error variance may be due to
chance, sampling error, or individual differences.
10017_17_appndixC.indd 407 2/2/08 12:02:52 AM
408
■ ■
APPENDIX C
Within-groups variance is always due to error
variance (once again due to chance, sampling
error, or individual differences).
5. If H
0
is true, then there is no effect of the inde-
pendent variable and thus no systematic variance.
The F-ratio is error variance divided by error
variance and should be equal or close to 1. If H
a
is supported, then there is systematic variance in
addition to error variance in the numerator, and
therefore the F-ratio will be greater than 1.
7. Eta-squared tells us how much of the variability
in the dependent variable can be attributed to
the independent variable.
9. a.
Source df SS MS F
Between groups 3 187.75 62.58 18.14
Within groups 16 55.20 3.45
Total 19 242.95
b. Yes, F (3, 16) 18.14, p .01.
c. HSD
.05
3.36
HSD
.01
4.31
d. The amount of sleep had a significant effect on
creativity. Specifically, those who slept for 6 or
8 hours scored significantly higher on creativ-
ity than those who slept for either 2 or 4 hours.
e. The effect size (
2
) is 77%. Thus, knowing the
sleep condition to which participants were
assigned can explain 77% of the variability in
creativity scores.
f.
0
2
4
6
8
10
6842
Creativity Score
Hours of Sleep
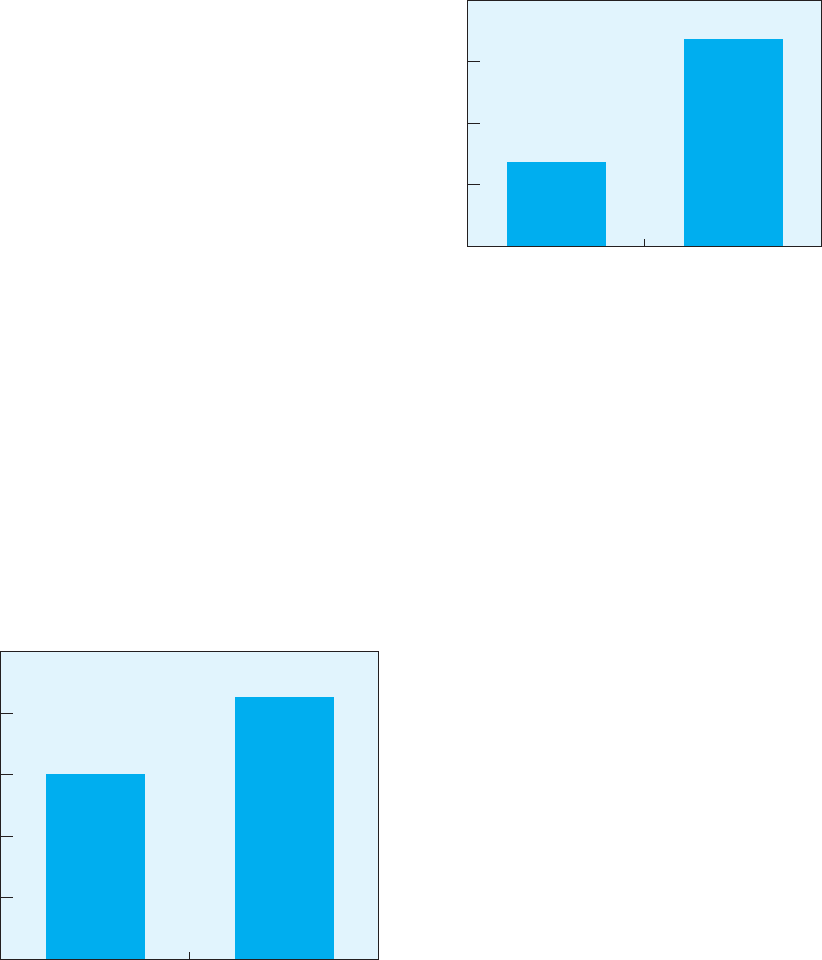
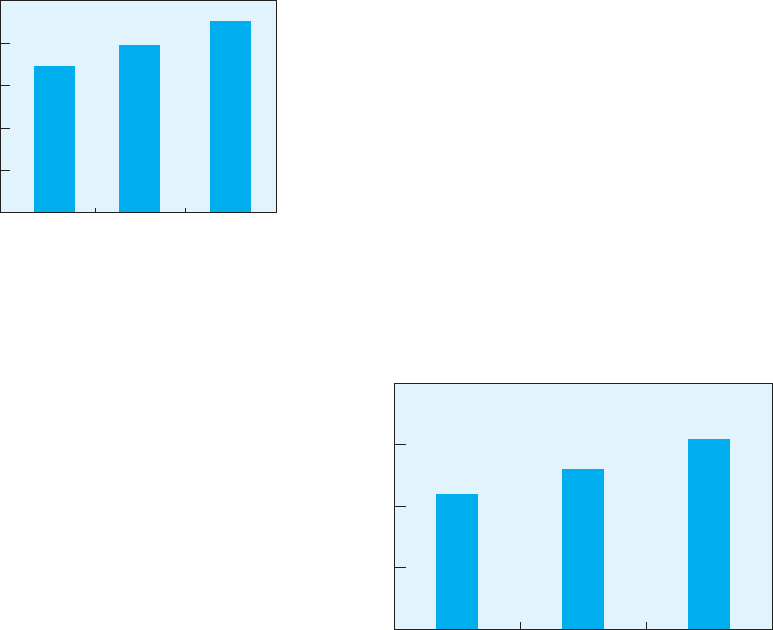
11. a.
Source df SS MS F
Between groups 2 4,689.27 2,344.64 0.77
Within groups 27 82,604.20 3,059.41
Total 29 87,293.47
b. No, F (2, 27) 0.77, not significant.
c. Not necessary
d. The level of exercise did not affect stress level.
There was, however, a very large amount of
error variance.
e. The effect size (
2
) is 5%. Knowing the
exercise condition to which a participant was
assigned does not account for much of the
variability in stress scores.
f.
0
20
40
60
80
90
60
30
Stress Index
Exercise Condition
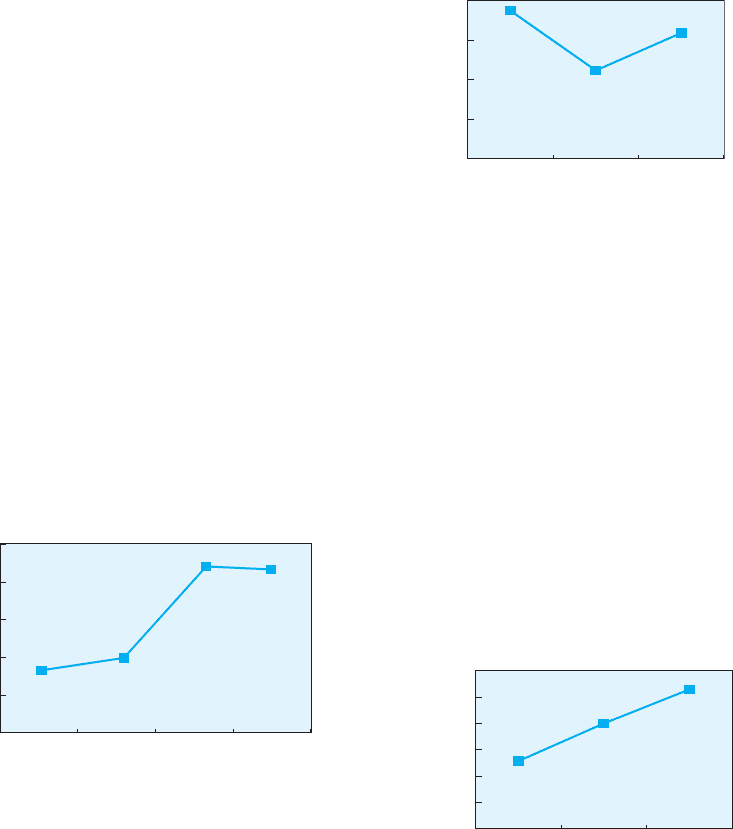
13. a.
Source df SS MS F
Participant 6 16.27 2.71
Between 2 25.81 12.91 31.49
Error 12 4.87 0.41
Total 20 46.95
b. Yes, F (2, 12) 31.49, p .01
c. HSD
.05
0.905
HSD
.01
1.21
d. The amount of time practiced significantly
affects the accuracy of signal detection. Based
on post hoc tests, all group means differ sig-
nificantly from each other at the .01 alpha
level. That is, the group means indicate that as
practice increased, signal detection improved.
e. The effect size (
2
) is 55%. Knowing the
amount of time that an individual practiced
can account for 55% of the variability in
signal detection scores.
f.
0
1
2
3
4
5
6
2-Hours
1-Hour
None
Number of Signals
Detected
Amount of Practice
15. a.
Source df SS MS F
Participant 14 136.96 9.78
Between 2 3,350.96 1,675.48 94.02
Error 28 499.03 17.82
Total 44 3,986.95
10017_17_appndixC.indd 408 2/1/08 1:42:33 PM
Answers to Odd-Numbered Chapter Exercises and All Review Exercises
■ ■
409
b. Yes, F (2, 28) 94.02, p .01.
c. HSD
.05
3.85
HSD
.01
4.96
d. The type of study significantly affected exam
score. Specifically, the 6-day spaced condition
led to higher exam scores than either the
3-day spaced or the massed condition; and
the 3-day spaced condition led to better
scores than the massed condition.
e. The effect size (
2
) is 84%. Thus, knowing the
type of study used can account for 84% of the
variability in exam scores.
f.
0
20
40
60
80
100
6-Day
Spaced
3-Day
Spaced
T
y
pe of Stud
y
Massed
Exam Score
Answers to Chapter 10
Review Questions
Fill-in Self-Test Answers
1. Bonferroni adjustment
2. placebo
3. ANOVA
4. grand mean
5. between-groups
6. total sum of squares
7. mean square
8. Eta-squared
9. post hoc tests or Tukey’s HSD
10. repeated measures ANOVA
Multiple-Choice Self-Test Answers
1. b
2. d
3. b
4. b
5. a
6. c
7. a
8. d
9. c
10. a
11. a
Answers to Self-Test Problems
1. a.
Source df SS MS F
Participant 9 25
Between 2 150
Error 18 100
Total 29
HSD
.05
2.70; HSD
.01
3.52; eta-squared 55%.
2. a.
Source df SS MS F
Participant 5 9.12 1.82
Between 2 10.19 5.10 3.67
Error 10 13.90 1.39
Total 17 33.21
Note: If calculated by hand, your SS scores may
vary slightly due to rounding.
b. No, F (2, 10) 3.67, not significant.
c. Post hoc tests are not necessary, but here are
the answers if you want to practice:
HSD
.05
1.86; HSD
.01
2.53.
d. Type of pain killer did not significantly affect
effectiveness rating.
e. The effect size (
2
) is 31%. Thus, knowing the
type of pain killer taken can account for only
31% of the variability in effectiveness scores.
f.
0
2
4
6
8
IbuprofenAspirin Acetaminophen
Type of Pain Killer
Effectiveness Rating
Chapter 11
1. One advantage is that manipulating more than
one independent variable allows us to assess
how the variables interact, called an interaction
effect. In addition, because in the real world,
10017_17_appndixC.indd 409 2/1/08 1:42:33 PM
410
■ ■
APPENDIX C
behavior is usually contingent on more than one
variable, designing experiments with more than
one variable allows researchers to simulate a
real-world setting more effectively.
3. This is a 3 2 2 design (or a 2 2 3).
The independent variable Number of Hours
has three levels, the independent variable
Shallow/Deep Processing has two levels, and
the independent variable Group/Individual
study has two levels.
5. A 2 6 factorial design has two independent
variables. Therefore, there is the possibility for
two main effects—one for each variable—and
one interaction between them.
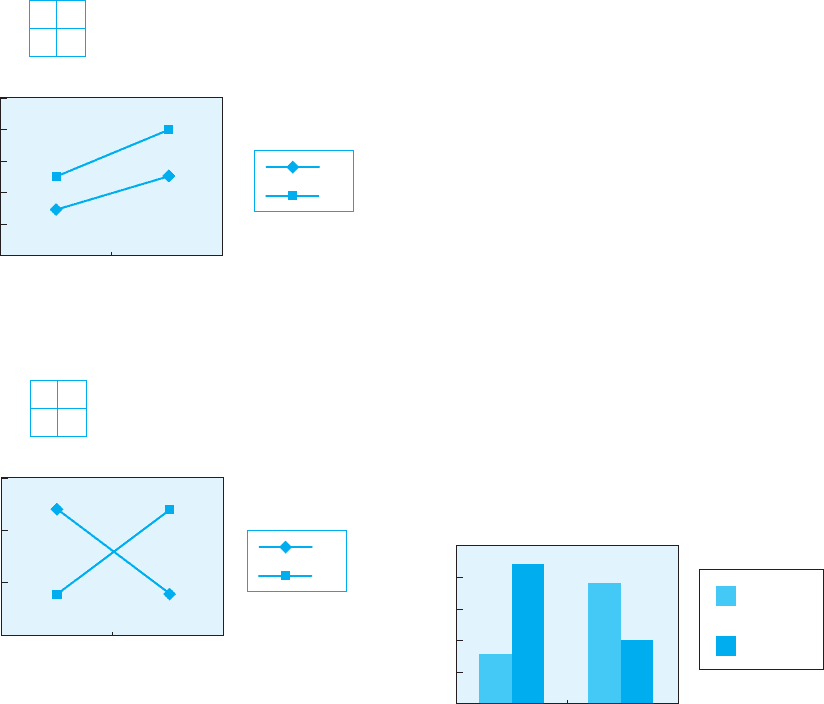
7.
B
1
B
2
0
2
4
6
8
10
21
Dependent Variable
Factor A
Experiment 1
B
1
B
2
A
1
A
2
3
5
5
8
A: Yes
B: Yes
A × B: No
B
1
B
2
0
5
10
15
21
Dependent Variable
Factor A
B
1
B
2
A
1
A
2
12
4
4
12
A: No
B: No
A × B: Yes
Experiment 2
9. No, one of the variables has only two levels. If
the F-ratio for that main effect is significant, it
means that there were significant differences
between those two groups, and Tukey’s post hoc
test is not necessary. However, it is necessary to
compute Tukey’s post hoc test for the main effect
of the variable with six levels. In this case, the
F-ratio tells us only that there is a significant dif-
ference between two of the groups, and we need
to determine how many of the groups differ sig-
nificantly from each other.
11. a.
Source df SS MS F
Gender 1 0.167 0.167 0.095
Pizza Brand 1 6.00 6.00 3.43
Gender Pizza 1 130.67 130.67 74.67
Error 20 35.00 1.75
Total 23 171.83
Note: If calculated by hand, your SS scores may
vary slightly due to rounding.
b. The only significant F-ratio is for the interac-
tion, F(1, 20) 74.67, p .01.
c. There is no significant effect of gender on
pizza preference. There is no significant effect
of pizza brand on pizza preference. There is
a significant interaction effect: The males pre-
fer the low-fat pizza over the regular pizza,
whereas the females prefer the regular over
the low-fat.
d. The effect size (
2
) is only .09% for gen-
der (gender accounts for less than .1% of
the variability in preference scores) and
3.5% for pizza brand. However, the effect
size is 76% for the interaction, meaning
that the interaction of gender and pizza
brand accounts for 76% of the variability in
preference scores.
e. Because the variable Gender is not
continuous, a bar graph is appropriate.
However, because most students find it easier
to interpret interactions with a line graph, this
type of graph is also provided and may be
used.
Low-Fat
Pizza
Regular
Pizza
0
2
4
6
8
10
MalesFemales
Pizza Preference
Gender
10017_17_appndixC.indd 410 2/1/08 1:42:34 PM
Answers to Odd-Numbered Chapter Exercises and All Review Exercises
■ ■
411
Low-Fat
Pizza
Regular
Pizza
0
2
4
6
8
10
MalesFemales
Pizza Preference
Gender
Answers to Chapter 11
Review Exercises
Fill-in Self-Test Answers
1. factorial notation
2. main effect
3. 2; 4; 6
4. 2; 1
5. SS
Error
6. eta-squared
Multiple-Choice Self-Test Answers
1. c
2. d
3. a
4. b
5. c
6. b
7. c
8. c
9. c
10. c
11. b
12. d
Answers to Self-Test Problems
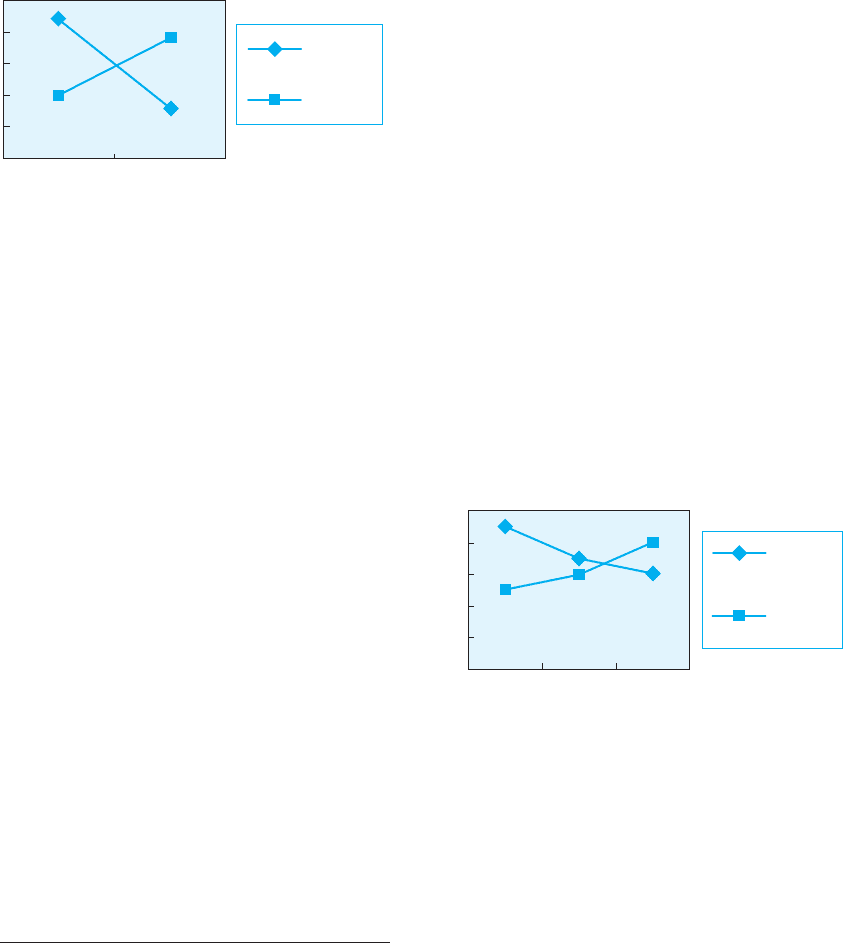
1. a. Morning Afternoon Evening
Lecture only 9 7 6
Lecture/small-group 5 6 8
This is a 2 3 factorial design.
b. ANOVA SUMMARY TABLE
Source df SS MS F
A (Time) 2 1.67 0.835 .63
B (Teaching Method) 1 7.50 7.50 5.64
A B 2 45.02 22.51 16.92
Within 24 32.00 1.33
Total 29 86.19
Note: If calculated by hand, your SS scores may
vary slightly due to rounding.
c. Factor A: F (2, 24) .63, not significant.
Factor B: F (1, 24) 5.64, p .05.
Interaction: F (2, 24) 16.92, p .01.
d. There is no significant effect of time of day on
attentiveness. There is a significant effect of
teaching method on attentiveness such that
those in the lecture-only groups were more
attentive. There is a significant interaction
effect such that as the time of day increased,
attentiveness decreased for the lecture-only
conditions; whereas as time of day increased,
attentiveness increased for the lecture with
small-group activities conditions.
e. The effect size (
2
) is 2% for time of day
(time of day accounts for less than 2% of
the variability in attentiveness scores), 9%
for teaching method (teaching method
accounts for 9% of the variability in atten-
tiveness scores), and 52% for the interaction
(the interaction of time of day and teaching
method accounts for 52% of the variability in
attentiveness scores).
f.
Lecture
Only
Lecture/
Small-
Group
0
2
4
6
8
10
EveningMorning Afternoon
Attentiveness Score
Time of Day
Chapter 12
1. A true experimental design uses a manipulated
independent variable. A quasi-experimental
design may have no independent variable (only
one group was used and given the treatment)
or a nonmanipulated independent variable
(although two groups were used, they came
to the study already differing, or they chose to
participate or not participate in some treatment).
Thus, although we can infer a causal relationship
based on data from a true experimental design,
we cannot do so based on data collected from a
quasi-experimental design.
3. The researcher should use a single-group
posttest-only design, in which each quiz given
across the semester serves as a posttest measure.
10017_17_appndixC.indd 411 2/2/08 12:04:18 AM