Jackson Mark. Machining with Abrasives
Подождите немного. Документ загружается.


produce better correlation coefficients. This means that for perfectly sharp diamond
grains, one must apply the component grinding loads directly to the rake face.
It can be seen from Table 7.1 that induced tensile stresses account for the loss of
grain material from the diamond coated piezoelectric ceramic material. Therefore,
the maximum tensile stress is the best indicator of diamond performance, in terms
of grinding ratio, during a nanogrinding operation. The analysis performed on
perfectly sharp diamond grains has provided a strong correlation between maxi-
mum tensile stress induced in the grain material and the wear parameter, grinding
ratio, for the experimental data used in this chapter.
Correlations with other data sets have not proved so fruitful. From this, we can
safely assume that the mechanism of grain fracture is not the dominant mechanism,
which implies that other mechanisms are operating. The correlation coefficient
demonstrates that a tougher grain material must be used in order to limit the effects
of abrasive wear and the formation of wear flats, or a stronger bond, and possibly a
higher volume of bond between diamond and piezoelectric crystal, is required to
nanogrind under the current experimental conditions. Therefore, the present
method of calcul ating the correlation coefficient between the maximum tensile
stress and the grinding ratio demonstrates its potential application to the wider
problem of selecting abrasive grains based on specific metal removal rates and the
nature of the nanogrinding operation.
When porous tools are used to embed diamonds or any other abrasive material,
the same analysis can be used but account of the properties of the bonding bridge
must be made. The bonding bridge can be made of a variety of different materials
but the most common one used for dressable applications is the vitrified type, which
is mad e from a mixture of clays, glasses, and minerals. The emphasis on using
Table 7.1 Correlation coefficient between maximum tensile stress and grinding ratio for an
idealized wedge using experimental data. Comparison is also made between the methods of
applying loads to the idealized wedge models
Workpiece
material
Exact wedge model
with point loads
applied to apex of
wedge
Approximate finite
element model:
equivalent grinding
forces applied to rake
face of wedge
Approximate finite
element model: grinding
forces applied directly to
the rake face of the
wedge
Diamond on
steel
0.8 0.9 0.94
Diamond on
MgO
0.6 0.7 0.8
Diamond on
copper alloy
0.55 0.65 0.78
Diamond on
aluminum
alloy
0.7 0.85 0.95
Diamond on
silicon
0.85 0.87 0.9
7 Nanogrinding 325
dressable types for nanogrinding is based on their ability to be re-sharpened by
dislodging worn grains and by microstructural phase transformations by focusing
optical energy on the bonding bridges that hold the grains in place.
7.5.5 Porous Nanogrinding Tools
Porous nanogrinding tools are composed of abrasive particles (sub micron size)
embedded in a vitrified bond with porosity interspersed between grinding grains
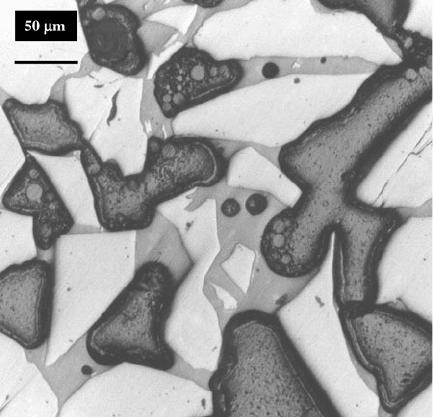
and bonding bridges. The porosity level is approximately 15–21%. Figure 7.18 shows
the image of a nanogrinding tool. The vitrified bonds are specially engineered to
promote the formation of texture that creates ridges of cutting planes and nanogrind-
ing “peaks” of a-Al
2
O
3
in the preferred (012), (104), and (110) planes. The peaks
created due to laser modification of the surface aid the nanogrinding process. Vitrified
bonds are composed of glasses that are formed when clays, ground glass frits, mineral
fluxes such as feldspars, and chemical fluxes such as borax melt when the grinding
wheel is fired at temperatures in the range, 1,000–1,200
C. With reference to raw
material nomenclature, a “frit” is a pre-ground glass with a pre-determined oxide
content, a “flux” is a low melting point siliceous clay that reduces surface tension at
the bond bridge-abrasive grain interface, a “pre-fritted” bond is a bond that contains
no clay minerals (i.e., clays and fluxes), and “firing” refers to vitrification heat
treatment that consolidates the individual bond constituents together [7]. Considering
Fig. 7.18 Structure of the porous tool used for nanogrinding. Used with permission copyright
Springer (2007)
326 M.J. Jackson and J. P. Davim
individual bond constituents, mineral fluxes and ground glass frits have little direct
effect on the ability to manufacture grinding wheels. However, most clays develop
some plasticity in the presence of water (from the binder), which improves the ability
to mould the mixture so that the wheel, in its green state, can be mechanically
handled.
Clays and clay-based fluxes contain an amount of free quartz that has a detri-
mental effect on the development of strength during vitrification heat treatment.
Clays are used to provide vitrified grinding wheels with green strength during the
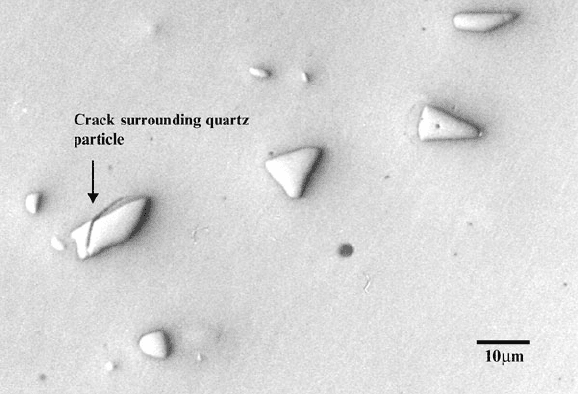
heat treatment process. Howeve r, when the glass material solidifies aroun d the
particles of clay and quartz, the displacive transformation of quartz during the
cooling stage of vitrification leads to the formation of cracks in the glass around the
quartz particle (Fig. 7.19). The strength of the bonding bridge is impaired and leads
to the early release of the abrasive particle during the cutting of metal.
The basic wear mechanisms that affect vitrified grinding wheels are concerned
with grain fracture during metal cutting, fracture of bond bridges, mechanical
fracture of abrasive grains due to spalling, and fracture at the interface between
abrasive grain and bond bridge. Failure in vitrified silicon carbide grinding wheels is
more probable due to the lack of a well-developed bonding layer between abrasive
grain and glass bond-bridge. The bonding layer is approximately a few micrometers
in thickness, and is caused by the use of a high clay content bonding system. High
glass content bonding systems tend to aggressively decompose the surface of silicon
carbide abrasive grains. In vitrified corundum grinding wheels, high glass cont ent
Fig. 7.19 A collection of quartz particles in a vitrified bonding system. The quartz particle on the
left has a circumferential crack extending into the dissolution rim. Used with permission copyright
Springer (2007)
7 Nanogrinding 327
bonding systems are used extensively and lead to bonding layers in excess of 100 mm
in thickness. In addition to the formation of very thin bonding layers in vitrified
silicon carbide grinding wheels, the use of high clay content bonding systems
implies that there is an increase in the amount of quartz in the bond bridges between
abrasive grains. Although the likelihood of decomposition of silicon carbide sur-
faces is reduced, the probability of bond bridge failure is increased due to the
increased quartz content. Therefore, the dissolution of quartz is of paramount
importance in order to compensate for thinner interfacial bonding layers.
The dissolution of quartz in a liquid phase does not require a nucleation step.
One proce ss that determines the rate of the overall reaction is the phase-boundary
reaction rate that is fixed by the movement of ions across the interface. However,
reaction at the phase boundary leads to an increased concentration at the interface.
Ions must diffuse awa y from the reaction interface so that the reaction can continue.
The rate of material transfer and the diffusion rate are controlled by molecular
diffusion in the presence of a high-viscosity liquid phase. For a stationary solid in
an unstirred liquid, or in a liquid with no fluid flow produced by hydrodynamic
instabilities, the rate of dissolution is governed by molecular diffusion. The effec-
tive diffusion length over which mass is transported is proportional to
ffiffiffiffiffi
Dt
p
, where
D is the diffusion coefficient and t is time, and therefore the change in thickness of
the solid, which is proportional to the mass dissolved, varies with
ffiffi
t
p
. Natural, or
free, convection occurs because of hydrodynamic instabilities in the liquid which
gives rise to fluid flow over the solid. This enhances the kinetics of dissolution.
Generally, a partially submerged solid undergoes more dissolution near to the solid-
liquid interface. Below this interface the kinetics of dissolution of the solid can be
analyzed using the principle s of free convection.
The boundary layer thickness is determined by the hydrodynamic conditions of
fluid flow. Viscous liquids form much thicker boundary layers that tend to impede
material transfer. Higher liquid velocities promote the formation of thinner bound-
ary layers and permit more rapid material transfer. Considering the dissolution of
quartz in glass materials, the high viscosity and slow fluid flows combine to give
thick boundary layers. Also, the diffusion rate is much slower in viscous silicate
liquids than in aqueous solutions, thus giving a tendency for the reaction process to
be controlled by material-transfer phenomena rather than by interface reactions.
Difficulties encountered when developing a dissolution model arise from the fact
that the phase boundary between quartz particle and molten glass moves during the
diffusion process. The probl em of a fixed boundary can be solved without difficulty
although this is not equivalent to the conditions associated with a moving boundary
between quartz particle and a highly viscous glass melt. The development of
dissolution models is required to determine the magnitude of quartz remaining in
the bonding system after a period of heat treatment. The models are then compared
with experimentally determined quartz content of the bonding systems using X-ray
diffraction techniques.
328 M.J. Jackson and J. P. Davim
7.5.5.1 Dissolution Models for Quartz in Bonding Bridges
When densification occurs in a vitrified grinding wheel, the cooling rate is reduced
to prevent thermal stress cracking in the bonding layer between abrasive particles.
Cooling rates are reduced when crystalline inversions occur that involve volume
changes. The inversion range for quartz and crist obalite are 550–580
C and
200–300
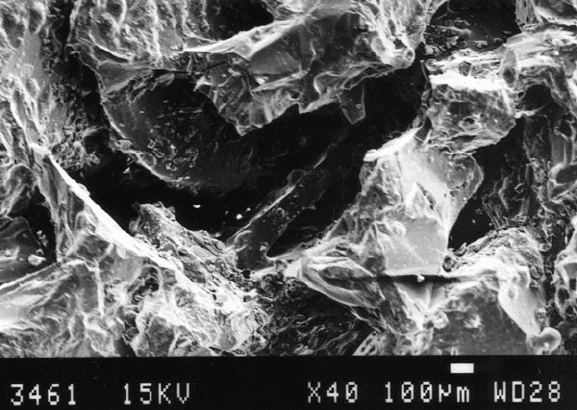
C, respectively. Since the formation of cristobalite is rare in most vitrified
bonding systems used for grinding wheels, the rapid displacive transformation of
quartz tends to promote the formation of cracks in bonding bridges (Fig. 7.20).
Once the grinding grain is lost the remaining bonding bridges can be modified using
a high power laser to create an oriented texture that forms “peaks” of a-Al
2
O
3
in the
preferred (012), (104), and (110) planes.
When quartz-containing bonds begin to cool form the soaking, or vitrification,
temperature it is thought that the liquid phase relieves stresses resulting from
thermal expansion mismatch between itself and the phases, b-quartz, b-cristobalite,
and mullite, to at least 800
C. At 800
C, stresses will develop in quartz particles
and the matrix that causes micro-cracking to occur. The shrinkage behaviour of
quartz and the glass phase has been described by Storch et al. [8]. Between the
temperature range, 573 and 800
C, the glass phase shrinks more than the quartz
phase that causes tangential tensile stresses to form cracks in the matrix. At 573
C,
Fig. 7.20 Bonding bridge failure in a vitrified grinding wheel caused by the displacive transfor-
mation of quartz at high temperature during heat treatment. Used with permission copyright
Springer (2007)
7 Nanogrinding 329

b-quartz transforms to a-quartz that causes residual stresses to produce circumfer-
ential cracking around quartz particles (Fig. 7.19). Some of these cracks have been
seen to propagate into the glass phase [9]. Similar observations occur in the
cristobalite phase. Spontaneous cracking of quartz has been found to occur over a
temperature range that depends on the size of the quartz particles [10]. Particles
larger than 600 mm’ diameter cracked spontaneously at 640
C, whereas smaller
particles of less than 40 mm diameter cracked at 573
C. This observation agrees
with temperature-dependent micro-cracking reporte d by Kirchhoff et al. [11].
To maintain the integrity of the bond bridges containing coarse quartz particles,
the grinding wheel must remain at the vitrification temperature until the quartz
particles have dissolved. The dissolution model assumes that at a constant absolute
temperature, T, a particle of quartz melts in the surrounding viscous glass melt, and
that the rate of change of the volume of quartz present in the melt at a particular
instant in time is proportional to the residua l volume of quartz. The above assump-
tion is based on the fact that alkali ions diffuse from the viscous glass melt to the
boundary of the quartz particle, thus producing a dissolution rim around each quartz
particle. A high reaction rate will initially occur which continuously decreases as
the quartz particle is converted to a viscous melt.
Jackson and Mills [12] derived a mathematical relationship that accounts for the
change in density when b-quartz transforms to a-quartz on cooling from the
vitrification temperature, thus,
m
T;t
¼ Mg exp At
1=2
exp
B
T
(7.37)
where, m
T,t
, is the residual mass fraction of quartz at a constant time and tempera-
ture couple, M is the original mass fraction of quartz prior to heat treatment, g is the
ratio of densities of b-quartz and a-quartz, A and B are constants, t is time, and T is
absolute temperature. The model was compared with experimental data determined
using the powder X-ray diffraction method. The experimental work was divided
into two parts. The first part concentrates on comparing the dissolution model with
X-ray diffraction data using “sintering” bond compositions that are used in vitrified
silicon carbide nanogrinding tools, while the second part focuses on comparing the
model with “fusible” bond compositions that are used in high-performance vitrified
corundum nanogrinding tools.
7.5.5.2 Preparation of Nanog rinding Wheel Structure
The raw materials used in the experimental study were Hymod Prima ball clay,
standard porcelain China clay, potash feldspar, and synthetic quartz (supplied as
silica flour). The chemical analysis of the raw materials is shown in Table 7.2.
Rational analysis of the raw materials was performed to reveal the mineralogical
composition of the raw materials. The rational analysis appears in Table 7.3.
330 M.J. Jackson and J. P. Davim
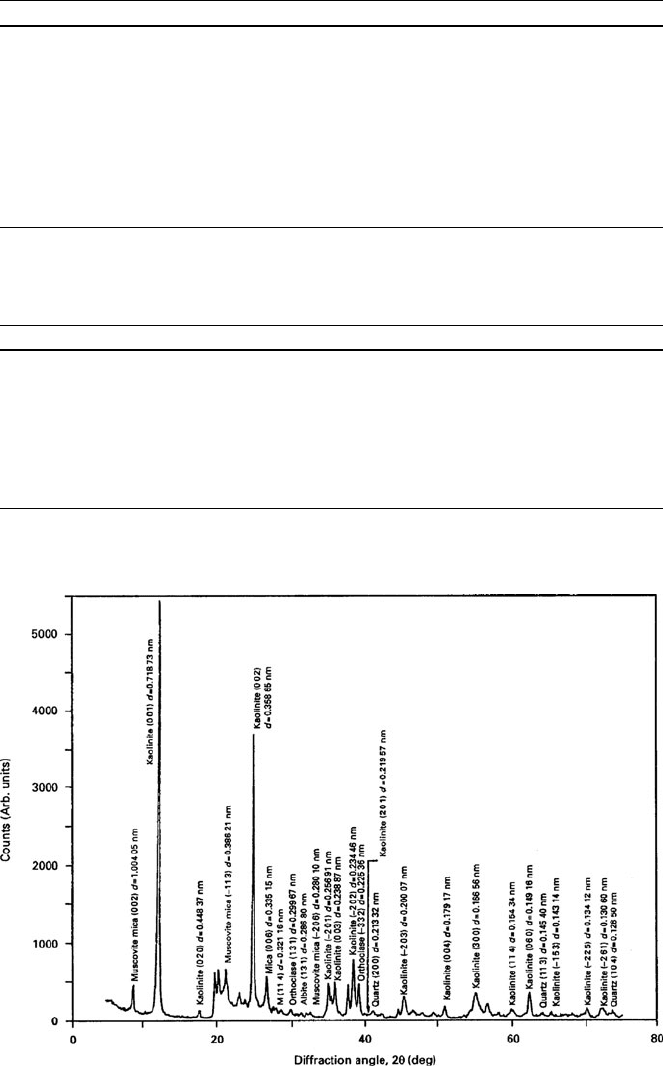
Table 7.3 Mineralogical analyses of raw materials
Compound (wt.%) China clay Ball clay Potash feldspar Quartz
Quartz 4.05 12.77 4.93 98.40
Orthoclase 0.00 15.23 64.96 0.00
Kaolinite 79.70 62.71 2.17 0.00
Mica 13.94 0.00 0.00 0.00
Soda feldspar 0.8 1.69 27.07 0.00
Miscellaneous
oxides/losses
1.51 7.60 0.87 1.60
Fig. 7.21 X-ray diffraction spectrum of China clay showing crystallographic planes and interplanar
distances of various mineral phases in the clay. Used with permission copyright Springer (2007)
Table 7.2 Chemical analyses of raw materials
Oxide (wt.%) China clay Ball clay Potash feldspar Quartz
Al
2
O
3
37 31 18.01 0.65
SiO
2
48 52 66.6 98.4
K
2
O 1.65 1.8 11.01 0.35
Na
2
O 0.1 0.2 3.2 0.04
CaO 0.07 0.2 0.09 0.00
MgO 0.03 0.3 0.09 0.00
TiO
2
0.02 0.9 0.00 0.07
Fe
2
O
3
0.68 1.1 0.11 0.03
Loss on ignition 12.5 16.5 0.89 0.20
7 Nanogrinding 331
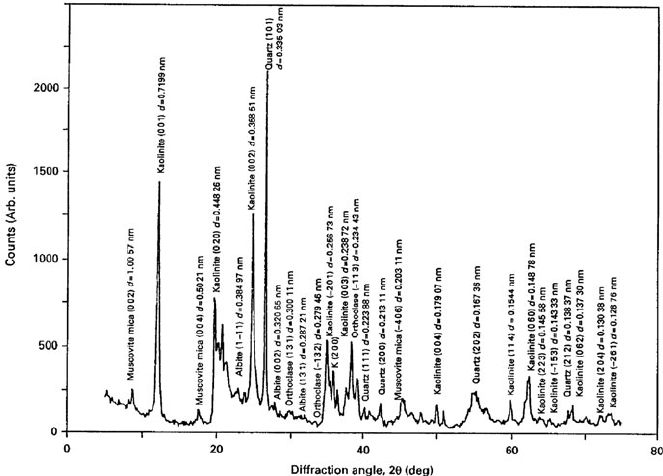
The characteristic X-ray diffraction spectra for ball clay and China clay are
shown in Figs. 7.21 and 7.22. The bond mixture described is one typically used in
vitrified silicon carbide grinding wheels where the erosion of the abrasive grain is
reduced by using high clay content bonding systems.
Fusible bonding systems using a mixture of ball clay and potassium-rich
feldspar were made to test the model developed by Jackson and Mills [12].
The ball clay used contained 12.77 wt.% quartz, and the feldspar contained
4.93 wt.% quartz. The bonding system was composed of 66 wt.% ball clay, and
34% feldspar.
The initial quartz content, M, of the bond mixture was 10.1 wt.%. The bond
mixture described is one typically used in high-performance vitrified corundum
grinding wheels.
The raw materials were mixed in a mortar, pressed in a mold, and fired at various
temperatures. A heating rate of 2.9
C min
1
was employed until the vitrification
temperature was reached.
The typical soaking temperature was varied between 1,200 and 1,400
C for
“sintering” bond compositions, and 950 and 1,050
C for “fusible” bond composi-
tions in order to simulate industrial firing conditions. The samples were cooled at a
rate of 1.8
C min
1
to avoid thermal stress fracture. The fired samples were crushed
to form a fine powder in preparation for X-ray diffraction.
Fig. 7.22 X-ray diffraction spectrum of ball clay showing crystallographic planes and interplanar
distances of various mineral phases in the clay. Used with permission copyright Springer (2007)
332 M.J. Jackson and J. P. Davim
7.5.5.3 X-Ray Diffraction of Bonding Systems
The dissolution model was compared with experimental data using the X-ray
powder diffraction method. X-ray diffraction of the raw materials was performed
on a Phillips 1710 X-ray generator with a 40 kV tube voltage and a 30 mA current.
Monochromatic Cu ka radiation, l ¼0.154060 nm, was employed. A scanning
speed of 2
/min for diffraction angles of 2y was used between 2y angles of 10
and
80
, and the X-ray intensity was recorded using a computer. The spectrum was then
analyzed and compared with known spectra. Powder specimens were prepared by
crushing in a mortar and pestle in preparation for quantitative X-ray diffraction.
To eliminate the requirement of knowing mass absorption coefficients of ceramic
samples for quantitative X-ray diffraction, Alexander and Klug [13] introduced the
use of an internal standard. First, the ceramic sample is crushed to form a powder –
the sizes of particles should be small enough to make extinction and micro-
absorption effects negligible. Second, the internal standard to be added should
have a mass absorption coefficient at a radiation wavelength such that intensity
peaks from the phase(s) being measured are not diminished or amplified. It should
be noted that the powder diffraction mixture should be homogeneous on a scale of
size smaller than the amount of material exposed to the X-ray beam, and should be
free from preferred orientation. The powder bed that is subjected to “X-rays”
should be deep enough to give maximum diffracted intensity. The expected equi-
librium phases from the fired mixtures are quartz (unreacted and partially dis-
solved), mullite, cristobalite and glass. However, from the samples tested, the
compounds quartz, mullite and glass were successfully detected. A calibration
curve was constructed using a suitable internal standard (calcium fluoride), a
diluent (glass made by melting potash feldspar), and a synthetic form of the
phase(s) to be measured. Synthetic mullite had a purity greater than 99.8%, whilst
powdered quartz had a purity g reater than 99.84% SiO
2
. The method used for
quantitative analysis of ceramic powders was developed by Khandelwal and Cook
[14]. The internal standard gave a fairly intense (111) reflection (d ¼0.1354 nm)
lying between the (100) reflection for quartz (d ¼0.4257 nm) and the (200)
reflection for mullite (d ¼0.3773 nm). Using copper ka radiation (l ¼0.15405 nm),
the corresponding values of diffraction angle 2y are: (100) quartz ¼20.82
; (111)
calcium fluoride ¼28.3
; and (200) mullite ¼32.26
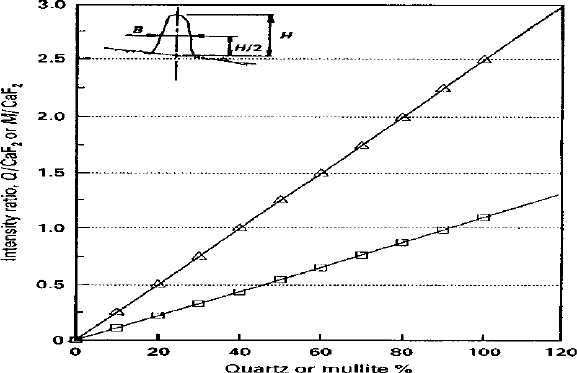
. Figure 7.23 shows the cali-
bration curve generated by varying proportions of calcium fluoride, synthetic quartz
and mullite. Mass fractions of the crystalline phases in the mixture can be read from
the calibration lines by measuring the intensit y ratio of the phase(s) to the internal
standard.
Figure 7.24 shows the diffraction peaks of interest for quantitative analysis lying
between 15
and 40
of the diffraction angle 2y. The figure shows the reflections of
the (111) plane of calcium fluoride, (200) plane of mullite, and the (100) plane of
quartz. In order to calculate the mass fractions of quartz and mullite in the mixture,
the height of the chosen diffraction peak and its width at half-height were measured
from the diffraction spectrum. The product of these two measures were then
compared with that of the internal standard, and the resultant intensity ratio was
7 Nanogrinding 333
used to find the exact mass fraction of the phase(s) measured in the glass that has
been X-rayed.
7.5.5.4 Refractory Bonding Systems
In addition to comparing the experimental results to the dissolution model, results
published in the literature were also used to test the accuracy of the model. The
composition of the experimental mixtures was matched to those specified by
Lundin [7]. Lundin’s experimental mixtu res were composed of 25 wt.% quartz
(13.2 mm particle size), 50 wt.% clay (kaolin), and 25 wt.% flux (potassium
feldspar – 25 mm particle size).
The constants A and B for the sintering bonding system were calculated,
A ¼ 5:62 10
8
(7.38)
B ¼ 33; 374 (7.39)
From which the experimental activation energy, Q, is 132.65 kcal/mole. The
residual quartz content for the sintering bonding system is,
m
T;t
¼ 26 :25 exp 5:62 10
8
t
1=2
e
33;374=T
hi
(7.40)
Fig. 7.23 Calibration curve for quantitative analysis of X-ray determined quartz and mullite using
the CaF
2
(111) plane generated by the internal standard. Used with permission copyright Springer
(2007)
334 M.J. Jackson and J. P. Davim