Investment Banking, valuation and M&A
Подождите немного. Документ загружается.

P1: ABC/ABC P2:c/d QC:e/f T1:g
c03 JWBT063-Rosenbaum March 25, 2009 9:25 Printer Name: Hamilton
Discounted Cash Flow Analysis
145
For A/R, inventory, and A/P, respectively, these ratios are DSO of 60.2, DIH
of 76.0, and DPO of 45.6. For prepaid expenses and other current assets, accrued
liabilities, and other current liabilities, the percentage of sales levels are 1%, 10%, and
2.5%, respectively. For ValueCo’s Base Case financial projections, we conservatively
did not assume any improvements in working capital efficiency during the projection
period.
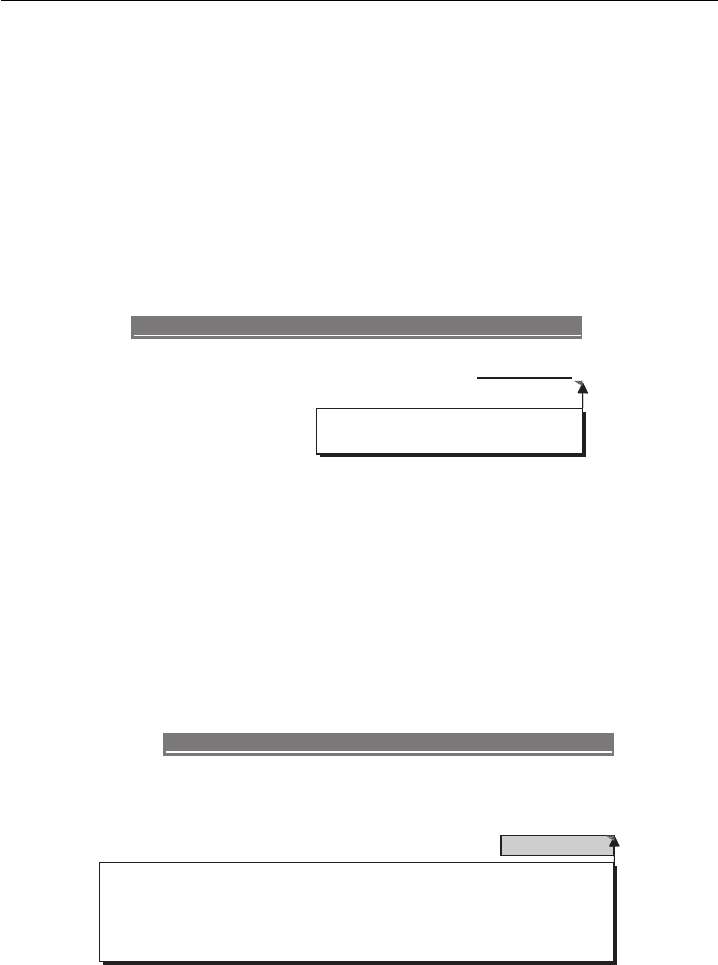
As depicted in the callouts in Exhibit 3.40, using ValueCo’s 2007 ratios, we
projected 2008E NWC to be $100 million. To determine the 2009E YoY change in
NWC, we then subtracted this value from ValueCo’s 2009E NWC of $108 million.
The $8 million difference is a use of cash and is, therefore, subtracted from EBIAT,
resulting in a reduction of ValueCo’s 2009E FCF. Hence, it is shown in Exhibit 3.41
as a negative value.
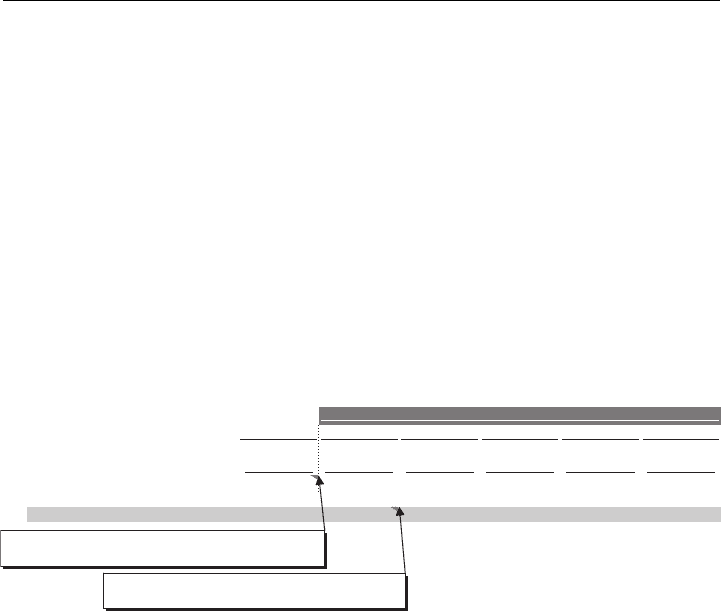
EXHIBIT 3.41
ValueCo’s Projected Changes in Net Working Capital
($ in millions)
2008
2009 2010
2011
2012 2013
$378.9$367.9$357.2$343.4$324.0$300.0Total Current Assets
Less: Total Current Liabilities
200.0
216.0
229.0 238.1 252.6 245.3
$126.3$122.6$119.1$114.5$108.0$100.0 Net Working Capital
(Increase) / Decrease in NWC ($3.7)($3.6)($4.6)($6.5)($8.0)
Projection Period
= Total Current Assets
2008E
- Total Current Liabilities
2008E
= $300.0 million - $200.0 million
= Net Working Capital
2008E
- Net Working Capital
2009E
= $100.0 million - $108.0 million
The methodology for determining ValueCo’s 2009E NWC was then applied in
each year of the projection period. Each annual change in NWC was added to the
corresponding annual EBIAT (with increases in NWC expressed as negative values)
to calculate annual FCF.
A potential shortcut to the detailed approach outlined in Exhibits 3.40 and 3.41
is to bypass projecting individual working capital components and simply project
NWC as a percentage of sales in line with historical levels. For example, we could
have used ValueCo’s 2007 NWC percentage of sales ratio of 10% to project its
NWC for each year of the projection period. We would then have simply calculated
YoY changes in ValueCo’s NWC and made the corresponding subtractions from
EBIAT.
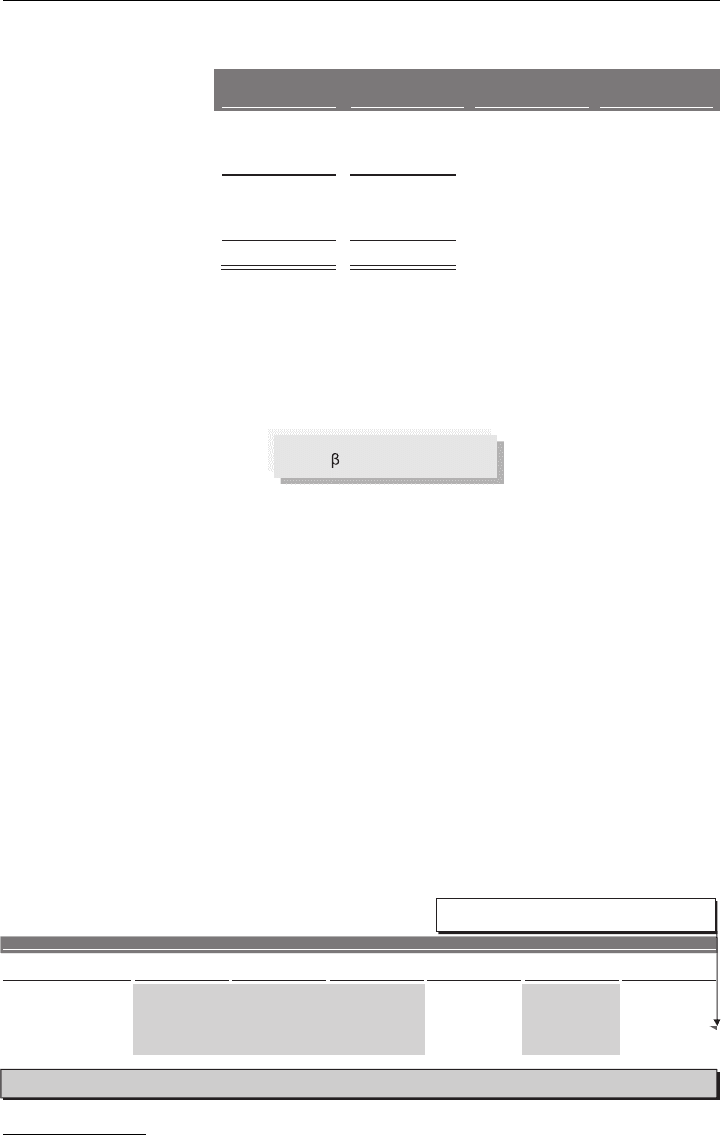
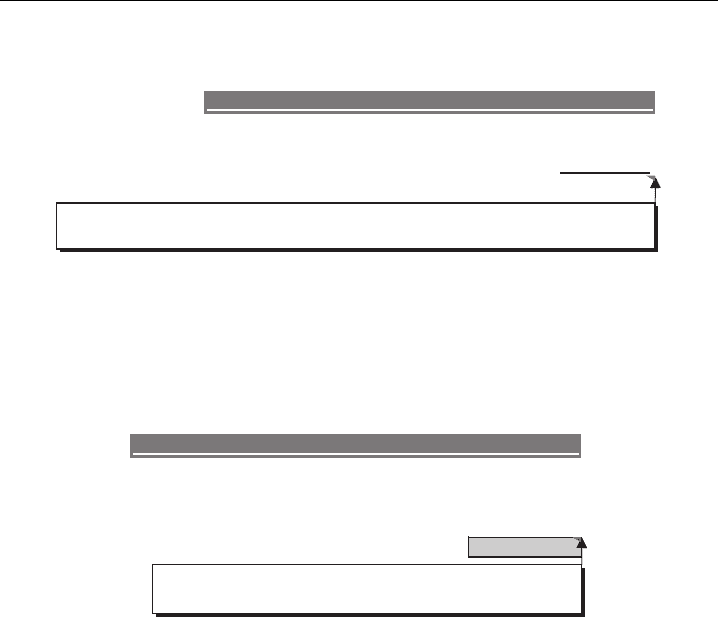
Free Cash Flow Projections Having determined all of the above line items, we
calculated ValueCo’s annual projected FCF, which increases from $79 million in
2009E to $98.1 million in 2013E (see Exhibit 3.42).

P1: ABC/ABC P2:c/d QC:e/f T1:g
c03 JWBT063-Rosenbaum March 25, 2009 9:25 Printer Name: Hamilton
146 VALUATION
EXHIBIT 3.42 ValueCo Projected FCF
($ in millions) Historical Period CAGR CAGR
2005
2006 2007 ('05 - '07) 2008 2009
2010 2011
2012
2013 ('08 - '13)
Sales $925.0$850.0$780.0 8.9% $1,000.0 $1,263.1$1,226.3$1,190.6$1,144.8$1,080.0 4.8%
3.0%3.0%4.0%6.0%8.0%8.1%8.8%9.0%NA % growth
COGS 600.0555.0512.1471.9 757.9735.8714.4686.9648.0
% sales
60.5% 60.3% 60.0% 60.0% 60.0% 60.0% 60.0% 60.0% 60.0%
$370.0$337.9$308.1Gross Profit 9.6% $505.2$490.5$476.2$457.9$432.0$400.0 4.8%
40.0%40.0%40.0%40.0%40.0%40.0%40.0%39.8%39.5% % margin
SG&A 250.0231.3214.6198.9 315.8306.6297.6286.2270.0
% sales
25.5% 25.3% 25.0% 25.0% 25.0% 25.0% 25.0% 25.0% 25.0%
EBITDA $138.8$123.3$109.2 12.7% $189.5$183.9$178.6$171.7$162.0$150.0 4.8%
15.0%15.0%15.0%15.0%15.0%15.0%15.0%14.5%14.0% % margin
D&A 20.018.517.015.6 25.324.523.822.921.6
% of sales
2.0%
2.0% 2.0% 2.0% 2.0% 2.0% 2.0% 2.0% 2.0%
$120.3$106.3$93.6EBIT 13.3% $164.2$159.4$154.8$148.8$140.4$130.0 4.8%
13.0%13.0%13.0%13.0%13.0%13.0%13.0%12.5%12.0% % margin
Taxes
53.4 56.6 58.8 62.4 60.6
EBIAT $101.8$98.8$96.0$92.3$87.0 4.8%
Plus: D&A 21.6 22.9 23.8 24.5 25.3
Less: Capex (21.6) (22.9) (23.8) (24.5) (25.3)
Less: Inc. in NWC
(8.0) (6.5) (4.6) (3.7) (3.6)
Unlevered Free Cash Flow $79.0 $91.4 $85.8 $95.3 $98.1
Projection Period
Step III. Calculate Weighted Average Cost of Capital
Below, we demonstrate the step-by-step calculation of ValueCo’s WACC, which we
determined to be 11%.
Step III(a): Determine Target Capital Structure Our first step was to determine
ValueCo’s target capital structure. For private companies, the target capital structure
is generally extrapolated from peers. As ValueCo’s peers have an average (mean) D/E
of 42.9%—or debt-to-total capitalization (D/(D+E)) of 30%—we used this as our
target capital structure (see Exhibit 3.45).
Step III(b): Estimate Cost of Debt We estimated ValueCo’s long-term cost of debt
based on the current yield on its existing term loan, the only outstanding debt
instrument in its capital structure (see Exhibit 3.43).
33
The term loan, which for
illustrative purposes we assumed is trading at par, is priced at a spread of 300 basis
points (bps)
34
to LIBOR
35
(L+300 bps). Based on LIBOR of 300 bps, we estimated
ValueCo’s cost of debt at 6% (or approximately 3.7% on an after-tax basis).
33
Alternatively, ValueCo’s cost of debt could be extrapolated from that of its peers. We took
comfort with using the current yield on ValueCo’s existing term loan because its current
capital structure is in line with its peers.
34
A basis point is a unit of measure equal to 1/100th of 1% (100 bps = 1%).
35
The London Interbank Offered Rate (LIBOR) is the rate of interest at which banks can
borrow funds from other banks, in marketable size, in the London interbank market.
P1: ABC/ABC P2:c/d QC:e/f T1:g
c03 JWBT063-Rosenbaum March 25, 2009 9:25 Printer Name: Hamilton
Discounted Cash Flow Analysis
147
EXHIBIT 3.43 ValueCo Capitalization
($ in millions) % of Total
Amount
Capitalization Maturity Coupon
$25.0Cash and Cash Equivalents
-Revolving Credit Facility
- %
L+275 bps2010
300.0Term Loan
30.0%
L+300 bps2011
30.0%$300.0Total Debt
700.0Shareholders' Equity
70.0%
Total Capitalization
100.0%
$1,000.0
$275.0Net Debt
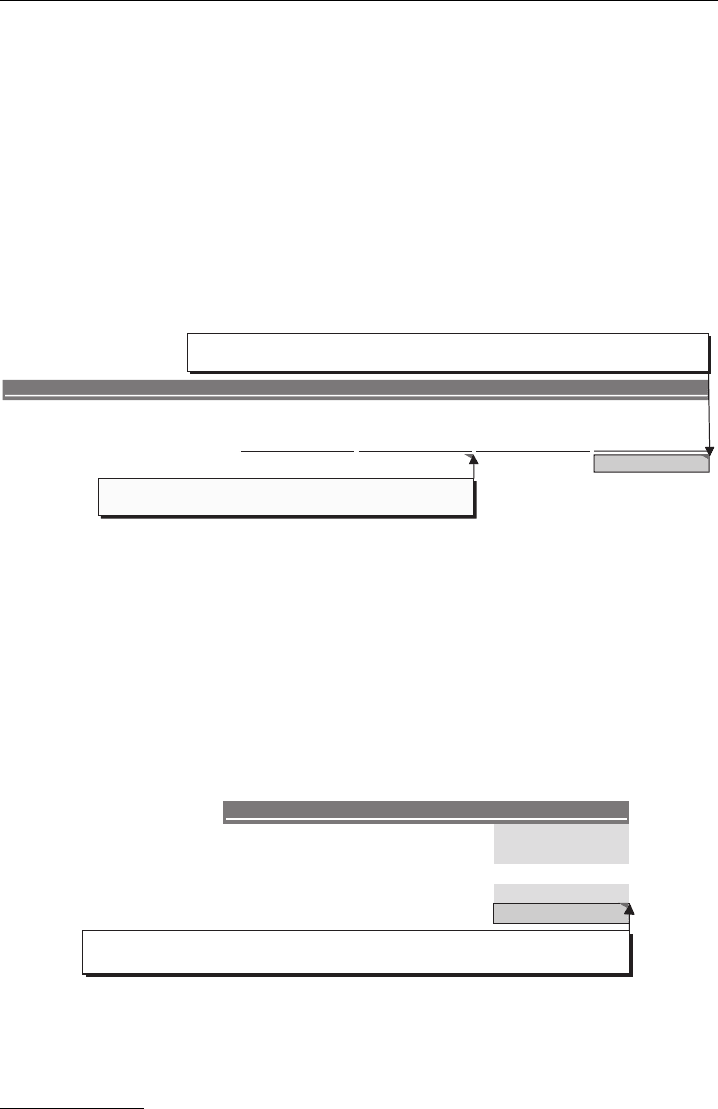
Step III(c): Estimate Cost of Equity We calculated ValueCo’s cost of equity in
accordance with the CAPM formula shown in Exhibit 3.44.
EXHIBIT 3.44
CAPM Formula
r
f
+
L
x (r
m
– r
f
) + SP
r
e
=
Determine Risk-free Rate and Market Risk Premium We assumed a risk-free rate
(r
f
) of 4%, based on the interpolated yield of the 20-year Treasury bond. For the
market risk premium (r
m
− r
r
), we used the arithmetic mean of 7.1% in accordance
with Ibbotson (for the 1926–2007 period).
Determine the Average Unlevered Beta of ValueCo’s Comparable Companies As
ValueCo is a private company, we extrapolated beta from its closest comparables
(see Chapter 1). We began by sourcing predicted levered betas for each of Val-
ueCo’s closest comparables.
36
We then entered the market values for each compa-
rable company’s debt
37
and equity, and calculated the D/E ratios accordingly. This
information, in conjunction with the marginal tax rate assumptions, enabled us to
unlever the individual betas and calculate an average unlevered beta for the peer
group (see Exhibit 3.45).
EXHIBIT 3.45
Average Unlevered Beta
Predicted Market Market Debt/ Marginal Unlevered
Company
Levered Beta
Value of Debt Value of Equity Equity Tax Rate
Beta
Adler Industries 1.11 $575.0 $2,600.0 22.1% 38.0% 0.98
Lanzarone International 1.08 515.0 1,750.0 29.4% 38.0% 0.91
Lajoux Global 1.35 715.0 1,050.0 68.1% 38.0% 0.95
Momper Corp. 1.25 550.0 1,000.0 55.0% 38.0% 0.93
McMenamin & Co. 1.19 250.0 630.0 39.7% 38.0% 0.96
0.9542.9%1.20Mean
0.9539.7%1.19Median
Comparable Companies Unlevered Beta
= 1.25 / (1 + (55.0%) x (1 - 38.0%))
= Predicted Levered Beta / (1 + (Debt/Equity) x (1 - t))
36
An alternate approach is to use historical betas (e.g., from Bloomberg), or both historical
and predicted betas, and then show a range of outputs.
37
For simplicity, we assumed that the market value of debt was equal to the book value.
P1: ABC/ABC P2:c/d QC:e/f T1:g
c03 JWBT063-Rosenbaum March 25, 2009 9:25 Printer Name: Hamilton
148 VALUATION
For example, based on Momper Corp.’s predicted levered beta of 1.25, D/E of
55%, and a marginal tax rate of 38%, we calculated an unlevered beta of 0.93. We
performed this calculation for each of the selected comparable companies and then
calculated an average unlevered beta of 0.95 for the group.
Relever Average Unlevered Beta at ValueCo’s Capital Structure We then relevered
the average unlevered beta of 0.95 at ValueCo’s previously determined target capital
structure of 42.9% D/E, using its marginal tax rate of 38%. This provided a levered
beta of 1.20 (see Exhibit 3.46).
EXHIBIT 3.46
ValueCo Relevered Beta
TargetTargetMean
ReleveredMarginalDebt/Unlevered
Beta
Equity Tax Rate
Beta
Relevered Beta 38.0%42.9%0.95 1.20
ValueCo Relevered Beta
= Mean Unlevered Beta x (1 + (Target Debt/Equity) x (1 - Target Marginal Tax Rate)
= 0.95 x (1 + (42.9%) x (1 - 38.0%))
= Debt-to-Total Capitalization / Equity-to-Total Capitalization
= 30.0% / 70.0%
Calculate Cost of Equity Using the CAPM, we calculated a cost of equity for
ValueCo of 14.1% (see Exhibit 3.47), which is higher than the expected return on
the market (calculated as 11.1% based on a risk-free rate of 4% and a market risk
premium of 7.1%). This relatively high cost of equity was driven by the relevered
beta of 1.20, versus 1.0 for the market as a whole, as well as a size premium of
1.65%.
38
EXHIBIT 3.47 ValueCo Cost of Equity
Market Risk Premium 7.1%
1.20Levered Beta
Size Premium 1.65%
14.1%Cost of Equity
Cost of Equity
= Risk-free Rate + (Levered Beta x Market Risk Premium) + Size Premium
= 4.0% + (1.20 x 7.1%) + 1.65%
Risk-free Rate 4.0%
38
Ibbotson estimates a size premium of 1.65% for companies in the Low-Cap Decile for
market capitalization.
P1: ABC/ABC P2:c/d QC:e/f T1:g
c03 JWBT063-Rosenbaum March 25, 2009 9:25 Printer Name: Hamilton
Discounted Cash Flow Analysis
149
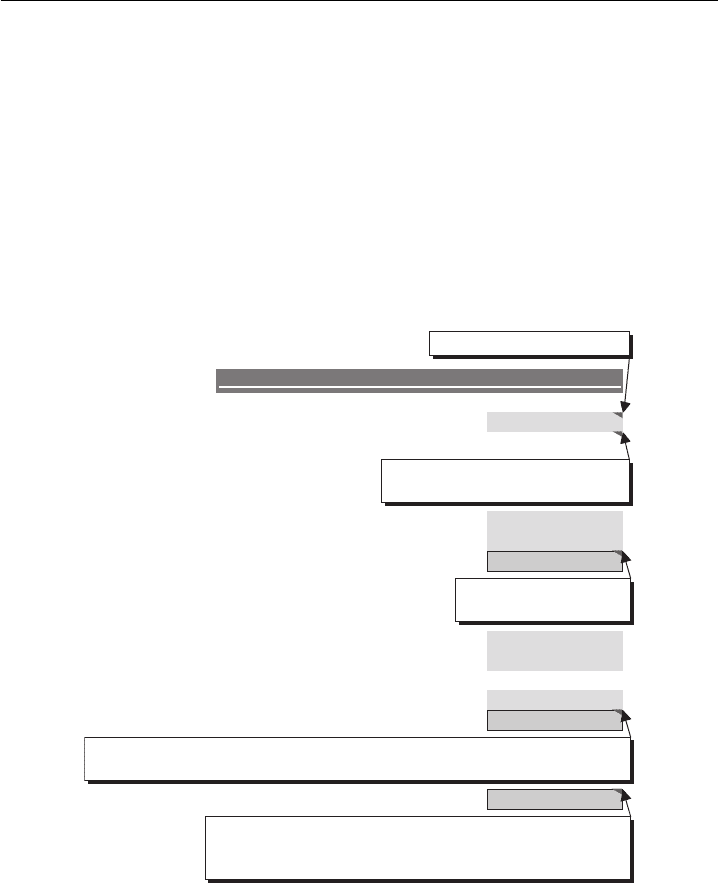
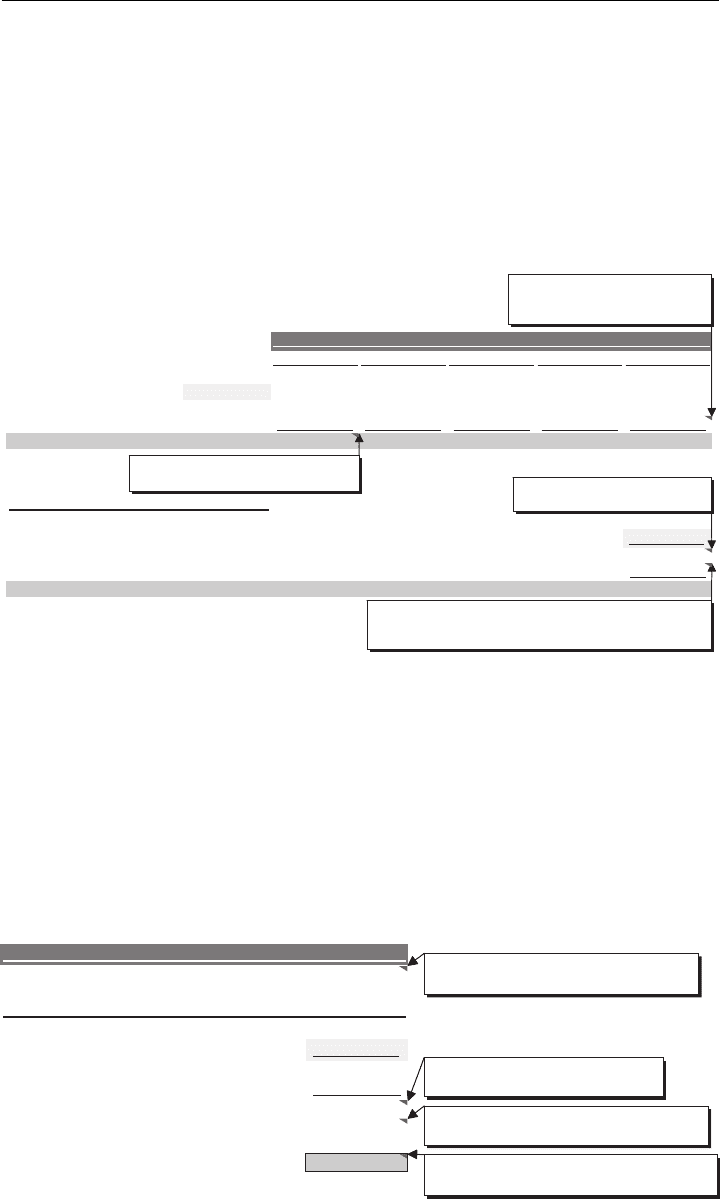
Step III(d): Calculate WACC We now have determined all of the components nec-
essary to calculate ValueCo’s WACC. These inputs were entered into the formula
in Exhibit 3.12, resulting in a WACC of 11%. Exhibit 3.48 displays each of the
assumptions and calculations for determining ValueCo’s WACC.
As previously discussed, the DCF is highly sensitive to WACC, which itself
is dependent on numerous assumptions governing target capital structure, cost of
debt, and cost of equity. Therefore, a sensitivity analysis is typically performed on
key WACC inputs to produce a WACC range. In Exhibit 3.49, we sensitized target
capital structure and pre-tax cost of debt to produce a WACC range of approximately
10.5% to 11.5% for ValueCo.
EXHIBIT 3.48
ValueCo WACC Calculation
Target Capital Structure
Debt-to-Total Capitalization 30.0%
Equity-to-Total Capitalization
70.0%
Cost of Debt
Cost of Debt 6.0%
Tax Rate 38.0%
3.7%After-tax Cost of Debt
Cost of Equity
Market Risk Premium
7.1%
1.20Levered Beta
Size Premium 1.65%
14.1%EquityofCost
11.0%WACC
WACC Calculation
= 1 - Debt-to-Total Capitalization
= 1 - 30.0%
= Cost of Debt x (1 - t)
= 6.0% x (1 - 38.0%)
= Risk-free Rate + (Levered Beta x Market Risk Premium) + Size Premium
= 4.0% + (1.20 x 7.1%) + 1.65%
= (After-tax Cost of Debt x Debt-to-Total Capitalization) +
(Cost of Equity x Equity-to-Total Capitalization)
= (3.7% x 30.0%) + (14.1% x 70.0%)
Implied from D/E of 42.9%
Risk-free Rate
4.0%

P1: ABC/ABC P2:c/d QC:e/f T1:g
c03 JWBT063-Rosenbaum March 25, 2009 9:25 Printer Name: Hamilton
EXHIBIT 3.49
ValueCo Weighted Average Cost of Capital Analysis
ValueCo Corporation
Weighted Average Cost of Capital Analysis
($ in millions)
Target Capital Structure
Predicted Market Market
Debt/
Marginal Unlevered
Debt-to-Total Capitalization
30.0%
Company
Levered Beta
(4)
Value of Debt
Value of Equity
Equity
Tax Rate
Beta
Equity-to-Total Capitalization
70.0%
Adler Industries
1.11
$575.0 $2,600.0
22.1%
38.0%
0.98
Lanzarone International
1.08
515.0
1,750.0
29.4%
38.0%
0.91
Lajoux Global
1.35
715.0
1,050.0
68.1%
38.0%
0.95
Cost of Debt
Momper Corp.
1.25
550.0
1,000.0
55.0%
38.0%
0.93
Cost of Debt
6.0%
McMenamin & Co.
1.19
250.0
630.0
39.7%
38.0%
0.96
Tax Rate
38.0%
59.0
%9.24
02.1
naeM
%7.3
After-tax Cost of Debt
59.0
%7.93
91.1
naideM
Cost of Equity
Market Risk Premium
(2)
7.1%
Mean
Target
Target
Unlevered Debt/
Marginal Relevered
02.1
ateB dereveL
Beta
Equity
Tax Rate
Beta
Size Premium
(3)
1.65%
Relevered Beta
0.95
42.9%
38.0%
1.20
%1.41
ytiuqE fo tsoC
%0.11
CCAW
5.00%
5.50%
6.00%
6.50%
7.00%
10.0%
11.9%
11.9%
11.9%
11.9%
12.0%
20.0%
11.3%
11.4%
11.5%
11.5%
11.6%
30.0%
10.8%
10.9%
11.0%
11.1%
11.2%
40.0%
10.3%
10.4%
10.6%
10.7%
10.8%
50.0%
9.8%
10.0%
10.1%
10.3%
10.4%
Debt-to-Total
Capitalization
WACC Calculation
Comparable Companies Unlevered Beta
ValueCo Relevered Beta
Pre-tax Cost of Debt
WACC Sensitivity Analysis
(1) Interpolated yield on 20-year U.S. Treasury
(2) Obtained from lbbotson SBBI Valuation Yearbook
(3) Low-Cap Decile size premium based on market capitalization, per lbbotson
(4) Sourced from Barra
Risk-free Rate
(1)
4.0%
150
P1: ABC/ABC P2:c/d QC:e/f T1:g
c03 JWBT063-Rosenbaum March 25, 2009 9:25 Printer Name: Hamilton
Discounted Cash Flow Analysis
151
Step IV. Determine Terminal Value
Exit Multiple Method We used the LTM EV/EBITDA trading multiples for
ValueCo’s closest public comparable companies as the basis for calculating terminal
value in accordance with the EMM. These companies tend to trade in a range of
6.5x to 7.5x LTM EBITDA. Multiplying ValueCo’s terminal year EBITDA of $189.5
million by the 7.0x midpoint of this range provided a terminal value of $1,326.3
million (see Exhibit 3.50).
EXHIBIT 3.50
Exit Multiple Method
Calculation of Terminal Value using EMM
$189.5Terminal Year EBITDA (2013E)
7.0xExit Multiple
$1,326.3 Terminal Value
= EBITDA
Terminal Year
x Exit Multiple
= $189.5 million x 7.0x
($ in millions)
We then solved for the perpetuity growth rate implied by the exit multiple of
7.0x EBITDA. Given the terminal year FCF of $98.1 million and 11% midpoint of
the selected WACC range, and adjusting for the use of a mid-year convention for
the PGM terminal value, we calculated an implied perpetuity growth rate of 3%
(see Exhibit 3.51).
EXHIBIT 3.51
Implied Perpetuity Growth Rate
Implied Perpetuity Growth Rate
$98.1Terminal Year Free Cash Flow (2013E)
11.0%Discount Rate
1,326.3Terminal Value
3.0%Implied Perpetuity Growth Rate
= ((EMM Terminal Value x WACC) - FCF
Terminal Year
x (1 + WACC)
0.5
) /
(EMM Terminal Value + FCF
Terminal Year
)
= (($1,326.3 million) x 11.0%) - $98.1 million x (1 + 11.0%)
0.5
) /
($1,326.3 million + $98.1 million x (1 + 11.0%)
0.5
)
($ in millions)
Perpetuity Growth Method We selected a perpetuity growth rate range of 2% to
4% to calculate ValueCo’s terminal value using the PGM. Using a perpetuity growth
rate midpoint of 3%, WACC midpoint of 11%, and terminal year FCF of $98.1
million, we calculated a terminal value of $1,263.4 million for ValueCo (see Exhibit
3.52).
P1: ABC/ABC P2:c/d QC:e/f T1:g
c03 JWBT063-Rosenbaum March 25, 2009 9:25 Printer Name: Hamilton
152 VALUATION
EXHIBIT 3.52 Perpetuity Growth Rate
Calculation of Terminal Value using PGM
$98.1Terminal Year Free Cash Flow (2013E)
11.0%WACC
3.0%Perpetuity Growth Rate
$1,263.4 Terminal Value
= FCF
Terminal Year
x (1 + Perpetuity Growth Rate) / (WACC - Perpetuity Growth Rate)
= $98.1 million x (1 + 3.0%) / (11.0% - 3.0%)
($ in millions)
The terminal value of $1,263.4 million calculated using the PGM implied a 7.0x
exit multiple, adjusting for year-end discounting using the EMM (see Exhibit 3.53).
This is consistent with our assumptions using the EMM approach in Exhibit 3.50.
EXHIBIT 3.53
Implied Exit Multiple
Implied Exit Multiple
$1,263.4Terminal Value
189.5Terminal Year EBITDA (2013E)
11.0%WACC
7.0x Implied Exit Multiple
= PGM Terminal Value x (1 + WACC)
0.5
/ EBITDA
Terminal Year
= $1,263.4 million x (1 + 11.0%)
0.5
/ $189.5 million
($ in millions)
P1: ABC/ABC P2:c/d QC:e/f T1:g
c03 JWBT063-Rosenbaum March 25, 2009 9:25 Printer Name: Hamilton
Discounted Cash Flow Analysis
153
Step V. Calculate Present Value and Determine Valuation
Calculate Present Value
ValueCo’s projected annual FCF and terminal value were discounted to the present
using the selected WACC midpoint of 11% (see Exhibit 3.54). We used a mid-year
convention to discount projected FCF. For the terminal value calculated using the
EMM, however, we used year-end discounting.
EXHIBIT 3.54
Present Value Calculation
($ in millions)
2009
2010
2011
2012 2013
$98.1$95.3$91.4$85.8$79.0Unlevered Free Cash Flow
WACC 11.0%
Discount Period 0.5 1.5 2.5 3.5 4.5
Discount Factor
0.95
0.86
0.77
0.63 0.69
$61.4$66.1$70.4$73.4$75.0 Present Value of Free Cash Flow
Terminal Year EBITDA (2013E) $189.5
Exit Multiple 7.0x
Terminal Value $1,326.3
Discount Factor 0.59
Present Value of Terminal Value $787.1
Projection Period
Terminal Value
= 1 / ((1 + WACC)^(n - .05)
= 1 / ((1 + 11.0%)^(4.5))
Note: Mid-Year Convention applied
= 1 / ((1 + WACC)^n)
= 1 / ((1 + 11.0%)^5)
Note: Year-End Discounting applied for Exit Multiple Method
= Exit Year EBITDA x Exit Multiple
= $189.5 million x 7.0x
= Unlevered FCF
2009E
x Discount Factor
= $79.0 million x 0.95
Determine Valuation
Calculate Enterprise Value The results of the present value calculations for the
projected FCF and terminal value were summed to produce an enterprise value of
$1,133.3 million for ValueCo (see Exhibit 3.55). The enterprise value is comprised
of $346.3 million from the present value of the projected FCF and $787.1 million
from the present value of the terminal value. This implies that ValueCo’s terminal
value represents 69.4% of the enterprise value.
EXHIBIT 3.55
Enterprise Value
Enterprise Value
$346.3Present Value of Free Cash Flow
$189.5Terminal Year EBITDA (2013E)
Exit Multiple 7.0x
$1,326.3 Terminal Value
0.59Discount Factor
$787.1 Present Value of Terminal Value
69.4% % of Enterprise Value
$1,133.3Enterprise Value
Terminal Value
= Sum(FCF
2009-2013
, discounted at 11.0%)
= Sum($75.0 million : $61.4 million)
= PV of FCF
2009-2013
+ PV of Terminal Value
= $346.3 million + $787.1 million
= PV of Terminal Value / Enterprise Value
= $787.1 million / $1,133.3 million
= Terminal Value x Discount Factor
= $1,326.3 million x 0.59
($ in millions)

P1: ABC/ABC P2:c/d QC:e/f T1:g
c03 JWBT063-Rosenbaum March 25, 2009 9:25 Printer Name: Hamilton
154 VALUATION
Derive Equity Value We then calculated an implied equity value of $858.3 million
for ValueCo by subtracting its net debt of $275 million ($300 million of debt – $25
million of cash) from enterprise value of $1,133.3 million (Exhibit 3.56). If ValueCo
were a publicly traded company, we would then have divided the implied equity
value by its fully diluted shared outstanding to determine an implied share price (see
Exhibits 3.2 and 3.31).
EXHIBIT 3.56
Equity Value
$1,133.3Enterprise Value
Less: Total Debt (300.0)
Less: Preferred Securities -
Less: Noncontrolling Interest -
Plus: Cash and Cash Equivalents 25.0
$858.3Implied Equity Value
Implied Equity Value and Share Price
= Enterprise Value - Total Debt + Cash and Cash Equivalents
= $1,133.3 million - $300.0 million + $25.0 million
DCF Output Page Exhibit 3.57 displays a typical DCF output page for ValueCo
using the EMM.