Indian National Committee on Large Dams. Design and Construction Features of Selected Dams in India
Подождите немного. Документ загружается.

./E
o
Fr
1I
lfn
6>8
dtr
o
gd q
|_t}
_ is.
7"i
o-2
>
oFc
r:<
u
-EJ
idJ
lE5
b
_l_
q
J
o
6
o
@
6
.o
U
g.
F
o
q
4
g
le
o
6
J
s
F
U
o
:
o
o
Uy?
{;E
=
-E
-@Sc
vFoo
Y?s6
5 3{:
oooo
:
g
k
z
()
lrJ
(,
a
th
o
.l
(,)
o
o
I
o
o
J
a
:
-l
o
o
o
ts
o
J
G
Y,
I
v1
!)
GI
q)
€
o)
ra
In
c)
(r,
q,
L
A
o
.A
cl
q)
I
I
tr
G
n
zc!
J
o-o
v
N
€
r
r-'!
D
tr.
i
I
€t
I
o,
.a
:
F
z
o
F
s
UJ
J
lrj
J
z
o
F
o
trJ
a
o
o
oo
o
o oo
o
ooo
o
ooo
o
oo
o
oo
o
lll
r1l
.lrl
tl
f
I
I
I
I
l,
o
oo
o
ooo
t
L
-€-
ri
.,1
).
lr
I
t.
lr
I
oo
e
oo
c
oo
o
oo
o
ooa
ob
o
oo
o
oo
3
I
o{
or.
o*
oi)
c*
oi
ol
o-
Or)
otl
Ot|
oal
G-
||"'
l.
"o
ll*
l.:
l-o
lT
Yr-'s
&t
oo
ON
o-
oft
og
oo
ON
a-
o
.t
o
o
o
o
oo
oq
co
ON
o-
#a
It
I
:r
l_
I
t-.
-------
----
-x
r--=:F--r
--- !-'F.d
('
LN
a
6
c)
c0
tr
I
I
ql
o
v
a
r,''l
coD
lg
zi
ov
(\|:-
lfr
F
<
z
)
o.
z
o
F
u,
J
lr.,
J
!li
o
r67
E-.*.fu
______--,/
Mon.
No.
of cables
on
No.
u/s side
No.
of cables
on
d/s side
TABLE
VIII.5
Position
of cables actually
installed.
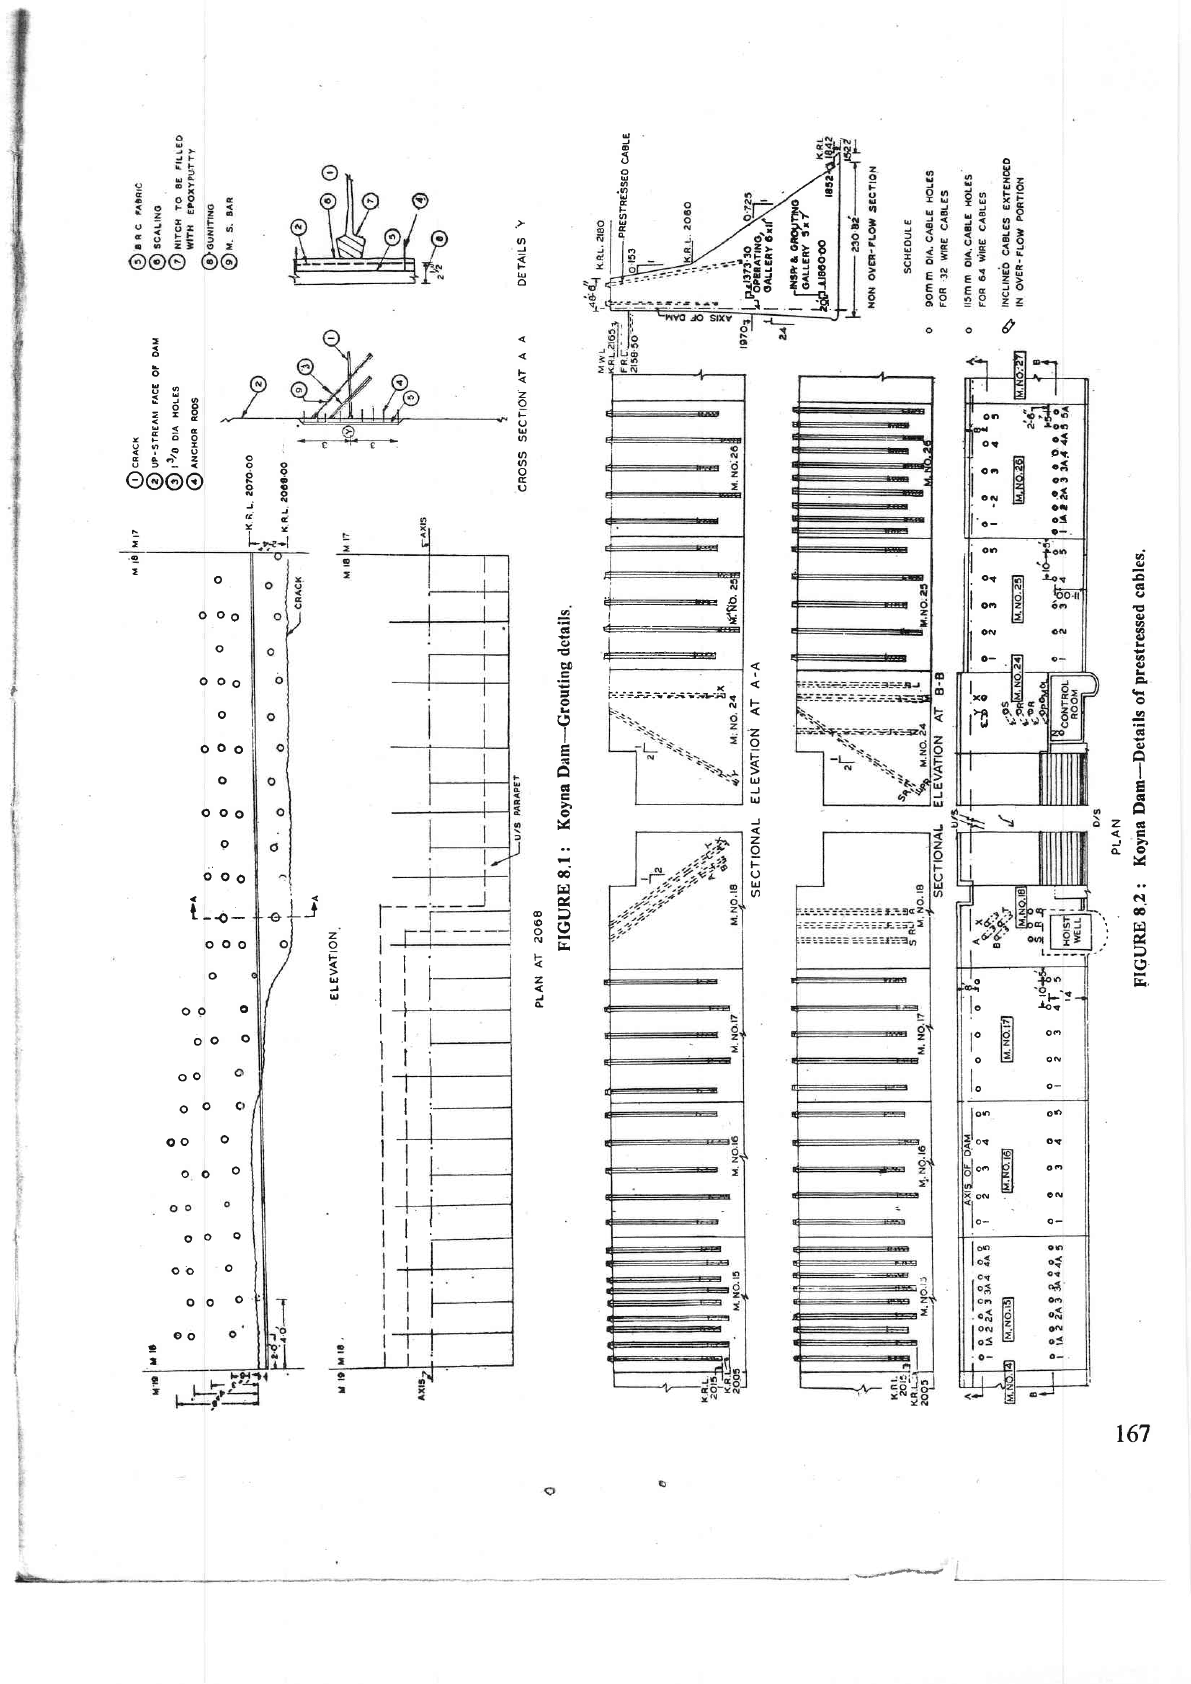
8.15
Blocks
l8
and
24
were
half
overflow
and
half
8.17 The
stresses
developed
by the
prestressing
of the
blocks
across the
block
-
plan6
is
eitimated
td be
at
5.
R.
L.
!,.06-0-
upstream
fiber
20 T
I
m2
and downstream
fiber
I T/m2
8.!q The
problems
met with
in
drillin,e,preparing
cables,
homing
them
and
other
constructionai
dimcut-
ties
are details
beyond
the
scope
of
this
paper.
8.19
To
relieve
any
locked
upwater in
cracks,
fresh
drainagg
holes were
drilled
from
the top of
dam
into
the.
galleries
or
between
the
galleries-.
Length
of
drainage
holes
drilled
is
about
3593 m of
d'0
mm
diameter.
8.20 2330
tremors
were
recorded
from 12 December
1967
to
31
March
1969.
One was
of magnitude
5.25 on
29
October
1968. With
a
maximum
recorded
accelera-
tion
of 157
cm/secz
the
structure
stood
it
well.
The
lake level
was
645 m
(2714.50
fr).
8.21
The
general
tendency
noticed
was
that the
epicentres seemed
to
migrate
away from the dam
towards SSW direction.
Total
Cable
Force
tons
256s
2700
2700
1890
2430
2700
2700
Total
30
79
1
7685
to
be
not
less
than
3
percent
on
a
5
cm
gauge
length.
8.14
The
holes drilled were 90
mm
and
120
mm
diameter
according
as the
number
of
wires
per
cable
were
32
ot
64 and
to
avoid
concentration
of
stresses
in
one
zone
the anchoring
regions
of the
cables
were
staggered
in
each
block
by varying
drilling depths
from
472
to 577 m
(157
to
192
ft).
The
anchored
bottoms
are
not all at one
level
in
any
one block,
but
staggered.
Total lengths of
holes
drilled are
2750
m
of
115
to
120 mm
diameters
and
l4ls
m
of
20
mm
diameter.
64 Wires
32 Wires
carrying
carrying
270T.
t35 T.
64
Wires
32
Wires
carrying carrying
270
T.
135 T.
t8
l0
10
7
9
l0
l5
9
10
5
J
4
)
I
1
5
5
4
'l
)
_5
15
16
t7
I8
24
25
26
l9
9-
l There
was
little
choice
left except
to buttress
the
non-overflow
blocks
of the
dam
with
an
-ample
back-
ing of
concrete.
The
properties
of the
concrete
used
for
buttressing, has to
be
compatible
with
the rubble
concrete
in
the elastic
properties.
9.2
For the
purposes
of designs,
the
blocks
are
divi-
ded broadly
intb three
categories
(f)
the
end
(extension)
masonry blocks,
(ii)
the
shallow
heiglt
blocks
on the
flanks
rinicn did
irot
crack
in
1967 December
earth-
quake;
and
(1fi)
the
central
non-overflow
blocks
which
168
Seetion
IX-Inng
-Terrn
Strengthaning
(on
deep
and
deeper
foundations),
manifested cracks
in tbe
December-1967
earthquake.
9.3
The very
flank
blocks
1-B to
l-J
(Right
Bank)
and
blocks
40
to 43
(on
Left
Bank) were
not
streng-
thened
because
they are not
only
very
shallow
in height
but
also
were
not cracked.
and are more or
less
buried
blocks.
9.4
The middle
flank
blocks
(non-overflow)
l-A
to 9
on
Right
Bank and
35-39
on Left
Bank
and
full over-
|n
o
I
t
E
.
lrl
E
.'
Eg
q.i
E
-
o
c
3_
i,
dl
(,)
t
I
v
th
o
I
a)
q)
ta,
o
c
F
DO
'l(
a
tS
.rg
€J
-ia F
69N 6
-fR
B
tB0
V-
I.=
:E
€)
-
00
c)
L
a
I
I
Gl
n
6t
o
V
-
oi
I{
'tV
E
)
rl
v
E
E
;s-
E
g,
o
,t
c
5
d
I
-l
I
J
c
x
$t
1t
o
o
c,
J
c
bi
IT
rl'
?l
a
_l_
.
dI
e
J
pc
cl
J
-
x..
q
!
8
q
I
|\.
a
E-?s
tt
ll
Itl
tr
t
B
-8-
d
t
t
to
t
T
o
o
q
-7:
bt
ni
II
!'
p
.O
6.?)
d.
5_
o
5
:
c
o
(,
a
vl
oP
;#
g
_f\r(n
rn
o
:}
o
D
c
lrj
+'I
a
fr
5
{
o
t
n,
J
a
i
q
ir
r-3-
r69
I
I
D/S
face
of
exisiing dom
Dowel
bor
K.R L.2028.09
30-28
.2026.50
u
R.L
2O?5.OO
r
key
Zx^l
K.R.L.2030.OO
R.L.202t.25
/rK.R.L.202O.OO
R.L 20
t5
o
heor
key-
'#,
I
F
Dowel
bor
oI 5 C/C
K.R
L.zO?l'Ogr_
g50
BUTTRESS
.L.2(.j-U.25
.R.L
20rO.CC
Sheor
key
*
\t,
Dowel
bor
ot
?4
Gop--l
Sheor'key
Dowel
bor ot
K.R.L.20t3.O9
K.R.1.20
flow
blocks
which
have
not cracked were
to
be
checked
with
a
design
seismic
coefficient 0.12
(g)
upstream to
downstream
with
reservoir
full
and
0.06
(g)
seismic
co-
efficient
from
downstream to upstream
with
reservoir
at
El. 2000.
There
should not be
any
tension,
and
if
any
it
should
be
insignificant.
9.5
The
deep and deeper
non-overflow
blocks 10
to
18
on
right
bank
and'24
to
29
on left
bank which
have
cracked should
be strengthened
to have
no
tension
with
design
seismic
coefficient
0.20
(g)
from
upstream
to
170
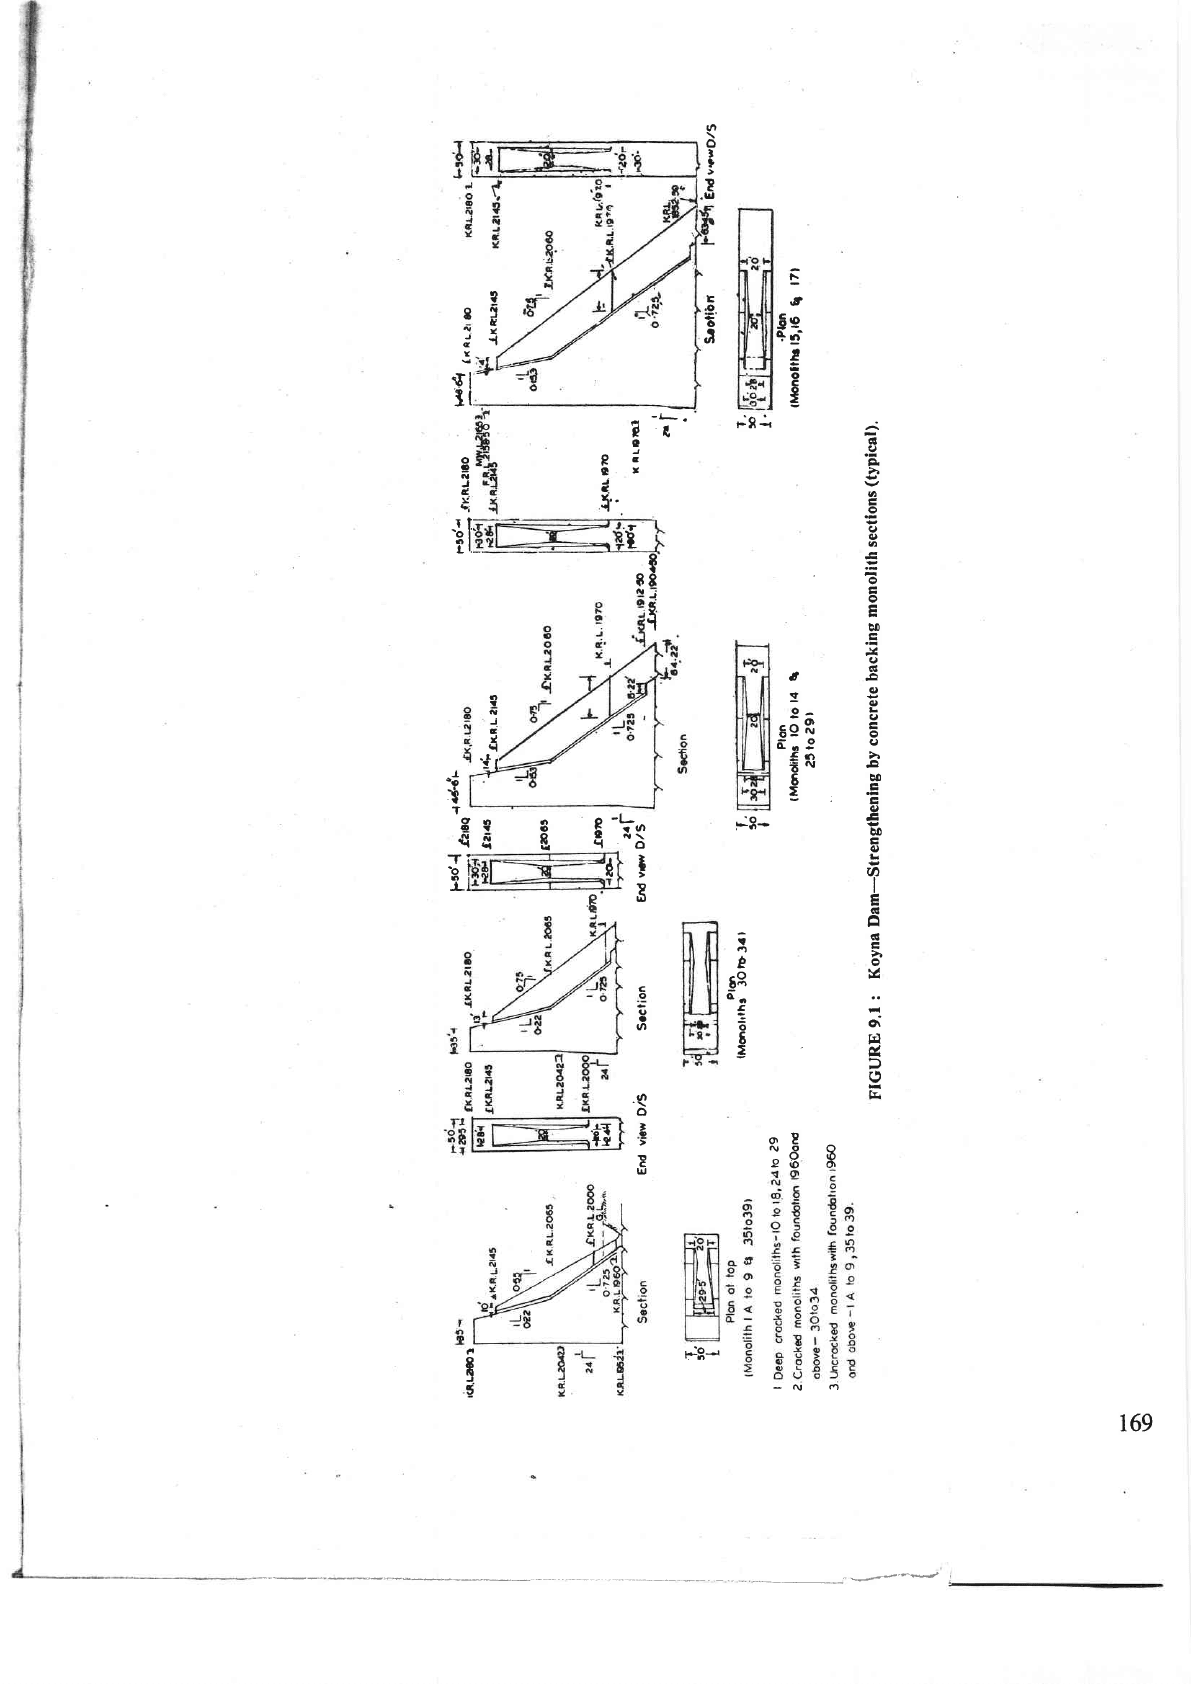
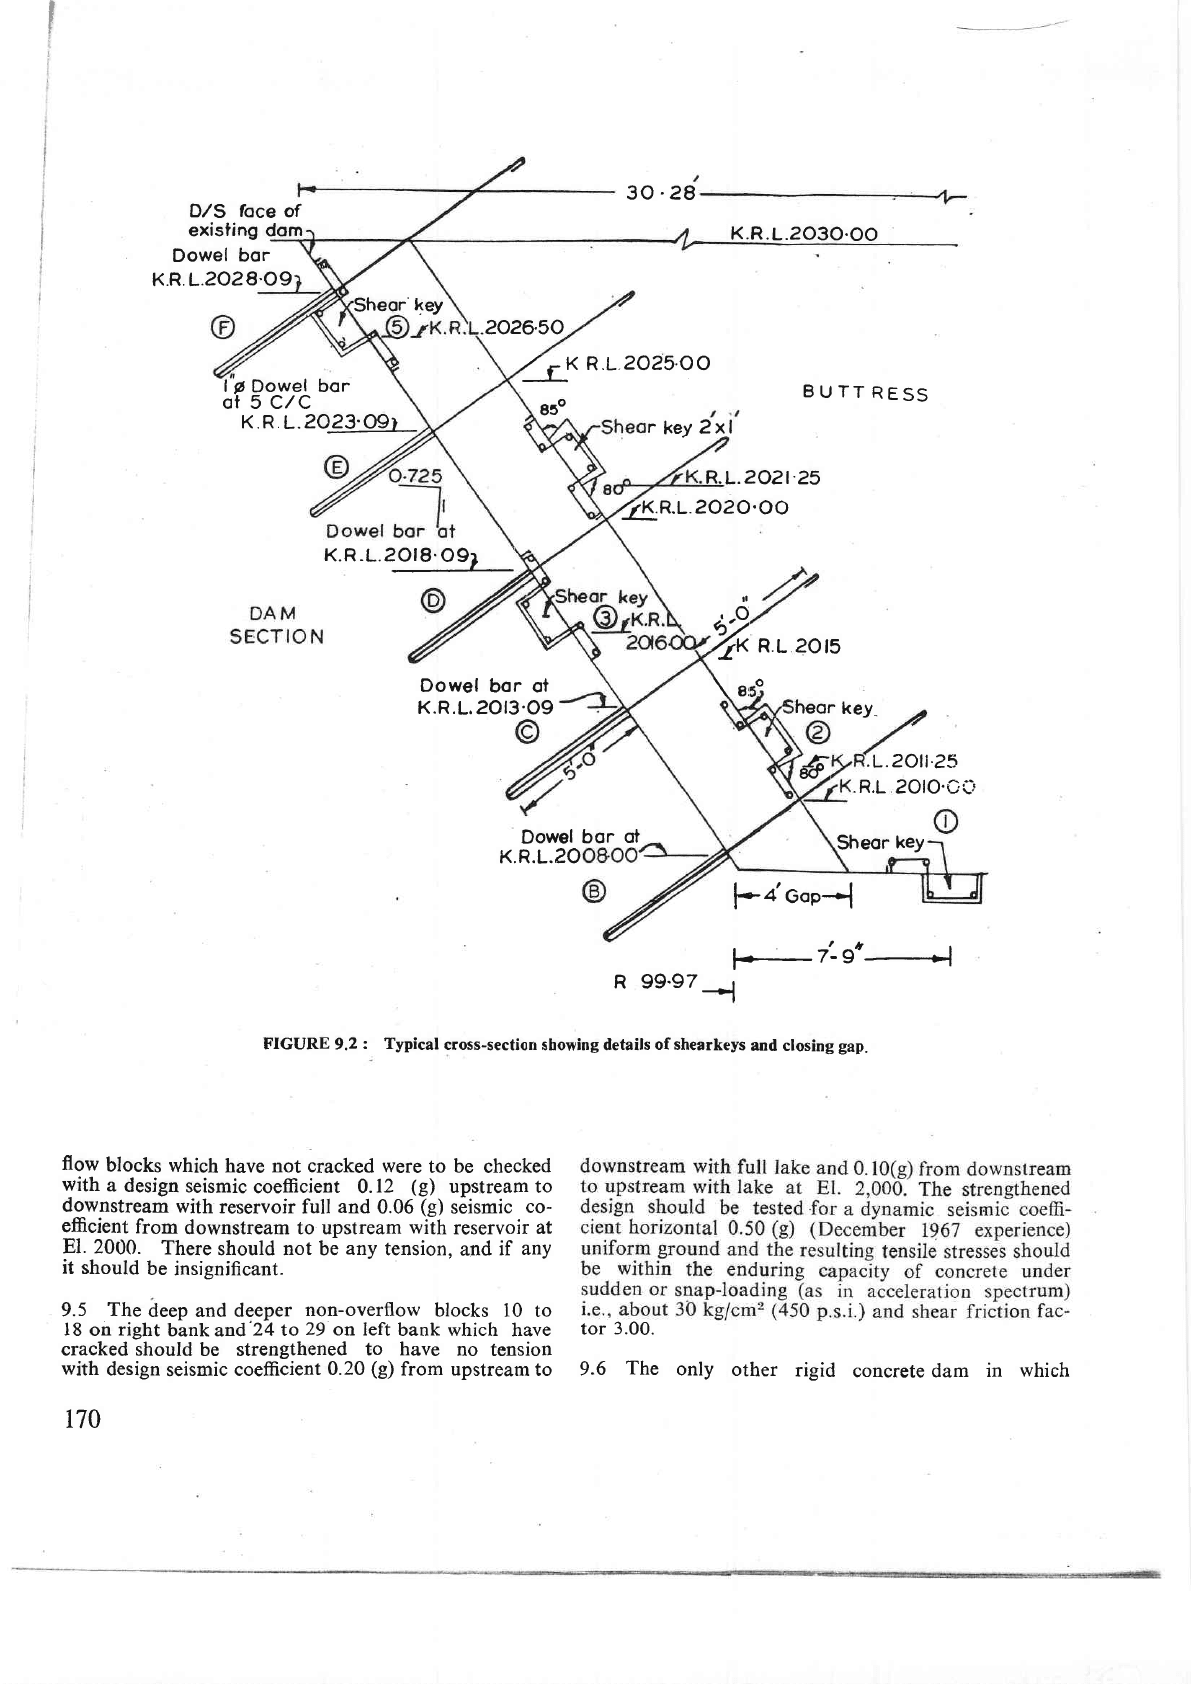
FIGURE 9.2
: Typical
cross-sectiorr
showing details
of shearkeys
and closing
gap.
l*_z'-g*4
R 99.97
_l
tor
3.00.
9.6
The
only
other
rigid
concrete dam
in
which
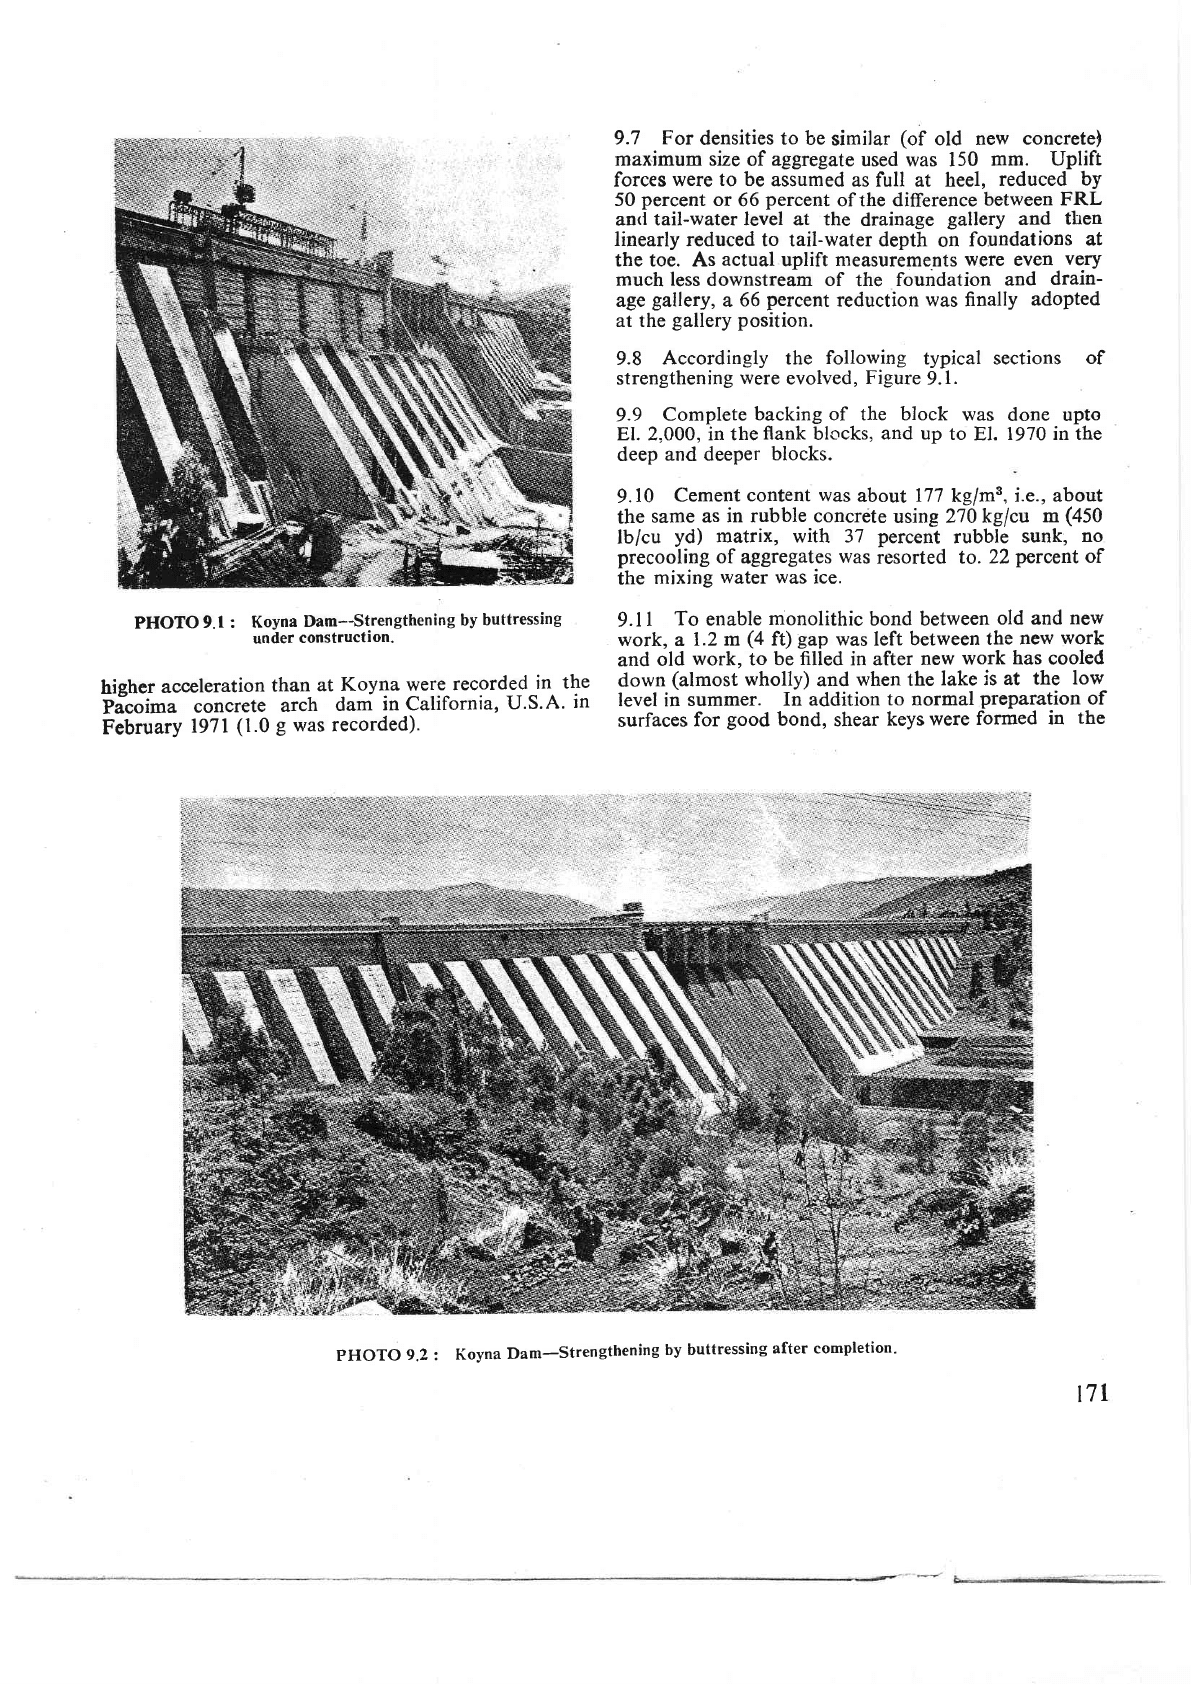
PHoro
e.r :
Tfl#""#$;,-:,1:f.r.nening
bv
buttressing
higher
acceleration
than
at
Koyla
were
recorded
in the
Ficoima
concrete
arch
dam
in California,
LI.S.A.
in
February
l97l
(1.0
g
was recorded).
9.7
For
densities
to
be
similar
(of
old
new
concrete)
maximum size
of aggregate
used was 150
mm. Uplift
forces
were
to be
assumed
as full at heel,
reduced
by
50
percent
or
66
percent
of the difference
between FRL
antl
tail-water level at the
drainage
gallery and
ttren
linearly
reduced to tail-water depth
on
foundations
at
the toe. As
actual
uplift
n'leasurements
were
even
very
much
less
downstream of
the
fouidation
and
drain-
age
gallery,
a
66
percent
reduction was finally
adopted
at the
gallery
position.
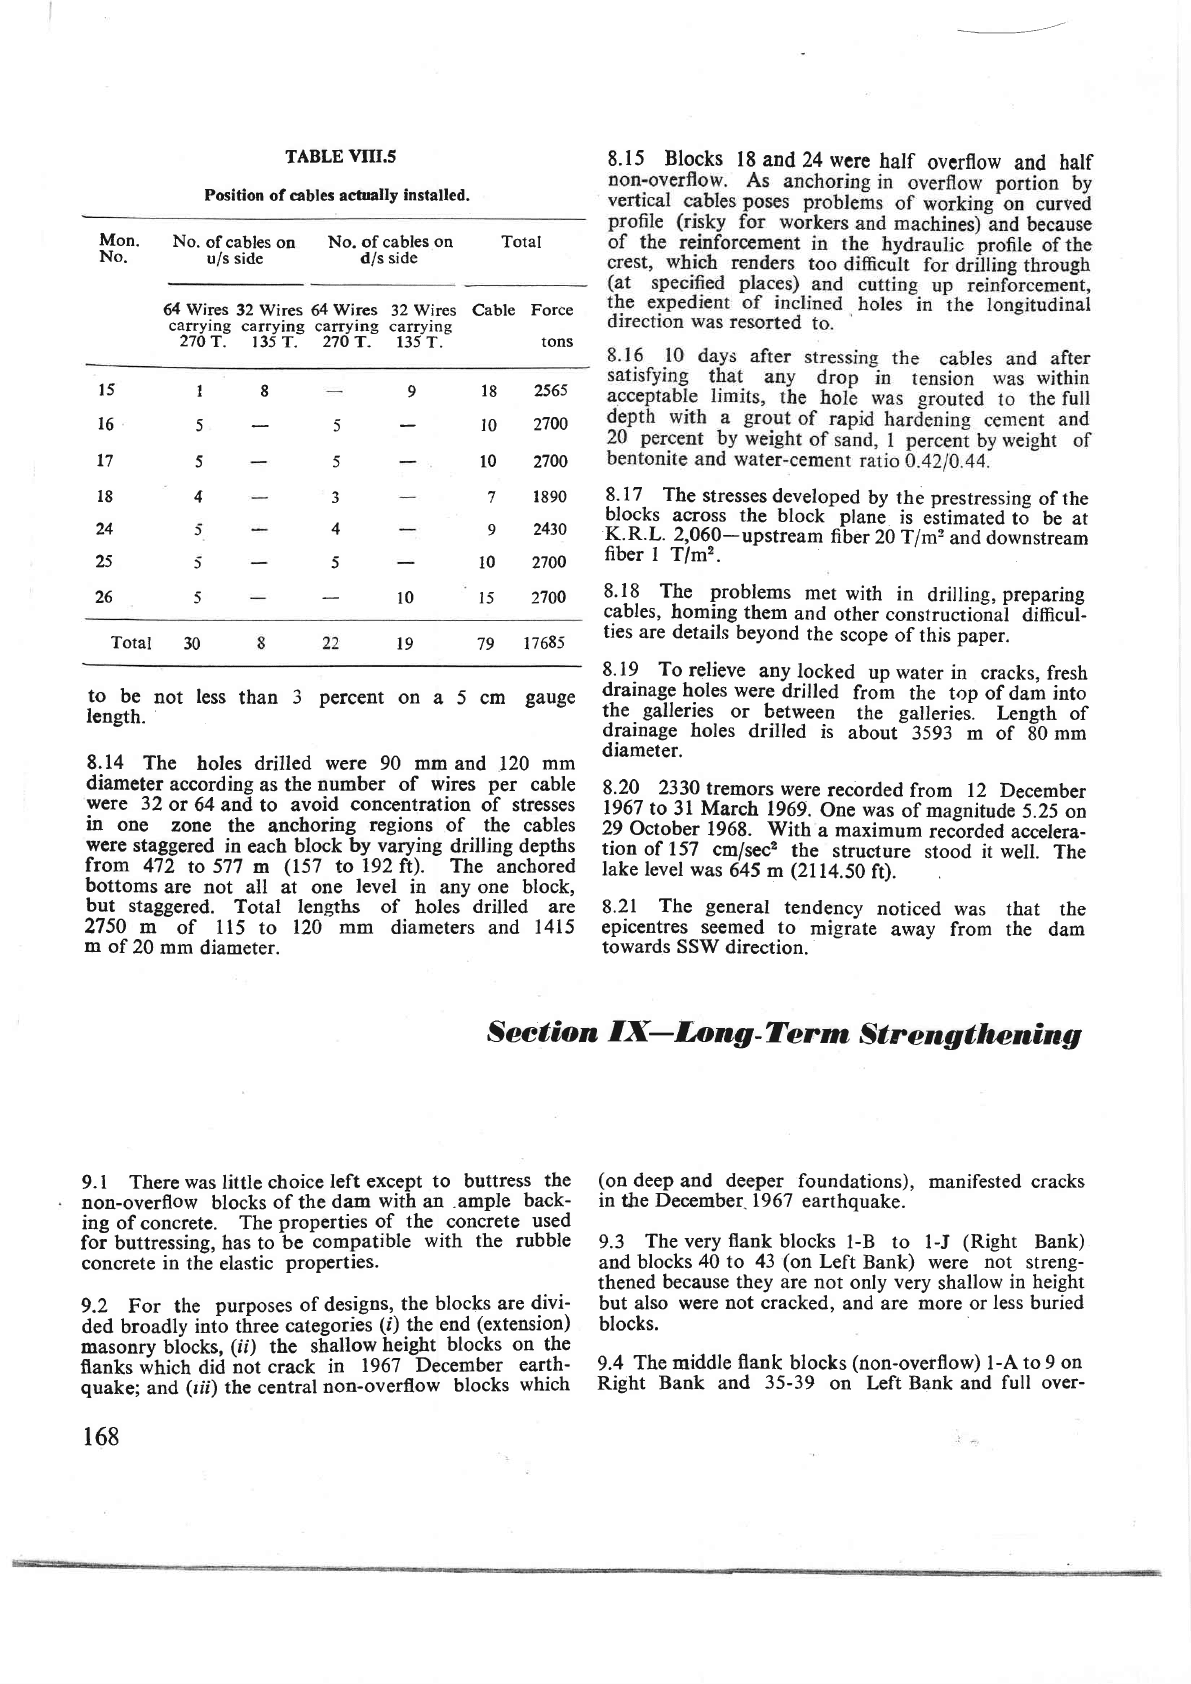
9.8
Accordin,ely the
following
typical sections
of
strengthening
were
evolved,
Figure
9.1.
9.9
Complete
backing of the block
was
done upto
El. 2,000, in the
flank
blccks,
and up
to
El.
l97O in the
deep
and deeper
blocks.
9.10
Cement
content was
about
177
kg/mt,
i.e., about
the
same as
in rubble concrdte
using
270kglcu
m
(450
lb/cu
yd)
matrix,
with 37
percent
rubble
sunk,
no
precooling of
aggregates
was
resorted to.
22
percent
of
the
mixing
water was
ice.
9.ll
To
enable
monolithic
bond between
old and
new
work, a
1.2 m
(4
ft)
gap
was left
between
the
new
work
and
old
work,
to be
filled
in after
new
work has cooled
down
(almost
wholly)
and
when the
lake is at
the
low
level in
summer.
In addition
to normal
preparation
of
surfaces
for
good
bond,
shear
keys were
formed
in
the
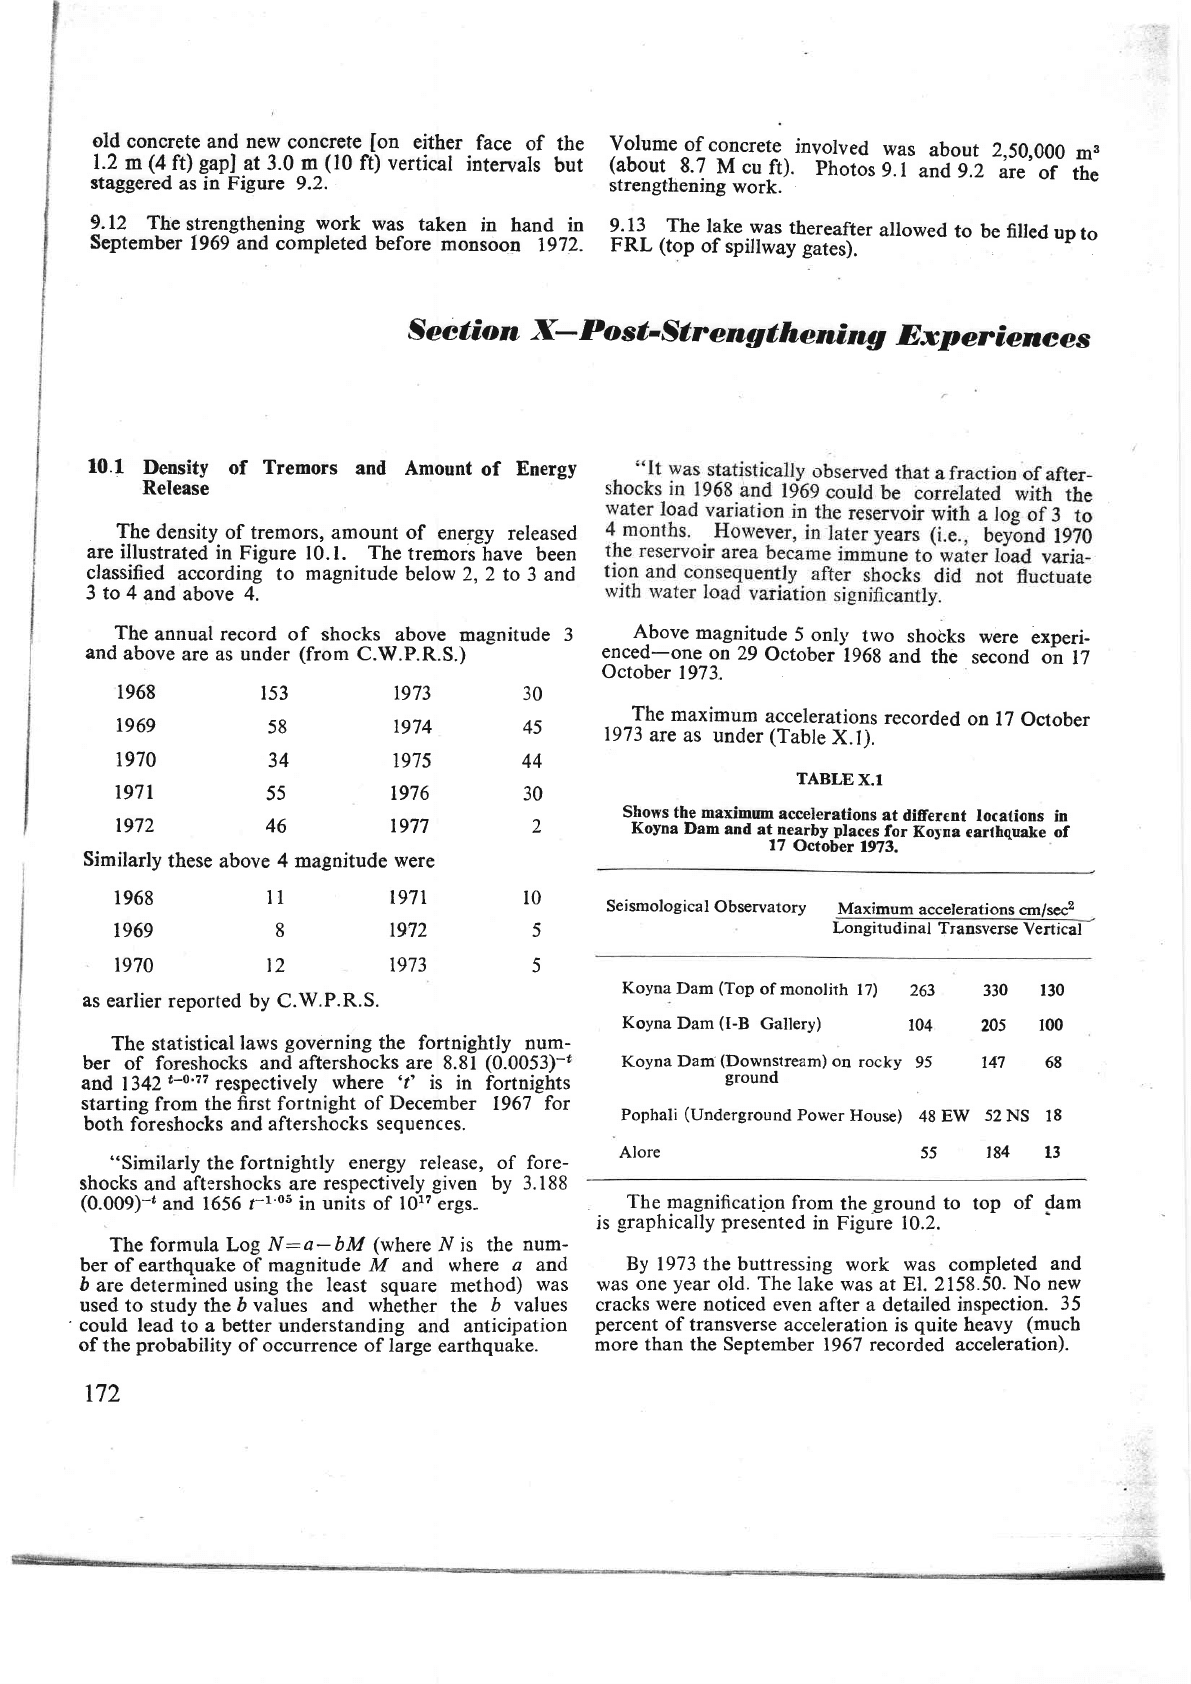
PHOTO
9.2
:
Koyna
Dam-strengthening
by buttressing
after completion'
t7l
old
concrete
and
new
concrete
[on
either
face
of the
1.2
m
(4
ft)
gapl
at
3.0
m
(10
f0
vertical
intervals
but
staggered
as in
Figure 9.2.
9.12
The
strengthening
work
was
taken
in
hand
in
September
1969
and
completed before
monsoon
1972.
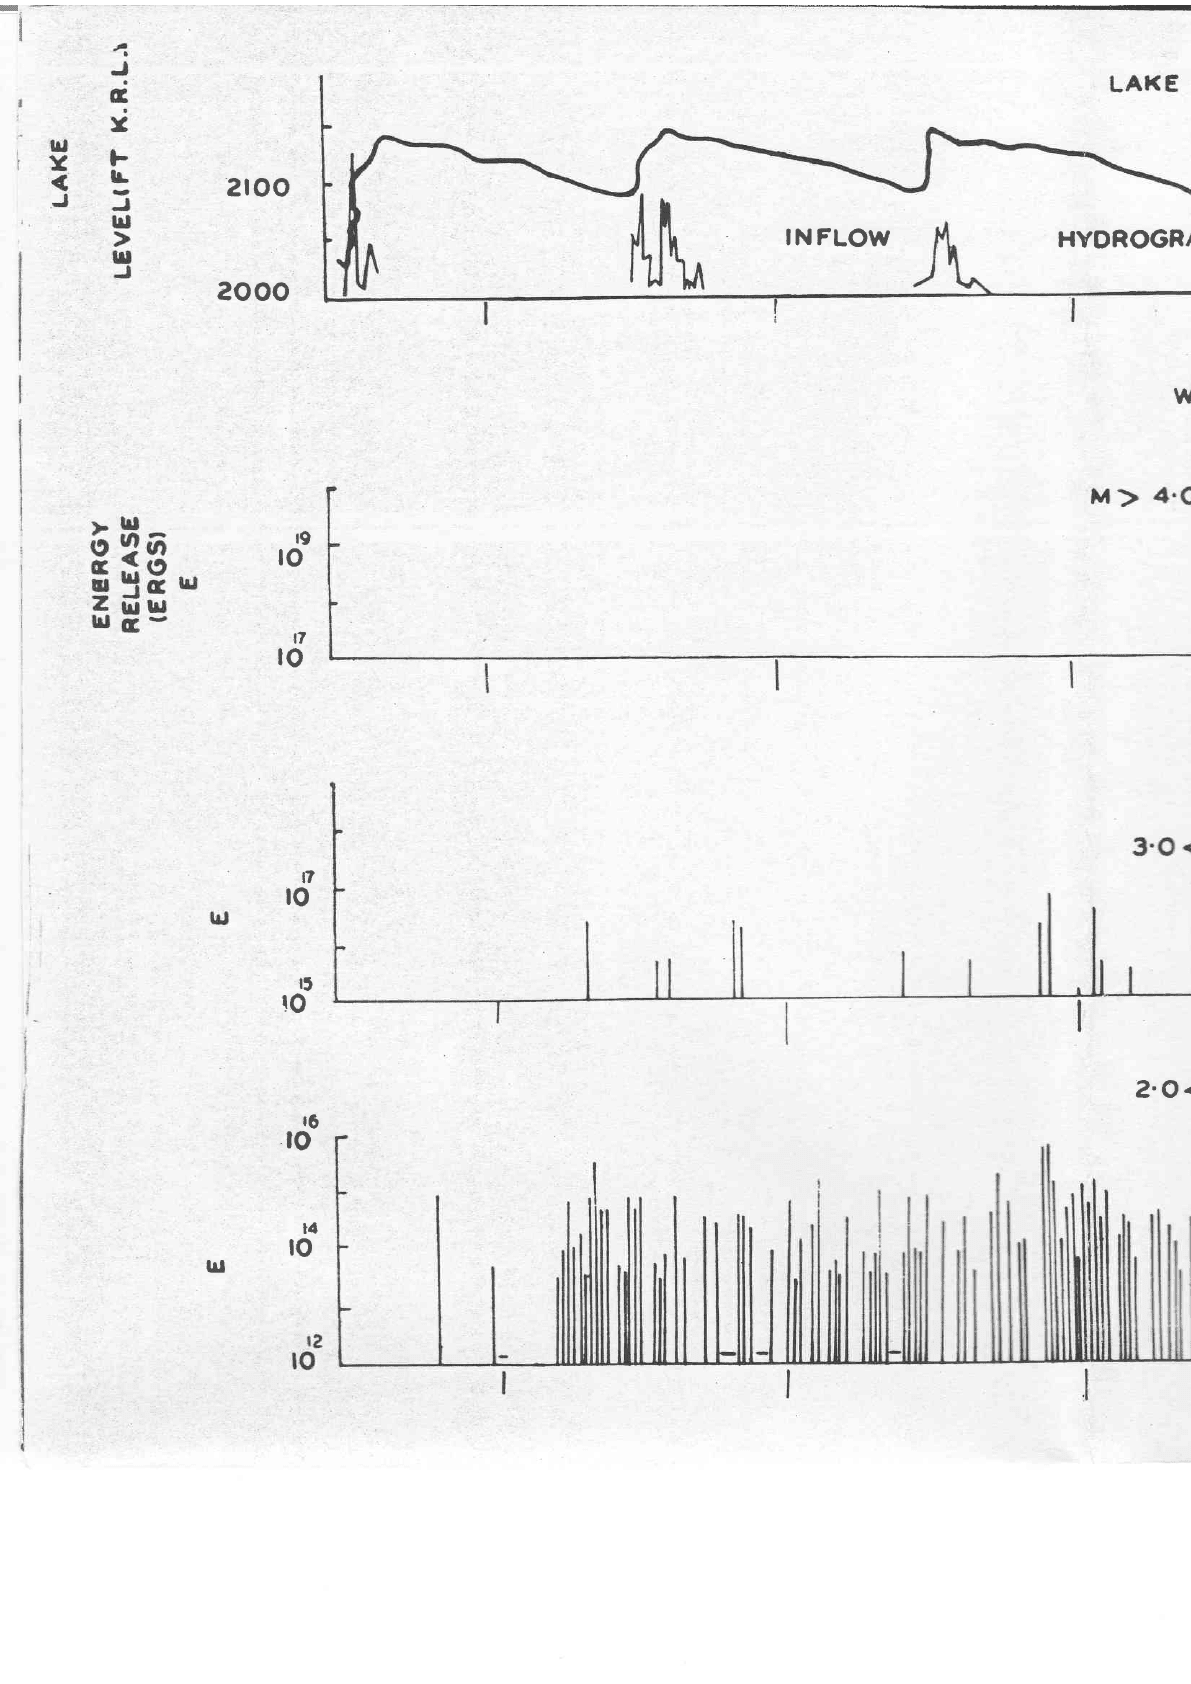
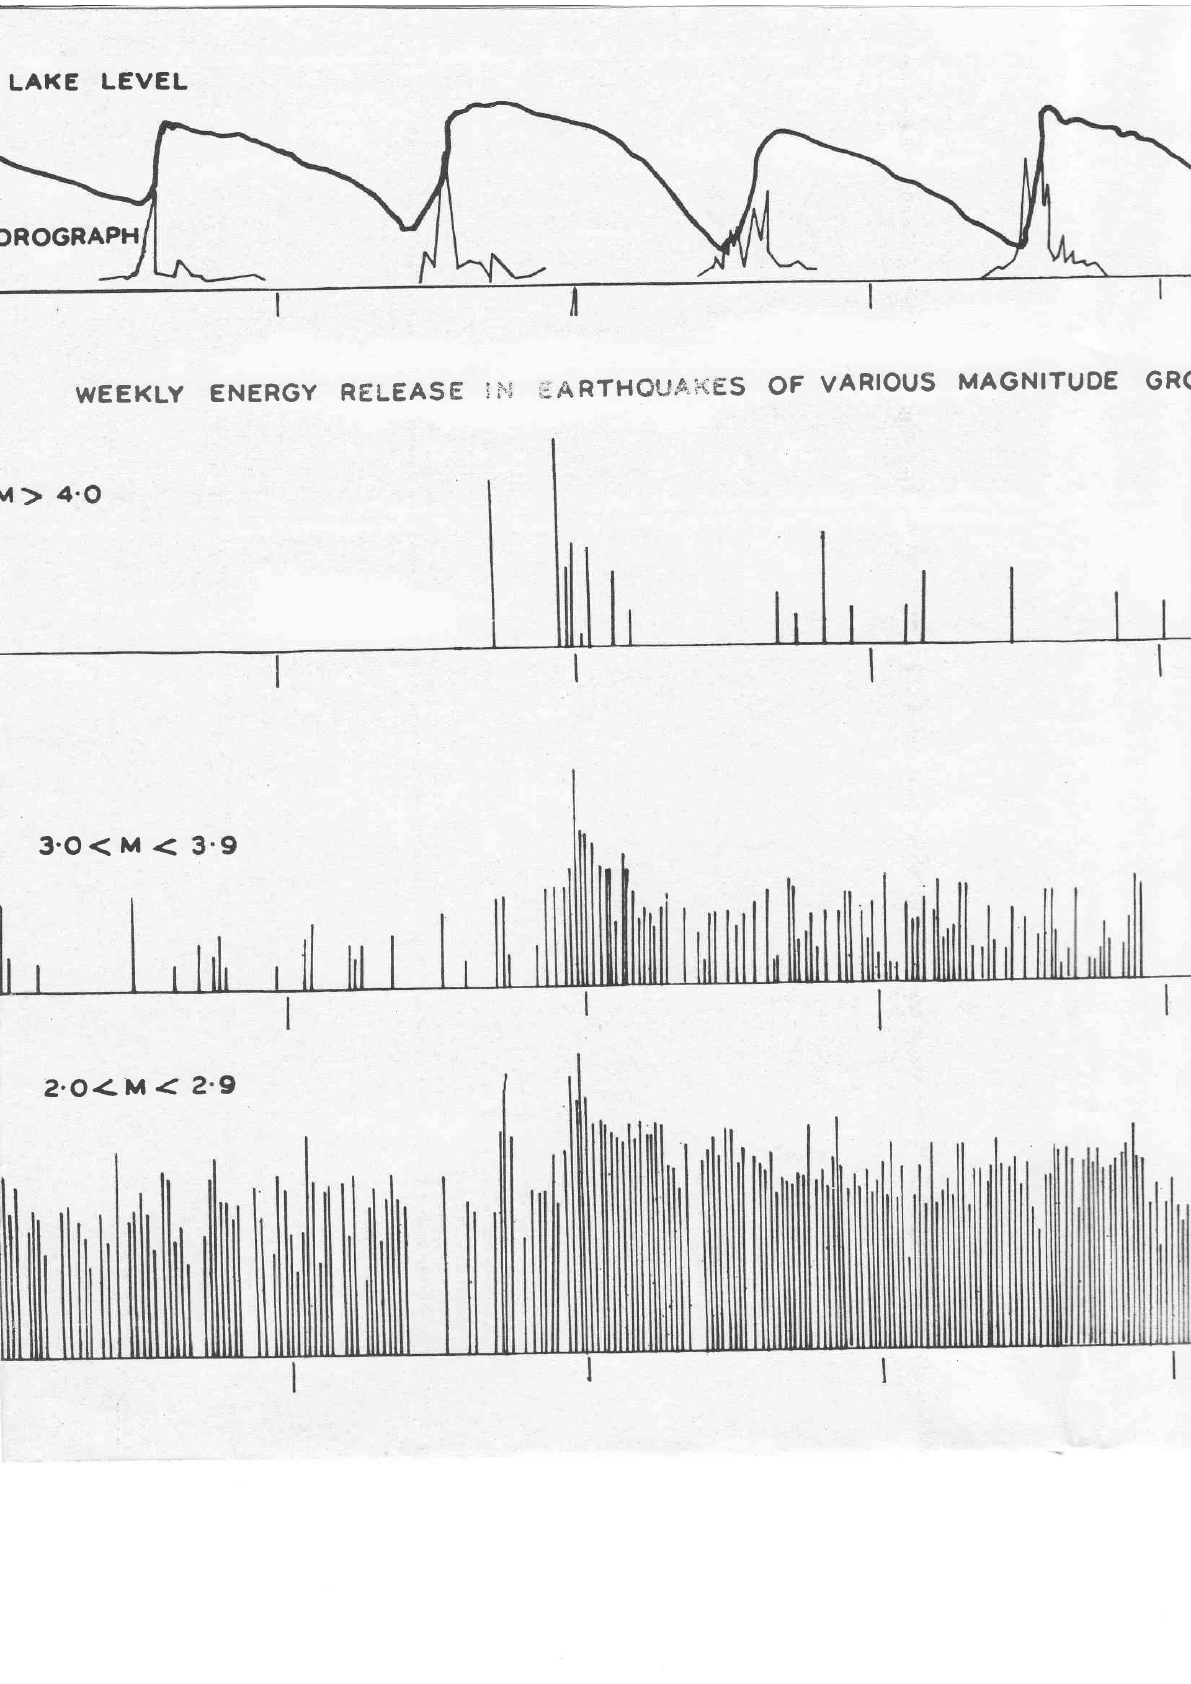
10.1
Density
of
Tremors
and
Amount
of
Energy
Release
The
density
of tremors,
amount
of
energy
released
are illustrated
in
Figure 10.1.
The
tremors
have been
classified
according
to
magnitude
below
2,2 to
3 and
3 to 4
and above 4.
The
annual record
of shocks
above
magnitude
3
and
above
are as
under
(from
C.W.P.R.S.)
volume
of
concrete
involved
was
about
2,50,000
mB
(about
8.7
M
cuft).
Photos
9.r
and9.2
"t"'or
the
strengthening
work.
9-
13
The
lake
was
thereafter
allowed
to be filled
up
to
FRL
(top
of
spillway
gates).
153
58
34
55
46
Similarly
these
above
4 magnitude
were
1968
1969
1970
r97l
t972
1968
t969
1970
1973
r974
1975
t976
r977
t97l
r972
30
45
44
30
2
t0
5
n
8
t2
1973
5
as
earlier reported
by C.W.P.R.S.
The
statistical
laws
governing
the fortnightly num-
ber
of foreshocks and
aftershocks
are
8.81
(0.0053)-t
and
1342t-o'?7
respectively
where
't'
is
in
fortnights
starting
from
the
first
fortnight
of
December
1967 for
both
foreshocks
and aftershocks
sequences.
"Similarly
the fortnightly
energy release, of fore-
shocks
and aftershocks
are
respectively
given
by
3.188
(0.OOS)-'
and 1656
1-1'05 in units
of
101?
ergs-
The
formula Log
N:a-bM
(where
N is the
num-
ber
of earthquake
of magnitude
M
and
where
a
and
b
arc determined using
the
least
square
method)
was
used
to study the
b values
and
whether
the
b
values
'
could
lead
to
a
better
understanding
and anticipation
of
the
probability
of occurrence of large
earthquake.
172
Koyna
Dam
(Top
of monolith
12)
263
Koyna
Dam
(I-B
Gallery)
104
Koyna
Dam
(Downstream)
on
rocky
95
ground
Pophali
(Underground
Power
House)
48
EW
330 130
205
100
147 68
Alore
52
NS 18
r84
13
The
magnificati-on
from
the
ground
to
top
of
dam
is
graphically
presented
in
Figure
10.2.
By 1973 the buttressing
work was
completed
and
was
one
year
old.
The
lake
was at Et.2158.50.
No new
cracks
were
noticed
even
after
a detailed inspection.
35
percent of
transverse acceleration
is
quite
heavy
(much
more than the
September
1967 recorded acceleration).
55
Seetion x- Post-Strengthening
Experienees
A-bove
magnitude
5
_only
two
shocks
were
experi-
enced-one
on
29
October
-1968
and
the
second on
tZ
October
1973.
The
maximum
accelerations
recorded
on
l7
october
1973
are
as under (Table
X.l).
TABLE
X.l
shows
the
maximum
accelerations
at
different
locations
in
Kovna
Dam
and
"i;"ffJ,r"f#"r.r-rl:'Koyna
earthquake of
Seismological
Observatory
Maximum
accelerations
cm/secz
Longitudinal
Transverse
Vertical
IN FLOW
HYOROGRI
I.
I
r9
to
2too
eooo
r7
lo
t?
lo
rl
to
t6
to
l4
to
lrl
vr
2'O.
LAI(E
LEVEL
)ROGRAPH
WEEKLY
ENERGY
RELEASE
3}:
gARTHGUAi{ES
OF
VARIOUS
MAGNITUOE
GR(
3'O<
M
<
2.O<-;
<
5111
.asuala
900(
-
l-
300c
I
JDE
OROUPS
tun33c
t{
to
lrl
rZ
lo
lo
I
WEEKLY
I
FR
EOUENCY
OF
OCCURRENCE
foo
to
I
z
o
lrf
t
f
o
t
F
G
lrl
IL
o
.c
Irf
D
I
3
z
loo
to
I
too
to
I
r965
3.O<
M
12
FIGUR"E
l0.l
:
Group-wise weckly eoerglr
releasc,
frcquancy
of
occru