IEA Statistics. Oil Information 2011
Подождите немного. Документ загружается.


III.208 - OIL INFORMATION (2011 Edition)
FINLAND
Table 7D: Imports by country of origin
000 metric tons
2008 2009 2010e 2008 2009 2010e 2008 2009 2010e
Fuel oil (residual) Petroleum coke Other products
Australia - - - - - - - - -
Bel
g
ium 28 - 29 - - - 37 53 51
Canada - - - - - - 1 - -
Czech Re
p
ubli
c
- - - - - - - - -
Denmark 86 68 118 - - - 1 2 -
Finland - - - - - - - - -
France 46 49 9 - - - 35 13 14
German
y
- 20 17 1 11 - 30 28 23
Greece - - - - - - - - -
Hun
g
ar
y
- - - - - - - - -
Ireland - 25 - - - - - - -
Ital
y
- - - --- - 1 -
Ja
p
an - - - - - - - - -
Korea - - - - - - - 4 12
Mexic
o
- - - - - - - - -
Netherlands 172 70 200 38 40 27 89 74 52
New Zealand - - - - - - - - -
Norwa
y
87 18 - - - - 8 12 -
Poland - - - - - - 2 2 2
S
p
ain - - - - - - 3 - -
Sweden 327 273 310 1 - - 24 29 42
Turke
y
- - - - - - 4 2 -
United Kin
g
dom - 53 - 3 - 8 76 40 26
United States - - - 39 44 60 6 1 -
Othe
r
- - - - - - - - -
OECD 746 576 683 82 95 95 316 261 222
Ar
g
entina - - - - - - - - -
Brazil - - - - - - - - -
Colombia - - - - - - - - -
Ecuado
r
- - - - - - - - -
Netherlands Antilles 25 - - - - - - - -
Peru - - - - - - - - -
Trinidad and Toba
go
- - - - - - - - -
Venezuela - - - 19 - 4 - - -
Othe
r
- - - - - - - - -
Latin America 25 - - 19 - 4 - - -
Kazakhstan - - - - - - 5 10 1
Russian Federation 29 5 10 - - - 434 385 435
Other - - - - - - 18 1 3
Non-OECD Europe/Eurasia
29 5 10 - - - 457 396 439
Iran - - - - - - - - -
Ira
q
- - - - - - - - -
Kuwai
t
- - - - - - - - -
Oman - - - - - - - - -
Qata
r
- - - - - - - - -
Saudi Arabia - - - - - - - - -
United Arab Emirates - - - - - - - - -
Othe
r
- - - - - - 15 - -
Middle East - - - - - - 15 - -
India - - - - - - - - -
Indonesi
a
- - - - - - - - -
Sin
g
a
p
ore - - - - - - - - -
Othe
r
- - - - - - - - -
Asia - - - - - - - - -
China - - - - - - 1 - -
Al
g
eria - - - - - - - - -
An
g
ola - - - - - - - - -
Cameroon - - - - - - - - -
E
gypt
- - - - - - - - -
Gabon - - - - - - - - -
Lib
y
an Arab Jamahiri
y
a - - - - - - - - -
Ni
g
eria - - - - - - - - -
Tunisia - - - - - - - - -
Othe
r
- - - --- - 2 -
Africa - - - - - - - 2 -
Non-spec./other - - - - - - - - -
Total imports 800 581 693 101 95 99 789 659 661
Memo: Total OPEC - - - 19 - 4 - - -
Source: Annual Oil Statistics.
INTERNATIONAL ENERGY AGENCY

OIL INFORMATION (2011 Edition) - III.209
FINLAND
Table 8A: Exports by country of destination
000 metric tons
2008 2009 2010e 2008 2009 2010e 2008 2009 2010e
Crude oil Natural gas liquids Feedstocks and other
Australia - - - - - - - - -
Austria - - - - - - - - -
Bel
g
ium - - - - - - - - -
Canada - - - - - - - - -
Denmark - - - - - - - - -
Finland - - - - - - - - -
France - - - - - - - - -
German
y
- - - - 25 - - - -
Greece - - - - - - - - -
Ireland - - - - - - - - -
Ital
y
- - - - - - - - -
Ja
p
an - - - - - - - - -
Luxembour
g
- - - - - - - - -
Mexic
o
- - - - - - - - -
Netherlands - - - - - - - - -
Norwa
y
- - - - - - - - -
Portu
g
al - - - - - - - - -
S
p
ain - - - - - - - - -
Sweden - - - - - - - - -
Switzerland - - - - - - - - -
Turke
y
- - - - - - - - -
United Kin
g
dom - - - - - - - - -
United States - - - - 83 - - - -
Other OECD - - - - - - - - -
OECD - - - - 108 - - - -
Africa - - - - - - - - -
Latin America - - - - - - - - -
Asia - - - - - - - - -
China - - - - - - - - -
Non-OECD Euro
p
e/Eurasi
a
- - - - - - - - -
Russian Federation - - - - - - - - -
Middle Eas
t
- - - - - - - - -
Non-s
p
ecified/Othe
r
- - - - - - - - -
Non-OECD - - - - - - - - -
Total exports - - - - 108 - - - -
Total products Liquefied petroleum gas Naphtha
Australia - - - - - - - - -
Austria - - - - - - - - -
Bel
g
ium 399 398 549 - 2 - - - 1
Canada 290 432 581 - - - - - -
Denmark 176 166 472 - - - - - -
Finland - - - - - - - - -
France 211 39 182 - - 2 - - -
German
y
291 68 375 - - - 9 6 -
Greece - - - - - - - - -
Ireland 13 - 11 - - - - - -
Ital
y
- - - - - - - - -
Ja
p
an - - - - - - - - -
Luxembour
g
- - - - - - - - -
Mexic
o
- - - - - - - - -
Netherlands 327 674 854 - 3 - - - -
Norwa
y
21 112 50 - - - 2 - -
Portu
g
al - - - - - - - - -
S
p
ain 121 - 30 - - - - - -
Sweden 1 879 1 955 2 050 - 4 - 3 - -
Switzerland - - - - - - - - -
Turke
y
3 11 12 - - - - - -
United Kin
g
dom 305 78 109 - - - - 7 -
United States 1 223 1 088 329 - - - - 23 -
Other OECD 1 083 1 161 666 - 2 4 - - -
OECD 6 342 6 182 6 270 - 11 6 14 36 1
Africa - 107 68 - - - - - -
Latin America - - - - - - - - -
Asia - 6 67 - - - - - -
China - - - - - - - - -
Non-OECD Euro
p
e/Eurasi
a
31 78 215 - 1 - 5 - -
Russian Federation 137 117 95 - - - - - -
Middle Eas
t
63 - - - - - - - -
Non-s
p
ecified/othe
r
- - 208 - - - - - -
Non-OECD 231 308 653 - 1 - 5 - -
Total exports 6 573 6 490 6 923 - 12 6 19 36 1
Source: Annual Oil Statistics.
INTERNATIONAL ENERGY AGENCY

III.210 - OIL INFORMATION (2011 Edition)
FINLAND
Table 8B: Exports by country of destination
000 metric tons
2008 2009 2010e 2008 2009 2010e 2008 2009 2010e
Total gasoline Total kerosene Gas/diesel oil
Australia - - - - - - - - -
Austria - - - - - - - - -
Bel
g
ium - 7 - 70 90 75 - 10 33
Canada 290 418 566 - - - - 14 15
Denmark 39 - - - - - 123 147 249
Finland - - - - - - - - -
France - - - 28 14 11 182 22 164
German
y
35 2 28 - - - 215 34 341
Greece - - - - - - - - -
Ireland - - 11 - - - 13 - -
Ital
y
-- - --- - - -
Ja
p
an -- - --- - - -
Luxembour
g
-- - --- - - -
Mexic
o
-- - --- - - -
Netherlands - 85 232 - - 19 58 122 98
Norwa
y
11 40 44 - - - - 49 -
Portu
g
al -- - --- - - -
S
p
ain - - - - - 8 121 - 22
Sweden 608 508 678 1 - 4 1 083 1 089 1 126
Switzerland - - - - - - - - -
Turke
y
-- - --- - - -
United Kin
g
dom - - 38 - - 2 244 42 65
United States 1 206 1 048 318 - - - - - -
Other OECD 11 87 169 - - - 1 033 1 024 457
OECD 2 200 2 195 2 084 99 104 119 3 072 2 553 2 570
Africa - 107 68 - - - - - -
Latin America - - - - - - - - -
Asia - - 63 - - - - - 4
China - - - - - - - - -
Non-OECD Euro
p
e/Eurasi
a
- 44 8 - - - - 13 192
Russian Federation 14 15 12 - - - - - -
Middle Eas
t
63 - - - - - - - -
Non-s
p
ecified/Othe
r
-- 208 --- - - -
Non-OECD 77 166 359 - - - - 13 196
Total exports 2 277 2 361 2 443 99 104 119 3 072 2 566 2 766
Fuel oil (residual) Petroleum coke Other products
Australia - - - - - - - - -
Austria - - - - - - - - -
Bel
g
ium 88 64 21 - - - 241 225 419
Canada - - - - - - - - -
Denmark 13 16 218 - - - 1 3 5
Finland - - - - - - - - -
France - - - - - - 1 3 5
German
y
- 13 - - - - 32 13 6
Greece - - - - - - - - -
Ireland - - - - - - - - -
Ital
y
-- - --- - - -
Ja
p
an -- - --- - - -
Luxembour
g
-- - --- - - -
Mexic
o
-- - --- - - -
Netherlands 269 460 331 - - - - 4 174
Norwa
y
-- - --- 8 23 6
Portu
g
al -- - --- - - -
S
p
ain -- - --- - - -
Sweden 86 249 124 - - - 98 105 118
Switzerland - - - - - - - - -
Turke
y
- - - - - - 3 11 12
United Kin
g
dom 60 28 - - - - 1 1 4
United States - 10 - - - - 17 7 11
Other OECD - 27 10 - - - 39 21 26
OECD 516 867 704 - - - 441 416 786
Africa - - - - - - - - -
Latin America - - - - - - - - -
Asia - - - - - - - 6 -
China - - - - - - - - -
Non-OECD Euro
p
e/Eurasi
a
- - - - - - 26 20 15
Russian Federation - - - - - - 123 102 83
Middle Eas
t
-- - --- - - -
Non-s
p
ecified/othe
r
-- - --- - - -
Non-OECD - - - - - - 149 128 98
Total exports 516 867 704 - - - 590 544 884
Source: Annual Oil Statistics.
INTERNATIONAL ENERGY AGENCY
OIL INFORMATION (2011 Edition) - III.211
FRANCE
* Excluding electricity trade.
** Includes hydro, geothermal, solar, wind, combustible renewables and waste, etc.
Source: Annual Energy Balances.
0
10
20
30
40
50
60
70
80
Coal Oil Gas Nuclear Other **
Percentage
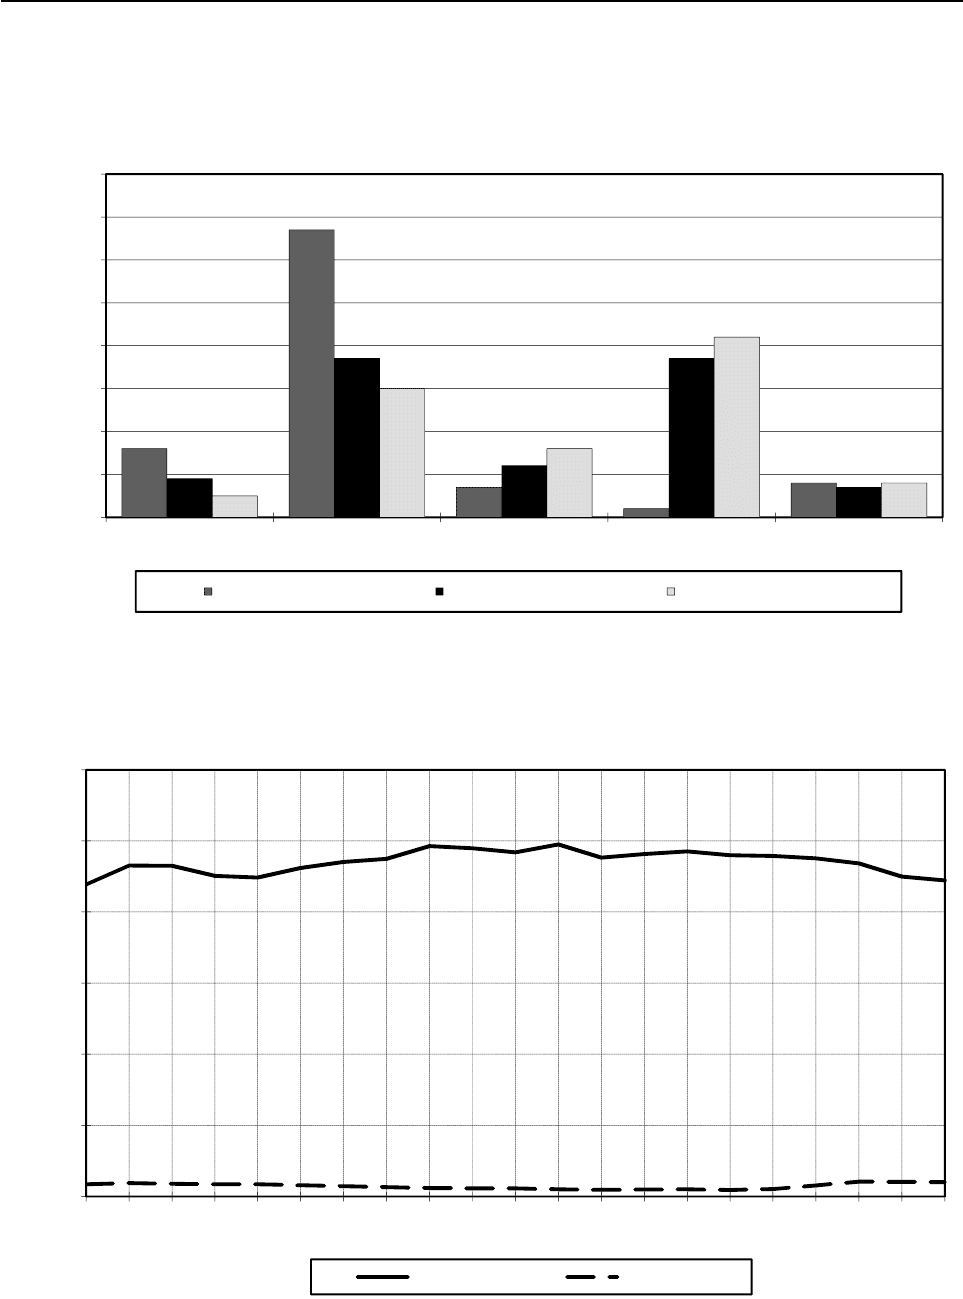
Figure 1. Fuel shares of TPES *
1973 TPES = 180 Mtoe 1990 TPES = 224 Mtoe 2010e TPES = 264 Mtoe
120
Figure 2. Oil production and consumption
*** Includes refinery fuel and international marine bunkers.
Source: Annual Oil Statistics.
0
20
40
60
80
100
120
1990
1991
1992
1993
1994
1995
1996
1997
1998
1999
2000
2001
2002
2003
2004
2005
2006
2007
2008
2009
2010e
Million Metric Tons
Fi
gure
2
.
Oil
pro
d
uc
ti
on an
d
consump
ti
on
Consumption *** Production
INTERNATIONAL ENERGY AGENCY

III.212 - OIL INFORMATION (2011 Edition)
FRANCE
Table 1: Oil supply and consumption - summary table
000 metric tons
1973 1978 1980 1990 2007 2008 2009 2010e
Indigenous production
1
2 066 1 943 2 254 3 470 3 101 4 227 4 149 4 044
Crude oil - 1 117 1 415 3 024 974 975 899 896
NGL - 826 839 446 39 35 33 30
Othe
r
- - - - 2 088 3 217 3 217 3 118
+ Net imports 128 811 111 782 112 582 85 602 91 204 90 264 87 560 83 781
Crude oil, NGL, othe
r
134 920 115 635 113 557 75 274 81 224 83 305 71 760 64 286
Oil products -6 109 -3 853 - 975 10 328 9 980 6 959 15 800 19 495
- Intl. marine bunkers 5 503 4 889 4 100 2 614 3 015 2 634 2 628 2 549
+ Stock changes -3 851 5 008 -2 356 243 450 408 577 927
TOTAL SUPPLY 121 523 113 844 108 380 86 701 91 740 92 265 89 658 86 203
Refinery intake 134 215 119 450 116 317 78 859 87 908 90 840 80 717 74 130
Refinery output 133 792 118 583 115 717 78 333 87 171 90 165 80 055 73 415
LPG + ethane 2 740 2 943 3 133 2 543 2 478 2 784 2 418 2 099
Naphtha 5 034 5 716 4 349 3 480 5 033 5 408 4 586 5 042
Kerosenes 3 353 4 093 4 739 5 057 5 613 5 645 4 997 4 456
Gasolines 16 676 17 431 18 900 17 579 16 878 16 812 15 840 13 719
Gas/diesel oil 47 481 39 965 41 486 27 890 35 150 36 983 33 102 30 153
Fuel oil 46 397 38 162 33 900 12 363 11 441 11 415 9 483 9 197
Other products 12 111 10 273 9 210 9 421 10 578 11 118 9 629 8 749
- Refinery losse
s
423 867 600 526 737 675 662 715
+ Returns - 2 398 2 053 1 777 1 572 1 485 1 400 1 331
- Statistical differences 640 639 2 607 2 870 497 2 060 3 057 491
TOTAL CONSUMPTION 120 460 114 736 107 226 85 082 92 078 91 015 87 339 86 328
Transformation and energy 23 482 21 004 18 974 8 412 7 954 8 243 7 539 ..
Crude oil - - ---- - ..
LPG + ethane 361 343 335 125 245 226 251 ..
Gas/diesel oil 116 184 502 311 376 303 344 ..
Fuel oil 19 497 15 210 13 693 2 794 1 892 1 890 1 650 ..
Petroleum coke - - - 1 064 1 106 1 150 1 002 ..
Othe
r
3 508 5 267 4 444 4 118 4 335 4 674 4 292 ..
Transport 25 402 30 226 30 850 39 937 49 715 48 819 48 258 ..
Motor gasolin
e
15 772 17 487 17 666 18 193 9 723 8 910 8 573 ..
Gas/diesel oil 7 274 10 004 10 283 17 483 32 497 32 402 32 733 ..
Subtotal 23 046 27 491 27 949 35 676 42 220 41 312 41 306 ..
Aviation fuels 1 860 2 307 2 458 3 767 7 074 7 122 6 600 ..
Othe
r
496 428 443 494 421 385 352 ..
Industry 35 097 31 051 30 625 17 451 19 834 18 294 16 325 ..
Naphtha 4 945 4 259 4 825 4 779 6 625 6 058 4 718 ..
LPG + ethane 605 558 883 1 015 1 951 2 034 1 897 ..
Gas/diesel oil 6 284 6 269 6 731 2 623 3 060 2 886 2 721 ..
Fuel oil 15 350 13 335 12 418 3 363 1 333 1 103 997 ..
Othe
r
7 913 6 630 5 768 5 671 6 865 6 213 5 992 ..
Other 36 479 32 455 26 777 19 282 14 575 15 659 15 217 ..
Gas/diesel oil 31 969 26 113 21 879 15 331 11 878 12 840 12 385 ..
Fuel oil 2 638 4 039 2 410 1 629 478 588 605 ..
Othe
r
1 872 2 303 2 488 2 322 2 219 2 231 2 227 ..
Memo: Non-energy use 13 210 12 829 13 083 12 864 14 829 13 411 11 969 ..
Chem/petchem. feedst. 8 465 6 456 7 122 6 676 8 662 7 650 6 574 ..
Other 4 745 6 373 5 961 6 188 6 167 5 761 5 395 ..
1. Includes inputs from other sources.
Source: Annual Oil Statistics.
INTERNATIONAL ENERGY AGENCY

OIL INFORMATION (2011 Edition) - III.213
FRANCE
Table 2: Supply of crude oil, NGL, feedstocks and other hydrocarbons
000 metric tons
1973 1978 1980 1990 2007 2008 2009 2010e
CRUDE OIL
Indigenous productio
n
- 1 117 1 415 3 024 974 975 899 896
+ Imports - 115 635 109 495 69 566 81 000 82 721 71 404 64 138
- Exports - - ---- - -
- Direct use - - ---- - -
+ Stock change - 1 707 - 279 - 308 540 - 2 403 534
- Statistical differences - 1 316 509 747 164 27 575 117
Refinery intake - 117 143 110 122 71 535 82 350 83 667 72 131 65 451
Closing stock level - 7 626 8 935 4 621 7 534 7 536 7 133 6 599
NATURAL GAS LIQUIDS
Indigenous productio
n
- 826 839 446 39 35 33 30
+ Imports - - ---- 35 -
- Exports - - ---- - -
- Direct use - 826 839 446 17 14 13 12
+ Stock change - - ---- - -
- Statistical differences - - - - 22 21 20 18
Refinery intake - - - - - - 35 -
Closing stock level - - - - - - - -
REFINERY FEEDSTOCKS
Backflows - 2 307 1 977 1 717 1 507 1 425 1 345 1 271
+ Transfers - - - 92 2 575 2 859 4 554 4 934
+ Imports - - 4 062 6 007 151 519 249 68
- Exports - - - 299 - - - -
+ Stock change - - - 331 - 104 - 316 67 26 66
- Statistical differences - - - 487 89 - 191 - 307 - 329 - 556
Refinery intake - 2 307 6 195 7 324 4 108 5 177 6 503 6 895
Closing stock level - 270 539 1 984 1 899 1 832 1 806 1 740
OTHER HYDROCARBONS
Indigenous productio
n
- - - - 2 088 3 217 3 217 3 118
+ Imports - - - - 93 124 188 162
- Exports - - - - 20 59 116 82
- Direct use - - - - 709 1 263 1 238 1 418
+ Stock change - - - - - 2 - 23 - 8 2
- Statistical differences - - - - - - - 5 - 2
Refinery intake - - - - 1 450 1 996 2 048 1 784
Closing stock level - - - - 70 93 101 99
CRUDE OIL, NGL, FEEDSTOCKS AND OTHER
Indigenous productio
n
2 066 1 943 2 254 3 470 3 101 4 227 4 149 4 044
+ Backflows - 2 307 1 977 1 717 1 507 1 425 1 345 1 271
+ Transfers - - - 92 2 575 2 859 4 554 4 934
+ Imports 134 920 115 635 113 557 75 573 81 244 83 364 71 876 64 368
- Exports - - - 299 20 59 116 82
- Direct use 812 826 839 446 726 1 277 1 251 1 430
+ Stock change -1 959 1 707 - 610 - 412 222 42 421 602
- Statistical differences - 1 316 22 836 - 5 - 259 261 - 423
Refinery intake 134 215 119 450 116 317 78 859 87 908 90 840 80 717 74 130
Closing stock level 6 829 7 896 9 474 6 605 9 503 9 461 9 040 8 438
Source: Annual Oil Statistics.
INTERNATIONAL ENERGY AGENCY

III.214 - OIL INFORMATION (2011 Edition)
FRANCE
Table 3: Motor gasoline - supply
000 metric tons
1973 1978 1980 1990 2007 2008 2009 2010e
MOTOR GASOLINE
Refinery output 16 633 17 389 18 870 17 482 16 832 16 756 15 801 13 679
+ Imports 431 364 645 4 396 661 735 603 871
- Exports 1 530 1 752 1 734 2 972 6 435 8 616 6 565 5 754
+ Transfers 406 412 393 208 193 485 326 550
+ Stock change - 274 542 131 - 402 - 306 379 8 57
- Statistical differences - 106 - 632 559 481 1 206 812 1 588 1 350
Total consumption 15 772 17 587 17 746 18 231 9 739 8 927 8 585 8 053
Closing stock level - 3 138 3 641 3 100 2 305 1 926 1 918 1 861
Table 4: Aviation fuels - supply
000 metric tons
1973 1978 1980 1990 2007 2008 2009 2010e
AVIATION GASOLINE
Refinery output 43 42 30 97 46 56 39 40
+ Imports 29 17 17 8 3 - 3 13
- Exports - - 1 68 36 38 28 20
+ Transfers - - ---- - -
+ Stock change - 3 - - - 2 8 - 10 11 - 5
- Statistical differences 21 23 15 3 - 2 - 13 - 1 6
Total consumption 48 36 31 32 23 21 26 22
Closing stock level - 5 7 18 3 13 2 7
GASOLINE TYPE JET FUEL
Refinery output - - - - - - - -
+ Imports - - ---- - -
- Exports - - ---- - -
+ Transfers - - ---- - -
+ Stock change - - ---- - -
- Statistical differences - - - - - - - -
Total consumption - - - - - - - -
Closing stock level - - - - - - - -
KEROSENE TYPE JET FUEL
Refinery output 3 319 4 002 4 603 4 997 5 536 5 571 4 944 4 359
+ Imports 4 32 - 945 3 455 3 615 3 915 3 918
- Exports 626 1 033 1 187 782 1 436 1 275 1 682 1 140
+ Transfers - - ---- - -
+ Stock change - 70 36 - 56 - 103 186 - 147 126 121
- Statistical differences 815 766 933 1 322 689 662 727 639
Total consumption 1 812 2 271 2 427 3 735 7 052 7 102 6 576 6 619
Closing stock level - 252 479 664 1 118 1 265 1 139 1 018
Source: Annual Oil Statistics.
INTERNATIONAL ENERGY AGENCY

OIL INFORMATION (2011 Edition) - III.215
FRANCE
Table 5A: Gas/diesel oil - supply and consumption
000 metric tons
1973 1978 1980 1990 2007 2008 2009 2010e
Refinery output 47 481 39 965 41 486 27 890 35 150 36 983 33 102 30 153
+ Recycled products - - - - 5 5 5 -
+ Imports 2 648 3 446 3 578 11 185 14 597 15 582 19 155 20 827
- Exports 4 363 4 118 3 055 3 911 3 422 3 565 2 573 2 513
- Intl. marine bunkers 720 798 529 311 190 197 180 195
+ Transfers 34 37 46 - 49 533 792 925 477
+ Stock changes 693 2 950 -2 274 146 319 329 - 184 74
- Statistical differences 130 -1 088 - 143 - 798 - 819 1 498 2 067 794
Total consumption 45 643 42 570 39 395 35 748 47 811 48 431 48 183 48 029
Transformation 116 163 483 311 332 280 303 ..
Main activity producer electricity 116 57 29 16 66 71 76 ..
Autoproducer electricity - - - 7 20 14 16 ..
Main activity producer CHP - - - - 1 1 1 ..
Autoproducer CHP - - - - 1 2 2 ..
Main activity producer heat - - - - - - - ..
Autoproducer heat - - - - - - - ..
Petrochemical industry - 106 454 288 244 192 208 ..
Other transformation - - - - - - - ..
Energy industry own use - 21 19 - 44 23 41 ..
Refinery fuel - 21 19 - 44 23 41 ..
Other energy industry - - - - - - - ..
Final consumption 45 527 42 386 38 893 35 437 47 435 48 128 47 839 ..
Transport
7 274 10 004 10 283 17 483 32 497 32 402 32 733 ..
Aviation - - - - - - - ..
Road 5 977 8 225 9 097 17 057 32 246 32 144 32 492 ..
Rail 646 614 580 380 191 198 181 ..
Domestic navigation 651 1 165 606 46 60 60 60 ..
Non-specified - - - - - - - ..
Industry
6 284 6 269 6 731 2 623 3 060 2 886 2 721 ..
Iron and steel 213 130 140 31 17 13 6 ..
Chemical (incl. pet.-chem.) 580 587 1 421 1 033 1 738 1 285 1 273 ..
Non-ferrous metals 31 10 - 25 7 7 6 ..
Non-metallic minerals 680 239 - 194 33 38 32 ..
Transport equipment - - - 71 14 10 7 ..
Machinery - - - 163 53 49 38 ..
Mining and quarrying - - - 31 84 95 93 ..
Food and tobacco - - - 109 74 60 39 ..
Pulp, paper and printing 81 72 - 21 11 10 8 ..
Wood and wood products - - - - 22 19 15 ..
Construction - - - 708 965 1 271 1 185 ..
Textiles and leather - - - 71 7 9 6 ..
Non-specified 4 699 5 231 5 170 166 35 20 13 ..
Other
31 969 26 113 21 879 15 331 11 878 12 840 12 385 ..
Commerce and public 29 548 23 696 19 479 4 220 3 053 3 488 3 426 ..
Residential - - - 8 193 5 591 6 038 5 804 ..
Agriculture (incl. fishing) 2 421 2 417 2 400 2 918 2 938 3 030 2 930 ..
Non-specified - - - - 296 284 225 ..
Memo: Non-energy use 580 693 1 875 1 321 1 982 1 477 1 481 ..
Chem/petchem. feedst. 580 587 1 421 1 033 1 738 1 285 1 273 ..
Other - 106 454 288 244 192 208 ..
Closing stock level - 9 186 12 362 5 662 8 795 8 466 8 650 8 576
Source: Annual Oil Statistics.
INTERNATIONAL ENERGY AGENCY

III.216 - OIL INFORMATION (2011 Edition)
FRANCE
Table 5B: Fuel oil (residual) - supply and consumption
000 metric tons
1973 1978 1980 1990 2007 2008 2009 2010e
Refinery output 46 397 38 162 33 900 12 363 11 441 11 415 9 483 9 197
+ Recycled products - - - - 30 27 25 24
+ Imports 1 902 2 091 3 402 398 5 764 6 335 6 884 6 966
- Exports 3 760 3 529 5 035 3 108 7 728 7 526 5 957 6 563
- Intl. marine bunkers 4 760 4 064 3 509 2 262 2 793 2 408 2 423 2 333
+ Transfers - 62 97 - 42 -2 575 -2 859 -4 554 -4 531
+ Stock changes -2 243 - 361 476 424 - 8 34 38 187
- Statistical differences - - 233 800 - 18 428 1 437 244 67
Total consumption 37 536 32 594 28 531 7 791 3 703 3 581 3 252 2 880
Transformation 16 096 11 908 10 599 1 657 1 052 1 033 908 ..
Main activity producer electricity 16 089 10 636 9 592 1 173 789 778 714 ..
Autoproducer electricity - 1 269 1 007 484 106 102 65 ..
Main activity producer CHP - - - - 5 4 4 ..
Autoproducer CHP - - - - 152 149 125 ..
Main activity producer heat - - - - - - - ..
Autoproducer heat - - - - - - - ..
Petrochemical industry - - - - - - - ..
Other transformation 7 3 - - - - - ..
Energy industry own use 3 401 3 302 3 094 1 137 840 857 742 ..
Refinery fuel 3 401 3 302 3 094 1 043 840 857 742 ..
Other energy industry - - - 94 - - - ..
Final consumption 18 039 17 384 14 838 4 997 1 811 1 691 1 602 ..
Transport
51 10 10 5 - - - ..
Aviation - - - - - - - ..
Road - - - - - - - ..
Rail 29 7 4 3 - - - ..
Domestic navigation 22 3 3 2 - - - ..
Non-specified - - 3 - - - - ..
Industry
15 350 13 335 12 418 3 363 1 333 1 103 997 ..
Iron and steel 2 450 1 882 1 190 160 6 2 - ..
Chemical (incl. pet.-chem.) 2 000 2 262 2 361 614 317 244 264 ..
Non-ferrous metals 540 441 370 136 41 36 29 ..
Non-metallic minerals 741 678 599 625 491 452 388 ..
Transport equipment 485 485 297 109 13 8 11 ..
Machinery - - - 76 15 12 8 ..
Mining and quarrying 480 226 237 59 9 9 8 ..
Food and tobacco 2 430 2 288 2 429 783 291 223 196 ..
Pulp, paper and printing 1 340 1 116 1 341 416 89 72 61 ..
Wood and wood products 155 120 - - 7 5 3 ..
Construction 3 315 2 880 2 056 148 - - - ..
Textiles and leather 1 335 947 498 156 18 14 8 ..
Non-specified 79 10 1 040 81 36 26 21 ..
Other
2 638 4 039 2 410 1 629 478 588 605 ..
Commerce and public 2 473 3 713 2 231 546 e 100 124 123 ..
Residential - - - 984 e 326 409 429 ..
Agriculture (incl. fishing) 165 326 179 99 40 40 40 ..
Non-specified - - - - 12 15 13 ..
Memo: Non-energy use - - - - - - - ..
Chem/petchem. feedst. - - - - - - - ..
Other - - - - - - - ..
Closing stock level - 4 289 4 615 1 269 1 527 1 493 1 455 1 268
Source: Annual Oil Statistics.
INTERNATIONAL ENERGY AGENCY

OIL INFORMATION (2011 Edition) - III.217
FRANCE
Table 5C: Total products - supply and consumption
000 metric tons
1973 1978 1980 1990 2007 2008 2009 2010e
Refinery output 133 792 118 583 115 717 78 333 87 171 90 165 80 055 73 415
+ Recycled products - 91 76 60 65 60 55 60
+ Imports 7 336 9 303 12 678 24 446 36 009 36 056 38 931 41 241
- Exports 13 445 13 156 13 653 14 118 26 029 29 097 23 131 21 746
- Intl. marine bunkers 5 503 4 889 4 100 2 614 3 015 2 634 2 628 2 549
+ Transfers 812 826 839 354 -1 849 -1 582 -3 303 -3 504
+ Stock changes -1 892 3 301 -1 746 655 228 366 156 325
- Statistical differences 640 - 677 2 585 2 034 502 2 319 2 796 914
Total consumption 120 460 114 736 107 226 85 082 92 078 91 015 87 339 86 328
Transformation 16 845 14 488 12 763 3 582 3 087 2 949 2 652 ..
Main activity producer electricity 16 255 10 693 9 621 1 189 974 911 854 ..
Autoproducer electricity - 1 269 1 007 515 154 145 113 ..
Main activity producer CHP - - - - 6 5 5 ..
Autoproducer CHP - - - - 322 313 257 ..
Main activity producer heat - - - - - - - ..
Autoproducer heat - - - - - - - ..
Petrochemical industry - 2 307 1 977 1 717 1 507 1 425 1 345 ..
Other transformation 590 219 158 161 124 150 78 ..
Energy industry own use 6 637 6 516 6 211 4 830 4 867 5 294 4 887 ..
Refinery fuel 6 637 6 516 6 211 4 736 4 867 5 294 4 887 ..
Other energy industry - - - 94 - - - ..
Final consumption 96 978 93 732 88 252 76 670 84 124 82 772 79 800 ..
Transport
25 402 30 226 30 850 39 937 49 715 48 819 48 258 ..
Aviation 1 860 2 307 2 458 3 782 7 089 7 137 6 615 ..
Road 22 194 26 124 27 014 35 505 42 138 41 187 41 165 ..
Rail 675 621 584 394 195 202 185 ..
Domestic navigation 673 1 174 791 256 293 293 293 ..
Non-specified - - 3 - - - - ..
Industry
35 097 31 051 30 625 17 451 19 834 18 294 16 325 ..
Iron and steel 2 755 2 022 1 330 359 43 35 27 ..
Chemical (incl. pet.-chem.) 10 679 8 825 9 565 7 768 11 605 10 332 8 919 ..
Non-ferrous metals 571 658 609 566 59 54 41 ..
Non-metallic minerals 1 429 1 033 736 1 443 1 437 1 338 1 144 ..
Transport equipment 485 485 297 180 39 30 30 ..
Machinery - - - 239 170 165 126 ..
Mining and quarrying 480 226 237 90 105 115 111 ..
Food and tobacco 2 430 2 288 2 574 1 032 475 389 317 ..
Pulp, paper and printing 1 421 1 188 1 341 437 116 99 83 ..
Wood and wood products 155 120 - - 38 31 23 ..
Construction 6 710 5 747 4 829 3 868 4 432 4 586 4 346 ..
Textiles and leather 1 335 947 498 227 35 33 20 ..
Non-specified 6 647 7 512 8 609 1 242 1 280 1 087 1 138 ..
Other
36 479 32 455 26 777 19 282 14 575 15 659 15 217 ..
Commerce and public 32 021 27 409 21 910 5 022 3 584 4 097 4 043 ..
Residential 1 665 1 952 1 907 10 708 7 312 7 800 7 615 ..
Agriculture (incl. fishing) 2 793 3 094 2 960 3 552 3 359 3 452 3 306 ..
Non-specified - - - - 320 310 253 ..
Memo: Non-energy use 13 210 12 829 13 083 12 864 14 829 13 411 11 969 ..
Chem/petchem. feedst. 8 465 6 456 7 122 6 676 8 662 7 650 6 574 ..
Other 4 745 6 373 5 961 6 188 6 167 5 761 5 395 ..
Closing stock level - 19 142 23 302 11 745 14 827 14 461 14 305 13 980
Source: Annual Oil Statistics.
INTERNATIONAL ENERGY AGENCY