Hull J.C. Risk management and Financial institutions
Подождите немного. Документ загружается.


Model Risk and Liquidity Risk
353
One danger in model building is Overfitting. Consider the problem
posed by the volatility surface in Table 15.1. We can exactly match the
volatility surface with a single model by extending Black-Scholes so that
volatility is a complex function of the underlying asset price and time.
7
But when we do this, we may find that other properties of the model are
less reasonable than those of simpler models. In particular, the joint
probability of the asset prices at two or more times may be unrealistic.
8
Another danger in model building is Overparameterization. The Black-
Scholes model can be extended to include features such as a stochastic
volatility or jumps in the asset price. This invariably introduces extra
parameters that have to be estimated. It is usually claimed that the
parameters in complex models are more stable those in simpler models
and do not have to be adjusted as much from day to day. This may be
true, but we should remember that we are not dealing with physical
processes. The parameters in a complex model may remain relatively
constant for a period of time and then change, perhaps because there
has been what economists refer to as a regime shift. A financial institution
may find that a complicated model is an improvement over a simple
model until the parameters change. At that time it may not have the
flexibility to cope with changing market conditions.
As we have mentioned, traders like simple models that have just one
unobservable parameter. They are skeptical of more complex models
because they are "black boxes" and it is very difficult to develop intuition
about them. In some situations their skepticism is well founded for the
reasons we have just mentioned.
15.6 DETECTING MODEL PROBLEMS
The risk management function within a financial institution should care-
fully monitor the financial institution's trading patterns. In particular it
7
This is the implied volatility function model proposed by B. Dupire, "Pricing with a
Smile," Risk, 7 (February 1994), 18-20; E. Derman and I. Kani, "Riding on a Smile,"
Risk, 7 (February 1994), 32-39; M. Rubinstein, "Implied Binomial Trees," Journal of
Finance, 49, 3 (July 1994), 771-818.
8
Instruments such as barrier options and compound options depend on the joint
Probability distribution of the asset price at different times. Hull and Suo find that the
implied volatility function model works reasonably well for compound options, but
sometimes gives serious errors for barrier options. See J. C. Hull and W. Suo, "A
Methodology for the Assessment of Model Risk and its Application to the Implied
Volatility Function Model," Journal of Financial and Quantitative Analysis, 37, 2 (June
2002), 297-318.

354
Chapter 15
should keep track of the following:
1. The type of trading the financial institution is doing with other
financial institutions
2. How competitive it is in bidding for different types of structured
transactions
3. The profits being recorded from the trading of different products
Getting too much of a certain type of business or making huge profits
from relatively simple trading strategies can be a warning sign. Another
clear indication that something is wrong is when the financial institution
is unable to unwind trades at close to the prices given by its computer
models.
The high profits being recorded for Joseph Jett's trading at Kidder
Peabody (see Business Snapshot 15.1) should have been a warning sign.
9
Furthermore, if in the mid-1990s a financial institution's risk manage-
ment team discovered that traders were entering into a large number of
LIBOR-in-arrears swaps with other financial institutions (see Business
Snapshot 15.2) where they were receiving fixed and paying floating, they
could have alerted modelers to a potential problem and directed that
trading in the product be temporarily stopped.
There are other ways in which a derivatives dealer might find that one of
its models is out of line with that used by other market participants.
Dealers often subscribe to services that are designed to provide market
quotes for representative trades. Typically the company providing this
service periodically asks its dealer clients for quotes on specific hypo-
thetical transactions. It then averages the quotes (possibly after eliminating
the highest and lowest) and feeds the results back to the dealers.
15.7 TRADITIONAL VIEW OF LIQUIDITY RISK
Liquidity is liable to affect both the funding and trading activities of a
financial institution. We start by considering trading activities and move
on to consider funding activities in Section 15.10.
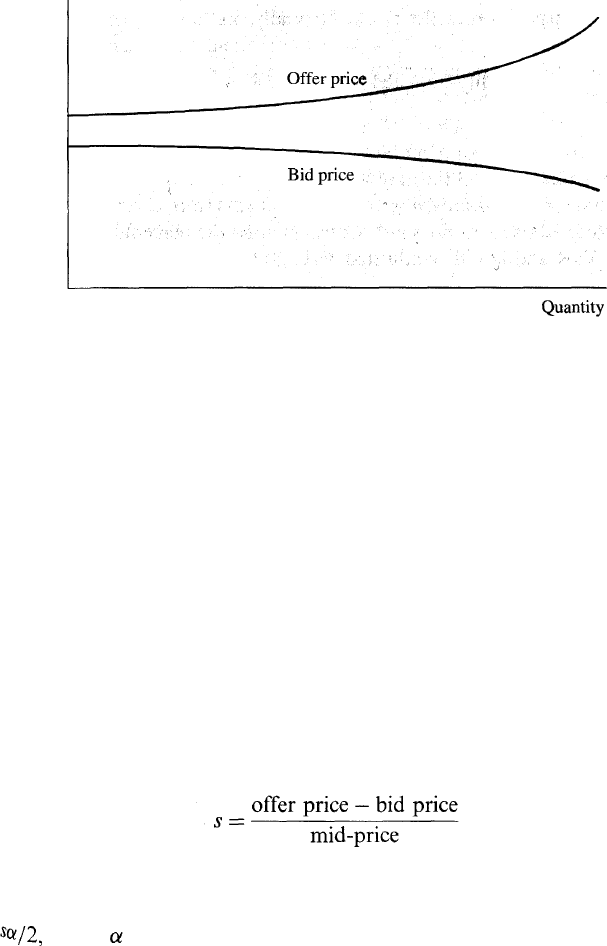
The traditional view of liquidity risk in trading is that there is a
relationship between price and quantity. This relationship is shown in
Figure 15.3. When the quantity of an asset that is traded is relatively
9
Barry Finer, risk manager for the government bond desk at Kidder Peabody, did point
out the difficulty of making large arbitrage profits from a market as efficient as the US
government bond market, but his concerns were dismissed out of hand.
Model Risk and Liquidity Risk
355
Figure 15.3 Bid and offer prices as a function of quantity
transacted.
small, bid-offer spreads are low. As the quantity increases, the price paid
by the buyer of the asset increases and the price received by the seller of
the asset decreases.
How can a financial institution manage liquidity in the trading book?
One way is by using position limits. If the size of the financial institution's
position is limited, the size of a trade it has to do to unwind a position is
also limited. It is often argued that the time horizon in a VaR calculation
should reflect the time necessary to unwind a position. If a position can
be unwound very quickly, a one-day time horizon is appropriate; in other
circumstances, time horizons as long as one month may be needed.
Liquidity-Adjusted VaR
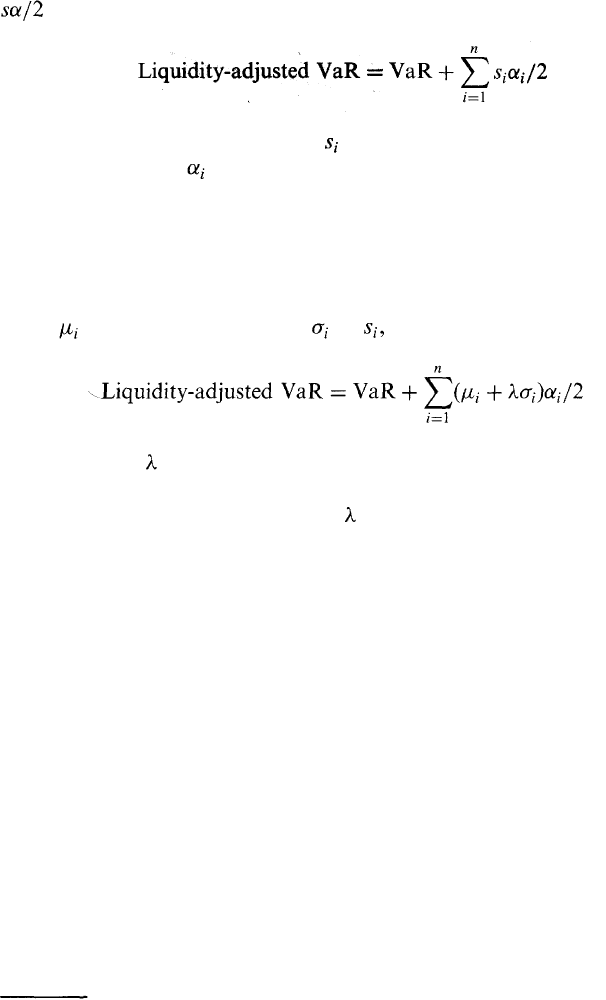
The percentage bid-offer spread for an asset can be defined as
where the mid-price is halfway between the bid and the offer. In liquidat-
ing a position in the asset, a financial institution incurs a cost equal to
where is the dollar value of the position. This reflects the fact that
trades are not done at the mid-market price. A buy trade is done at a
Proportional amount s/2 above the market price and a sell trade is done
at a proportional amount s/2 below the market price.
Risk managers sometimes calculate a liquidity-adjusted VaR by adding
356
Chapter 15
for each position in the book. Formally, we have
where n is the number of positions, is the percentage bid-offer spread for
the ith position and is the amount of money invested in the ith position.
As the number of positions, n, grows, VaR benefits from diversification but
the liquidity adjustment does not. Consequently, the percentage difference
between VaR and liquidity-adjusted VaR grows as n grows.
A variation on this calculation that takes account of uncertainty in the
spread has been suggested by Bangia et al.
10
This involves estimating the
mean and standard deviation of and defining
The parameter gives the required confidence level for the spread on the
assumption that spreads are normally distributed. For example, if a 95%
confidence level is required, then = 1.64. Bangia et al.'s equation
assumes (conservatively) that spreads in all instruments are perfectly
correlated.
15.8 LIQUIDITY BLACK HOLES
The liquidity risk we have just described is real. Banks cannot trade at
mid-market prices and the bigger the size of their transaction the higher
the bid-offer spread that they face. However, there is a more serious
liquidity risk. This is the risk that liquidity in a particular market will dry
up completely because everyone wants to buy and no-one wants to sell, or
vice versa.
It is sometimes argued that technological and other developments have
led to a steady improvement in the liquidity of financial markets. This is
questionable. It is true that bid-offer spreads have on average declined.
However, there has been an increasing tendency toward "herd behavior
where almost everyone wants to do the same type of trade at particular
10
See A. Bangia, F. Diebold, T. Schuermann, and J. Stroughair, "Liquidity on the
Outside," Risk, 12 (June), 68-73.

Model Risk and Liquidity Risk 357
times. The result has been what Persaud refers to as "liquidity black
holes" occurring with increasing frequency.
11
In a well-functioning market, the market may change its opinion about
the price of an asset because of new information. However, the price does
not overreact. If a price decrease is too great, traders will quickly move in
and buy the asset and a new equilibrium price will be established. A
liquidity black hole is created when a price decline causes more market
participants to want to sell, driving prices well below where they will
eventually settle. During the sell-off, liquidity dries up and the asset can
be sold only at a fire-sale price.
12
Among the reasons for herd behavior and the creation of liquidity
black holes are:
1. The computer models used by different traders are similar.
2. All financial institutions are regulated in the same way and respond
in the same way to changes in volatilities and correlations.
3. There is a natural tendency to feel that if other people are doing a
certain type of trade then they must know something that you do not.
Computer Models
A classic example of computer models causing a liquidity black hole is
the stock market crash of October 1987. In the period leading up to the
crash, the stock market had performed very well. Increasing numbers of
portfolio managers were using commercially available programs to
synthetically create put options on their portfolios. These programs told
them to sell part of their portfolio immediately after a price decline and
buy it back immediately after a price increase. The result, as indicated in
Business Snapshot 15.4, was prices plunging well below their long-run
equilibrium levels on October 19, 1987.
As another example of computer models leading to liquidity black
holes, consider the situation where financial institutions are on one side
of the market for a derivative and their clients are on the other side. When
the price of the underlying asset moves, all financial institutions execute
the same trades to maintain a delta-neutral position. This causes the price
of the asset to move further in the same direction. An example of this is
outlined in Business Snapshot 15.5.
11
See A. D. Persaud (ed.), Liquidity Black Holes: Understanding, Quantifying and
Managing Financial Liquidity Risk, Risk Books, 1999.
12
Liquidity black holes tend to be associated with price decreases, but it is possible for
thern to occur when there are price increases.
\

358 Chapter 15
The Impact of Regulation
In many ways it is a laudable goal on the part of regulators to seek to
ensure that banks and other financial institutions throughout the world
are regulated in the same way. As we explained in Chapter 7, capital
requirements and the extent to which they were enforced varied from
country to country prior to Basel I. Banks were competing globally and
as a result a bank subject to low capital requirements, or capital require-
ments that were not strictly enforced, had a competitive edge.
However, a uniform regulatory environment comes with costs. All
banks tend to respond in the same way to external events. Consider,
for example, market risk. When volatilities and correlations increase,
market VaR and the capital required for market risks increase. As a
result, banks tend to take steps to reduce their exposures. Since banks
Business Snapshot 15.4 The Crash of 1987
On Monday, October 19, 1987, the Dow J ones Industrial Average dropped by
more than 20%. Portfolio insurance played a major role in this crash. In
October 1987 between $60 billion and $90 billion of equity assets were subject
to portfolio insurance schemes where put options were created synthetical
using a type of "stop-loss" trading strategy.
During the period Wednesday, October 14, 1987, to Friday, October
1987, the market declined by about 10%, with much of this decline take
place on Friday afternoon. The portfolio insurance schemes should have
generated at least $12 billion of equity or index futures sales as a result
this decline. In fact, portfolio insurers had time to sell only $4 billion and then
approached the following week with huge amounts of selling already dictated
by their models. It is estimated that, on Monday, October 19, sell programs
three portfolio insurers accounted for almost 10% of the sales on the New
York Stock Exchange, and that portfolio insurance sales amounted to 21.3%
of all sales in index futures markets. It is likely that the decline in equity pri???
was exacerbated by investors other than portfolio insurers selling heavily
anticipation of the actions of portfolio insurers.
As the market declined so fast and the stock exchange systems were over-
loaded, many portfolio insurers were unable to execute the trades generated
their models and failed to obtain the protection they required. Needless to say ,
the popularity of portfolio insurance schemes has declined significantly since
1987. One of the morals of this story is that it is dangerous to follow a
particular trading strategy—even a hedging strategy—when many other mar-
ket participants are doing the same thing.

Model Risk and Liquidity Risk
359
often have similar positions to each other, they try to do similar trades. A
liquidity black hole can then develop.
Consider next credit risk. During the low point of the economic cycle,
default probabilities are relatively high and capital requirements for loans
under the Basel II internal ratings based models tend to be high. As a
result banks may be less willing to make loans, creating a liquidity black
hole for small and medium-sized businesses. The Basel Committee has
recognized this as a problem and has dealt with it by asserting that the
probability of default should be an average of the probability of default
through the economic or credit cycle, rather than an estimate applicable
to one particular point in time.
The Importance of Diversity
Economic models usually assume that market participants act independ-
ently. We have argued that this is often not the case. It is this lack of
independence that causes liquidity black holes. To solve the problem of
liquidity black holes, we need more diversity in financial markets.
One conclusion from the arguments we have put forward is that a
contrarian investment strategy has some merit. If markets overreact an
investor can do quite well by buying when everyone else is selling and
there is very little liquidity. However, it can be quite difficult for a fund to
follow such a strategy if it is subject to the VaR-based risk management
measures that have become standard.
Business Snapshot 15.5 British Insurance Companies
In the late 1990s, British insurance companies had entered into many contracts
promising that the rate of interest applicable to an annuity received by an
individual on retirement would be the greater of the market rate and a
guaranteed rate. At about the same time, largely because of regulatory
pressures, all insurance companies decided to hedge part of their risks on
these contracts by buying long-dated swap options from financial institutions.
The financial institutions they dealt with hedged their risks by buying large
numbers of long-dated sterling bonds. As a result, bond prices rose and
sterling long-term interest rates declined. More bonds had to be bought to
maintain the dynamic hedge, long-term sterling interest rates declined further,
and so on. Financial institutions lost money and, because long-term interest
rates declined, insurance companies found themselves in a worse position on
the risks that they had chosen not to hedge.
360
Chapter 15
Volatilities and correlations tend to be "mean reverting". They some-
times increase but over time they get pulled back to long-run average
levels. One way of creating diversity is to recognize in regulation and in
risk management practices that not all market participants should be
concerned about short-term changes in volatilities and correlations. Asset
managers, for example, should base their decisions on long-term average
volatilities and correlations. They should not join the herd when liquidity
holes develop.
Hedge Funds
Hedge funds have become important participants in financial markets in
recent years. A hedge fund is similar to a mutual fund in that it invests
money on behalf of clients. However, unlike mutual funds hedge funds
are not required to register under US federal securities law. This is
because they accept funds only from financially sophisticated individuals
and do not publicly offer their securities. Mutual funds are subject to
regulations requiring that shares in the funds be fairly priced, that the
shares be redeemable at any time, that investment policies be disclosed,
that the use of leverage be limited, that no short positions be taken, and
so on. Hedge funds are relatively free of these regulations. This gives them
a great deal of freedom to develop sophisticated, unconventional, and
proprietary investment strategies. The fees charged by hedge fund man-
agers are dependent on the fund's performance and are relatively high—
typically 1 to 2% of the amount invested plus 20% of the profits.
Hedge funds have grown in popularity with about $1 trillion being
invested throughout the world for clients in 2004. "Funds of funds" have
been set up to invest in a portfolio of other hedge funds. At the time of
writing, hedge funds are still largely unregulated. This means that they do
not have to assess risk in the same way as other financial institutions. As a
result, hedge funds are in an ideal position to provide liquidity when black
holes show signs of developing. If hedge funds are regulated in the future, it
is to be hoped that the regulations will not be the same as those applying to
other financial institutions.
15.9 LONG-TERM CAPITAL MANAGEMENT
Hedge funds themselves can run into liquidity problems and create or
exacerbate liquidity black holes. The most famous example here is Long-

Model Risk and Liquidity Risk
361
Term Capital Management (LTCM) which was discussed in Business
Snapshot 12.1.
LTCM's problems were exacerbated by the fact that its leverage was
huge. It had about $125 billion of assets (plus large numbers of off-
balance-sheet derivatives transactions such as swaps) and only $5 billion
of capital. It was unable to make the payments required under its Collater-
alization agreements. There was a great deal of concern about the ability of
the financial system to cope with a potential failure of LTCM. What
actually happened was a cash injection by a group of banks and an orderly
liquidation that led to a total loss of about $4 billion. If the fund had been
less highly leveraged, it would probably have been able to survive the flight
to quality and could have waited for the previous relationship between the
prices of the liquid and illiquid securities to resume.
Why was the flight to quality so large? One reason is that there were
rumors in the market that LTCM was experiencing financial difficulties.
These rumors led people to anticipate the sort of trades LTCM would
have to do to close out its positions and the likely effect of those trades on
market prices. When everyone anticipates that something will happen in
financial markets it tends to happen. Another reason is that LTCM had
been highly successful during the 1995 to 1997 period. As a result there
were many other hedge funds trying to imitate its strategy. These hedge
funds also experienced financial difficulties and tried to close out their
positions. This accentuated market movements.
15.10 LIQUIDITY vs. PROFITABILITY
Finally it should be noted that there can be liquidity problems without
profitability problems. For example, a profitable bank can experience a
run on deposits and run into liquidity problems. Banking is to a large
extent about confidence. A bank relies on the withdrawal of deposits
being roughly balanced by new deposits so that funding from liabilities
remains roughly constant (see Section 1.3). If there is a temporary short-
fall, it is handled by interbank borrowing.
13
However, if there is a loss of
confidence in the bank—however unjustified this might be—the bank is
liable to experience catastrophic liquidity problems.
Liquidity funding problems can be experienced by all sorts of com-
panies. We have all heard stories about profitable companies that for
13
Across the whole banking system the funds on deposit should remain roughly constant
as a withdrawal from one bank usually becomes a deposit with another bank.

362
Chapter 15
some reason "fell through the cracks" when trying to arrange venture
capital funding or bank loans. An extreme example of a liquidity funding
problem is provided by a German company, Metallgesellschaft, that
entered into profitable fixed-price oil and gas contracts with its customers
(see Business Snapshot 15.6).
Liquidity funding problems can in part be avoided by carrying out
scenario analyses and taking steps to avoid the possibility of outcomes
where short-term cash drains are difficult to fund.
SUMMARY
Since the publication of the Black-Scholes model in 1973 a huge amount
of effort has been devoted to the development of improved models for the
behavior of asset prices. It might be thought that it is just a matter of time
before the perfect model is produced. Unfortunately, this is not the case.
Models in finance are different from those in the physical sciences because
they are ultimately models of human behavior. They are always likely to
be at best approximations to the way market variables behave. Further-
more, from time to time there are regime shifts where there are funda-
mental changes in the behavior of market variables.
For products that trade actively, models are used primarily for com-
municating prices, interpolating between market prices, and hedging-
When hedging, traders use both within-model hedging and outside-model
hedging. This means that they hedge against movements in variables that
Business Snapshot 15.6 Metallgesellschaft
In the early 1990s, Metallgesellschaft (MG) sold a large volume of five- to
ten-year heating oil and gasoline fixed-price supply contracts to its customers
at 6 to 8 cents above market prices. It hedged its exposure with long positions
in short-dated futures contracts that were rolled forward. As it turned out, the
price of oil fell and there were margin calls on the futures positions. Con-
siderable short-term cash-flow pressures were placed on MG. Those at MG
who devised the hedging strategy argued that these short-term cash outflows
were offset by positive cash flows that would ultimately be realized on the
long-term fixed-price contracts. However, the company's senior management
and its bankers became concerned about the huge cash drain. As a result, the
company closed out all the hedge positions and agreed with its customers that
the fixed-price contracts would be abandoned. The outcome was a loss to
MG of $1.33 billion.