Hooke R.L. Principles of glacier mechanics
Подождите немного. Документ загружается.


Analysis of borehole-deformation data 341
this. Expanding Equation (12.44) for i = x and dividing by dλ yields
x
∂u
∂x
+
y
∂u
∂y
+
z
∂u
∂z
=
1
dλ
x
D
Dt
dλ + u
∂
x
∂x
+ ν
∂
x
∂y
+ w
∂
x
∂z
+
∂
x
∂t
(12.46)
Because the inclination of the casing is a function of z alone, ∂
x
/∂x = 0
and ∂
x
/∂y =0. Expanding the right-hand side of Equation (12.45), using
the result to replace the term involving D(dλ)/Dt in Equation (12.46),
and rearranging terms, we obtain:
x
∂u
∂x
+
y
∂u
∂y
+
z
∂u
∂z
−
x
x
x
∂u
∂x
−
x
x
y
∂u
∂y
−
x
x
z
∂u
∂z
−
x
y
x
∂v
∂x
−
x
y
y
∂v
∂y
−
x
y
z
∂v
∂z
−
x
z
x
∂w
∂x
−
x
z
y
∂w
∂y
−
x
z
z
∂w
∂z
=w
∂
x
∂z
+
∂
x
∂t
(12.47)
Using the summation convention, this can be written as
k
∂u
i
∂x
k
−
i
j
k
∂u
j
∂x
k
= w
∂
i
∂z
+
∂
i
∂t
or even more compactly as
(δ
ij
−
i
j
)
k
∂u
j
∂x
k
= w
∂
i
∂z
+
∂
i
∂t
(12.48)
Because i is not repeated in any of the terms in Equation (12.48), this
equation represents three separate equations (for i = x,y,z). However,
only two of these equations are independent because only two of the
direction cosines are independent.
If the inclination of a borehole is known at two separate times, and
if seven of the nine velocity derivatives in Equation (12.47) can be mea-
sured or estimated, Equations (12.48) can be solved for the two remain-
ing velocity derivatives. Equations (12.48) are exact, but approximations
have to be made in calculating the
i
, ∂
i
/∂t, and ∂
i
/∂z from observa-
tional data that are obtained at discrete points in time and space.
Two alternative approaches taken to this problem in two separate field
experiments on Barnes Ice Cap (Hooke, 1973b; Hooke and Hanson,
1986) are outlined in Table 12.2. Strain nets were placed around the
tops of the boreholes, so that some of the velocity derivatives could be
measured directly at the surface. Assumptions were then made about
how they varied with depth. In the first experiment, the boreholes were
closely spaced so ∂u/∂x could be determined, as a function of depth,
from the successive borehole profiles. As can be seen from Table 12.2,
the two velocity derivatives that were calculated were ∂u/∂z and ∂v/∂z.
One might expect that measurements of the rate of tilting of the borehole
would give these velocity derivatives directly, but this is not the case. Yet,

342 Applications of stress and deformation principles
Table 12.2. Calculation of velocity derivatives in borehole deformation studies of Hooke
(1973b) and Hooke and Hanson (1986)
Derivative 1973 1986
∂u/∂x Two boreholes We assumed that this
decreased with depth in
proportion to the decrease in
u with depth
∂u/∂y 0 (assumed) This was obtained from the
measured u at the surface
and the radius of curvature
of the flow line
∂v/∂x 0 (assumed) ˙ε
xy
was measured at the
surface and assumed to
decrease with depth in
proportion to the decrease in
u with depth. Then, from
Equation (9.21):
∂v/∂x = 2˙ε
xy
– ∂u/∂y
∂v/∂y This was measured at the surface, and we assumed that it decreased with
depth in proportion to the decrease in ∂u/∂x
∂w/∂z =−∂u/∂x – ∂v/∂y by continuity Same as 1973
∂w/∂z was then integrated over depth to obtain w as a function of depth,
using either a no slip boundary condition at the bed where temperatures are
well below the melting point, or the measured w at the surface
∂w/∂x Two boreholes This was measured at the
surface; we assumed that it
decreased with depth in
proportion to the decrease in
w with depth
∂w/∂y We set ˙ε
yz
=
1
2
∂ν
∂z
+
∂w
∂y
at
the surface, and let ∂w/∂y
decrease linearly with depth.
∂v/∂z was calculated (see
below), so an iterative procedure
was required
Same as ∂w/∂x
∂u/∂z,
∂v/∂z
These derivatives were then
calculated from Equations
(12.48)
Same as 1973
Analysis of borehole-deformation data 343
t
=
t
1
t
=
t
1
+
∆ t
w
z
1
z
2
z
1
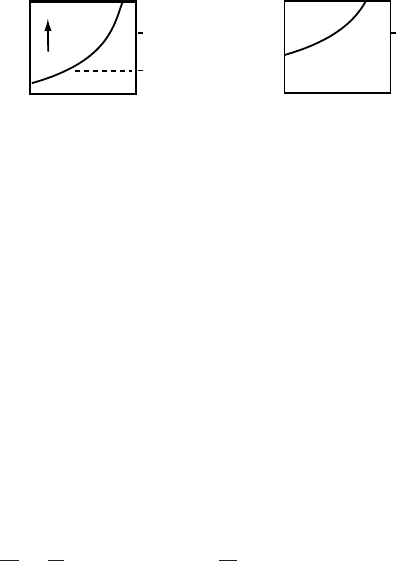
Figure 12.16. Effect of
vertical advection on borehole
inclination.
as one would expect and as implied by our opening discussion, ∂u/∂z is
one of the most important velocity derivatives.
Sensitivity studies suggest that the solutions obtained in these two
Barnes Ice Cap experiments do not depend strongly on the assumptions.
The most important term is ∂
i
/∂t.Ininstances where the casing bends
abruptly, as at joints, w ∂
i
/∂z also becomes important. In experiments on
other glaciers, the results might be more sensitive to some of the other
velocity derivatives, and hence to any assumptions made in obtaining
them.
Further insight into Equation (12.48) can be achieved by consider-
ing the situation in plane strain. Assuming incompressible flow and a
uniform longitudinal strain rate, r,wethen have ∂u/∂x =−∂w/∂z = r,
∂w/∂x = 0,
x
= sin θ,
z
= cos θ, and
y
= 0, where θ is the inclination
of the borehole from the vertical. Equation (12.48) then reduces to
∂u
∂z
=
∂
∂t
tan θ − 2r tan θ + w
∂
∂z
tan θ (12.49)
The first term on the right is the obvious one, involving a change in
inclination of the borehole with time. The second is the one illustrated
in Figure 12.12 and discussed earlier. The third is an advection effect.
In an area of non-zero vertical velocity, a section of a borehole at depth
z
2
, measured with respect to some constant datum, and with inclination
i
(z
2
) will, at the end of a time interval t,beat, say, depth z
1
(Figure
12.16). If the initial inclination of the borehole at depth z
1
was different
from
i
(z
2
), our measurements would show that the inclination at depth
z
1
had changed, and this would be true even if ∂u/∂z were 0. This is why
w ∂
i
/∂z becomes important near some joints, as just mentioned.
The results of the borehole deformation experiment reported by
Hooke and Hanson (1986) will be used to illustrate an application of
this analysis. Four boreholes, located approximately along a flowline on
Barnes Ice Cap (Figure 12.17), were drilled and cased and inclinom-
etry data were obtained from them over a period of up to four years.
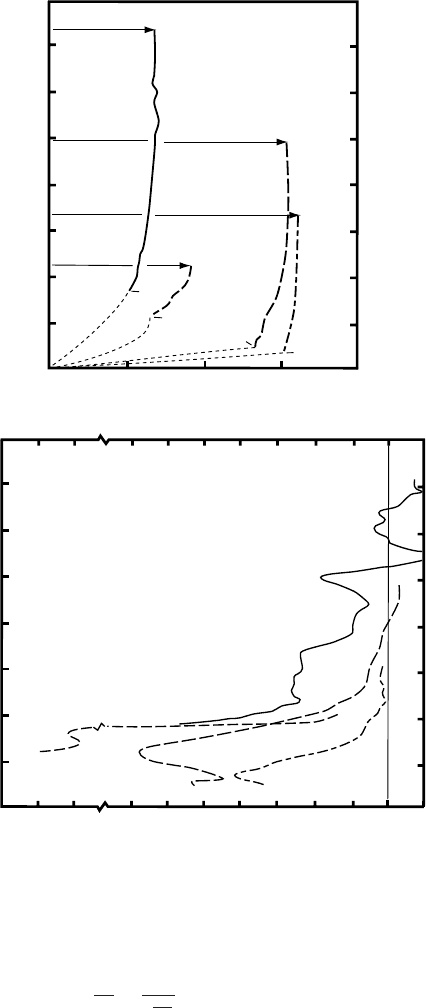
Figure 12.18a shows the deformation profiles, and Figure 12.18b shows
values of ∂u/∂z calculated from Equations (12.48).
The deformation profiles in most of the holes end at the top of a zone
of white ice (Figure 12.18a). Oxygen isotope data demonstrate that this
ice is of Pleistocene age (Hooke and Clausen, 1982). The ice is white
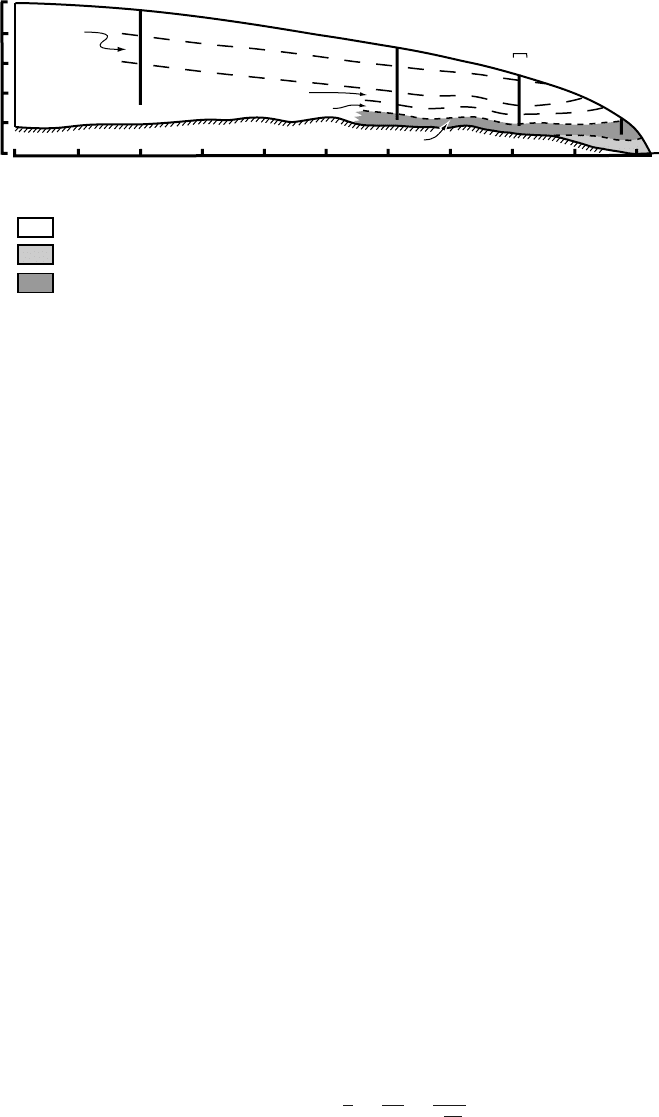
344 Applications of stress and deformation principles
Pleistocene bubbly white glacier ice
Holocene deformed superimposed ice
Holocene glacier ice
Distance from divide, km
Weakly-oriented
Broad single-maximum
Multiple maximum
Strong single maximum
Vertical exaggeration, 5x
Small
circle
T020
T061
T081
T0975
Equilibrium line
0
0
510
Two maximum
Figure 12.17. Longitudinal section along a flowline on Barnes Ice Cap showing
types of ice encountered in boreholes. The deformed superimposed ice near the
margin was overridden during an advance of the glacier (see Figure 5.17). (After
Hooke and Hanson, 1986, Figure 2. Reproduced with the kind permission of
Elsevier Science.)
because it contains a lot of air bubbles. As a result of these bubbles,
the density of this ice is only 870 kg m
−3
, compared with a density of
920 kg m
−3
in the overlying blue ice. We presume that the high concen-
tration of air bubbles is a result of two processes.
1. When the climate warmed at the end of the Pleistocene, meltwater
percolation increased, and ice lenses formed. These lenses trapped air
in the underlying porous firn.
2. As basal meltwater escaped into the underlying permeable bedrock,
air may have been left behind in a sort of physical fractionation pro-
cess.
As noted in Chapter 11 (p. 311), it is commonly found that such
Pleistocene ice is softer than Holocene ice, apparently because impurities
lead to smaller grain sizes that then develop strong single-maximum
fabrics (Paterson, 1991). The high strain rates implied by the dotted
extrapolations of the deformation profiles for holes T061 and T081 in
Figure 12.18a are indicative of this weakening. The value of B obtained
for this ice from the deformation profile in hole T0975 is 0.1 MPa a
1/3
(at −10.1
◦
C), which is much lower than those ranging from 0.23 to
0.30 MPa a
1/3
in the overlying blue Holocene ice in holes T061 and
T020 (Table 12.3) and also much lower than other experimental values
at this temperature (Figure 12.5).
Also of interest are the values of the parameter , defined by (see
Equation (9.29))
2 =
1
λ
=
σ
zx
˙ε
zx
=
B
˙ε
n−1
n
(12.50)
Analysis of borehole-deformation data 345
Height above bed, m
400
300
200
100
0
02468
Velocity, m a
−1
T020
Bot
Bot
Bot
Bot
T0975
T081
(a)
T061
Height above bed, m
(b)
400
300
200
100
0
−0.06 −0.02 −0.12 −0.006 0.0
∂u/∂z
T0975
T081
T020
T061
Bot = hole bottom
Figure 12.18. (a) Velocity
profiles in boreholes; and
(b) ∂u/∂z as a function of
depth. (After Hooke and
Hanson, 1986, Figure 3.
Reproduced with the kind
permission of Elsevier
Science.)
˙ε
zx
is obtained from the velocity derivatives (Table 12.2) using Equation
(9.21), while σ
zx
is estimated with the use of
σ
zx
=−ρghα −
∂
∂x
z
0
B
˙ε
n−1
n
(2˙ε
xx
+ ˙ε
yy
)dz − T (12.51)
which is derived from Equation (12.26)inmuch the same way that
we derived Equation (12.29)except that we now retain the T term and
also assume that changes in the transverse direction are negligible in an

346 Applications of stress and deformation principles
Table 12.3. Values of B in MPa a
−1/3
for different ice types
a
Borehole T0975 T081 T061 T020
Ice type
Weakly oriented — — 0.23 (−10.2) —
Broad single maximum
b
— 0.46 (−9.0)
c
0.26 (−8.4) 0.30 (−7.4)
Two maxima — 0.44 (−8.6) 0.24 (−7.5) 0.26 (−6.5)
Three or four maxima — 0.50 (−8.3) 0.30 (−6.8) —
White ice (clean) 0.10 (−10.1) 0.18
d
(−7.8) 0.10
d
(−6.4) —
0.18
e
(−7.8)
White ice (dirty) 0.13 (−9.8)
a
Values given are for zones in which fabric is well developed, and thus exclude transition regions.
b
Equivalent fabric in T020 is small circle.
c
Numbers in brackets are mean temperatures in
◦
C.
d
Velocity profile calculated by assuming no slip on the bed.
e
Measured over two weeks, starting three weeks after completion of hole in 1977. No smoothing
used in calculation.
ice cap. Equation (12.27)was used to evaluate the T term. If B and n
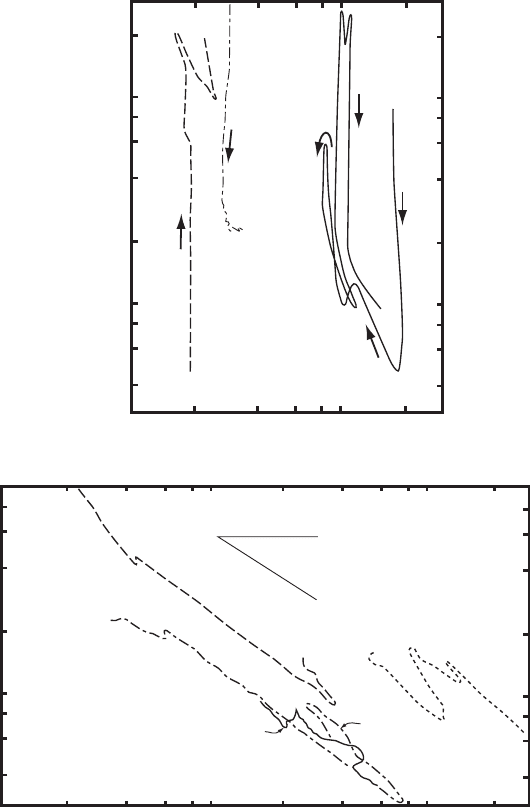
are constant, as might be expected, should vary inversely with ˙ε. The
awkward fact is that near the surface where ˙ε
zx
is low, this does not appear
to be the case. Figure 12.19a shows that is effectively independent of
˙ε.Even the direction of change of with depth is not consistent from
one hole to the next, as indicated by the arrows on the curves in Figure
12.19a. This problem is not unique to Barnes Ice Cap; Raymond (1973)
also found that was independent of ˙ε near the surface of Athabasca
Glacier.
Somewhat deeper in the glacier the situation improves, and
decreases steadily with increasing ˙ε (Figure 12.19b). Here, the slope
and intercept of the log –log ˙ε line can be used to determine B and
n (Equation (12.50)). In the present case, however, Hooke and Hanson
(1986) chose, instead, to assume that n = 3; they then calculated B as
a function of depth, and related changes in B to changes in crystallo-
graphic fabric. The results are shown in Table 12.3. Although there was
quite a lot of noise in the record, it appears that B is slightly lower in
fabrics containing only two maxima, and increases in fabrics with three
or four maxima. This stiffening can be seen at the bottoms of the defor-
mation profiles in Figure 12.18a.Itisconsistent with expectation, as it is
the third and fourth maxima in these multiple-maximum fabrics that are
inclined to the direction of shear (Figure 4.14f). In other words, the basal
planes of crystals with these orientations dip either up- or downglacier,
Analysis of borehole-deformation data 347
10
-3
10
-4
10
1
10
2
T081
Λ, MPa
Octahedral strain rate,
ε
o
,
a
-1
(a)
(b)
10
2
Λ, MPa
10
3
10
-3
10
-4
Octahedral strain rate,
ε
o
,
a
-1
10
1
10
2
n
=
1
n
=
3
T061
T020
T081
T061
T020
T061
T0975
(Scale to right)
Figure 12.19. Octahedral shear strain rate, ˙ε
o
, plotted against . (a) The
upper 50 m of holes T061 and T081, and the upper 150 m of hole T020. Arrows
show direction of increasing depth. (b) The lower parts of the holes. Depth
increases from upper left, following lines of points. Reversals in trends reflect
hardening of ice in zones where fabric is changing. (After Hooke and Hanson,
1986, Figure 4. Reproduced with the kind permission of Elsevier Science.)
348 Applications of stress and deformation principles
whereas the basal planes in the first two maxima that form dip in the
transverse direction (Figure 4.14e).
Values of B in hole T081 are nearly double those in the other holes.
Hooke and Hanson assumed that this was because stresses at this location
on the glacier were overestimated. However, they were unable to isolate
the apparently erroneous assumption that led to this error, even though
they undertook calculations with a finite-element model.
Summary
In this chapter we have studied four classical problems in glacier mechan-
ics: closure of cylindrical holes, calculation of force balances, creep of
ice shelves, and deformation of boreholes. As examples of applications
of the theory presented, we discussed problems such as the flow of water
to, from, and in subglacial conduits, the mechanics of glacier accelera-
tions, the stability of ice shelves, and the extraction of flow-law param-
eters from borehole deformation data. From these examples, we gained
insights into the dynamic and kinematic behavior of glaciers. These,
however, were secondary objectives.
The primary objective of the chapter was to help students develop
facility with the mathematics of stress and deformation as applied to
problems in glacier mechanics. Such analyses are complicated because
multiple stresses, strains, and strain rates are involved, and even more
so because the strains in which we are interested are a consequence of
deviatoric, not total stresses. In many cases, once the physics of a prob-
lem have been formulated, prescribed mathematical procedures must
be followed before a result with clear physical significance reappears.
Students who have mastered the material in this chapter will be able to
understand many papers in the glaciological literature that would other-
wise be impenetrable.

Chapter 13
Finite strain and the origin of foliation
Suppose one were to drop a deformable sphere into the accumulation
area of a glacier. As the sphere became buried deeper and deeper in the
glacier, it would be deformed by the flow. Because the accumulation area
is normally an area of longitudinal extension and vertical compression,
it would become an ellipsoid, elongated in the direction of flow and com-
pressed vertically. If there were also significant transverse compression
it would become a prolate ellipsoid, whereas if there were transverse
extension, it would become oblate. Figure 13.1 illustrates schematically,
in two dimensions, how the shape of a cross section through the sphere
would change as the sphere passed through the glacier.
Our objective in this chapter is to discuss the cumulative deforma-
tion experienced by ice as it is advected through a glacier, and to show
the relation between this deformation and the banded structure, called
foliation, that is characteristic of glaciers.
The strain ellipse
The ellipsoid we have just discussed is called the strain ellipsoid or, in
two dimensions, the strain ellipse. Following normal convention, we will
denote the greatest, intermediate, and shortest principal semi-axes of the
ellipsoid by subscripts 1, 2, and 3, and the directions of these axes by X,
Y, and Z, respectively. These axes will rotate with respect to our fixed x,
y, z coordinate system as the strain ellipsoid rotates (Figure 13.2). The
lengths of the axes of the ellipsoid are a measure of the strain it has
experienced. As in Equation (9.16)wedefine the strain by:
e =
−
o
o
=
o
− 1 (13.1)
349
350 Finite strain and the origin of foliation
Equilibrium
line
Figure 13.1. Schematic illustration of the deformation that would be
experienced by an object that is initially spherical (or circular in two dimensions)
as it moves through a glacier from the accumulation zone to the ablation zone.
(From Hooke and Hudleston, 1978, Figure 3B. Reproduced with permission of
the International Glaciological Society.)
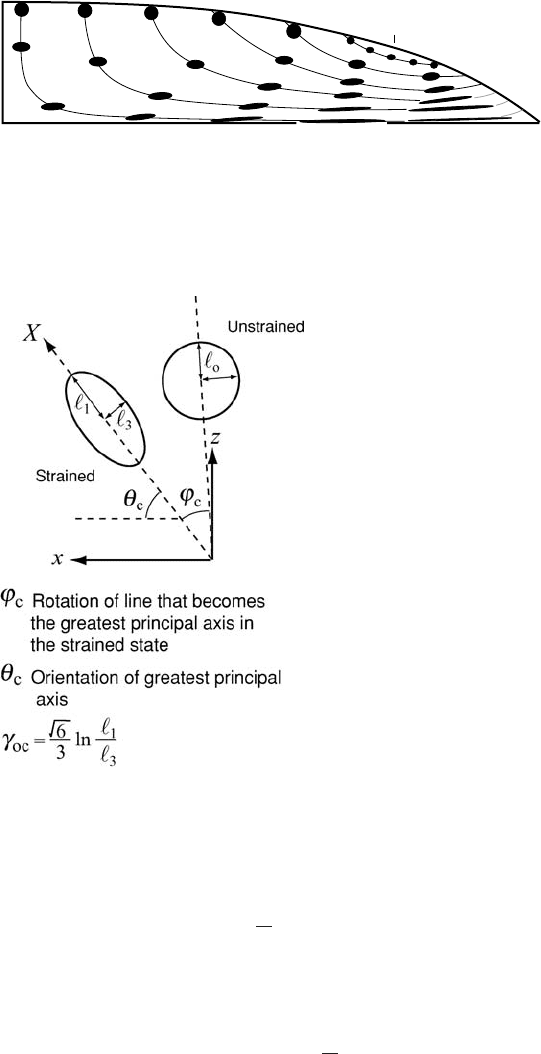
Figure 13.2. Sketch showing
parameters used to describe,
in two dimensions, the
cumulative strain experienced
by an initially circular object.
(Modified from Hooke and
Hudleston, 1980, Figure 8C.)
If
o
, the radius of the initial sphere, is taken as 1, then
i
= 1 + e
i
is the length of the ith semi-axis of the ellipsoid (Figure 13.2). From
Equation (9.23) the logarithmic strain is then:
ε
i
= ln
i
o
= ln(1 + e
i
) (13.2)
Let us now take
i
/
j
(i, j = 1, 2, 3 and i = j)asameasure of the
strain in the i, j plane. Then
ε
i
− ε
j
= ln
i
j
(13.3)