Hager G., Wellein G. Introduction to High Performance Computing for Scientists and Engineers
Подождите немного. Документ загружается.


Modern processors 35
you expect for this loop with respect to ofs if N is small enough so that all
elements of A fit into the L1 cache?
1.3 Hardware prefetching. Prefetching is an essential operation for making effec-
tive use of a memory interface. Hardware prefetchers in x86 designs are usu-
ally built to fetch data up until the end of a memory page. Identify situations
in which this behavior could have a negative impact on program performance.
1.4 Dot product and prefetching. Consider the double precision dot product,
1 do i=1,N
2 s = s + A(i)
*
B(i)
3 enddo
for large N on an imaginary CPU. The CPU (1ns clock cycle) can do one
load (or store), one multiplication and one addition per cycle (assume that
loop counting and branching comes at no cost). The memory bus can trans-
fer 3.2GBytes/sec. Assume that the latency to load one cache line from main
memory is 100 CPU cycles, and that four double precision numbers fit into
one cache line. Under those conditions:
(a) What is the expected performance for this loop kernel without data pre-
fetching?
(b) Assuming that the CPU is capable of prefetching (loading cache lines
from memory in advance so that they are present when needed), what is
the required number of outstanding prefetches the CPU has to sustain in
order to make this code bandwidth-limited (instead of latency-limited)?
(c) How would this number change if the cache line were twice or four times
as long?
(d) What is the expected performance if we can assume that prefetching
hides all the latency?

Chapter 2
Basic optimization techniques for serial
code
In the age of multi-1000-processor parallel computers, writing code that runs ef-
ficiently on a single CPU has grown slightly old-fashioned in some circles. The
argument for this point of view is derived from the notion that it is easier to add
more CPUs and boasting massive parallelism instead of investing effort into serial
optimization. There is actually some plausible theory, outlined in Section 5.3.8, to
support this attitude. Nevertheless there can be no doubt that single-processor opti-
mizations are of premier importance. If a speedup of two can be achieved by some
simple code changes, the user will be satisfied with much fewer CPUs in the par-
allel case. This frees resources for other users and projects, and puts hardware that
was often acquired for considerable amounts of money to better use. If an existing
parallel code is to be optimized for speed, it must be the first goal to make the single-
processor run as fast as possible. This chapter summarizes basic tools and strategies
for serial code profiling and optimizations. More advanced topics, especially in view
of data transfer optimizations, will be covered in Chapter 3.
2.1 Scalar profiling
Gathering information about a program’s behavior, specifically its use of re-
sources, is called profiling. The most important “resource” in terms of high per-
formance computing is runtime. Hence, a common profiling strategy is to find out
how much time is spent in the different functions, and maybe even lines, of a code
in order to identify hot spots, i.e., the parts of the program that require the dominant
fraction of runtime. These hot spots are subsequently analyzed for possible optimiza-
tion opportunities. See Section 2.1.1 for an introduction to function- and line-based
profiling.
Even if hot spots have been determined, it is sometimes not clear from the start
what the actual reasons for a particular performance bottleneck are, especially if
the function or code block in question extends over many lines. In such a case one
would like to know, e.g., whether data access to main memory or pipeline stalls limit
performance. If data access is the problem, it may not be straightforward to identify
which data items accessed in a complex piece of code actually cause the most delay.
Hardware performance counters may help to resolve such issues. They are provided
37

38 Introduction to High Performance Computing for Scientists and Engineers
on all current processors and allow deep insights into the use of resources within the
chip and the system. See Section 2.1.2 for more information.
One should point out that there are indeed circumstances when nothing can be
done any more to accelerate a serial code any further. It is essential for the user
to be able to identify the point where additional optimization efforts are useless.
Section 3.1 contains guidelines for the most common cases.
2.1.1 Function- and line-based runtime profiling
In general, two technologies are used for function- and line-based profiling: Code
instrumentation and sampling. Instrumentation works by letting the compiler modify
each function call, inserting some code that logs the call, its caller (or the complete
call stack) and probably how much time it required. Of course, this technique in-
curs some significant overhead, especially if the code contains many functions with
short runtime. The instrumentation code will try to compensate for that, but there
is always some residual uncertainty. Sampling is less invasive: the program is in-
terrupted at periodic intervals, e.g., 10 milliseconds, and the program counter (and
possibly the current call stack) is recorded. Necessarily this process is statistical by
nature, but the longer the code runs, the more accurate the results will be. If the
compiler has equipped the object code with appropriate information, sampling can
deliver execution time information down to the source line and even machine code
level. Instrumentation is necessarily limited to functions or basic blocks (code with
one entry and one exit point with no calls or jumps in between) for efficiency reasons.
Function profiling
The most widely used profiling tool is gprof from the GNU binutils package.
gprof uses both instrumentation and sampling to collect a flat function profile as
well as a callgraph profile, also called a butterfly graph. In order to activate profil-
ing, the code must be compiled with an appropriate option (many modern compil-
ers can generate gprof-compliant instrumentation; for the GCC, use -pg) and run
once. This produces a non-human-readable file gmon.out, to be interpreted by the
gprof program. The flat profile contains information about execution times of all
the program’s functions and how often they were called:
1 % cumulative self self total
2 time seconds seconds calls ms/call ms/call name
3 70.45 5.14 5.14 26074562 0.00 0.00 intersect
4 26.01 7.03 1.90 4000000 0.00 0.00 shade
5 3.72 7.30 0.27 100 2.71 73.03 calc_tile
There is one line for each function. The columns can be interpreted as follows:
% time Percentage of overall program runtime used exclusively by this function,
i.e., not counting any of its callees.
cumulative seconds Cumulative sum of exclusive runtimes of all functions up to
and including this one.

Basic optimization techniques for serial code 39
self seconds Number of seconds used by this function (exclusive). By default, the
list is sorted according to this field.
calls The number of times this function was called.
self ms/call Average number of milliseconds per call that were spent in this function
(exclusive).
total ms/call Average number of milliseconds per call that were spent in this func-
tion, including its callees (inclusive).
In the example above, optimization attempts would definitely start with the
intersect() function, and shade() would also deserve a closer look. The cor-
responding exclusive percentages can hint at the maximum possible gain. If, e.g.,
shade() could be optimized to become twice as fast, the whole program would
run in roughly 7.3−0.95 = 6.35 seconds, i.e., about 15% faster.
Note that the outcome of a profiling run can depend crucially on the ability of the
compiler to perform function inlining. Inlining is an optimization technique that re-
places a function call by the body of the callee, reducing overhead (see Section 2.4.2
for a more thorough discussion). If inlining is allowed, the profiler output may be
strongly distorted when some hot spot function gets inlined and its runtime is at-
tributed to the caller. If the compiler/profiler combination has no support for correct
profiling of inlined functions, it may be required to disallow inlining altogether. Of
course, this may itself have some significant impact on program performance char-
acteristics.
A flat profile already contains a lot of information, however it does not reveal
how the runtime contribution of a certain function is composed of several different
callers, which other functions (callees) are called from it, and which contribution to
runtime they in turn incur. This data is provided by the butterfly graph, or callgraph
profile:
1 index % time self children called name
2 0.27 7.03 100/100 main [2]
3 [1] 99.9 0.27 7.03 100 calc_tile [1]
4 1.90 5.14 4000000/4000000 shade [3]
5 -----------------------------------------------
6 <spontaneous>
7 [2] 99.9 0.00 7.30 main [2]
8 0.27 7.03 100/100 calc_tile [1]
9 -----------------------------------------------
10 5517592 shade [3]
11 1.90 5.14 4000000/4000000 calc_tile [1]
12 [3] 96.2 1.90 5.14 4000000+5517592 shade [3]
13 5.14 0.00 26074562/26074562 intersect [4]
14 5517592 shade [3]
15 -----------------------------------------------
16 5.14 0.00 26074562/26074562 shade [3]
17 [4] 70.2 5.14 0.00 26074562 intersect [4]
Each section of the callgraph pertains to exactly one function, which is listed to-
gether with a running index (far left). The functions listed above this line are the

40 Introduction to High Performance Computing for Scientists and Engineers
current function’s callers, whereas those listed below are its callees. Recursive calls
are accounted for (see the shade() function). These are the meanings ofthe various
fields:
% time The percentage of overall runtime spent in this function, including its
callees (inclusive time). This should be identical to the product of the num-
ber of calls and the time per call on the flat profile.
self For each indexed function, this is exclusive execution time (identical to flat pro-
file). For its callers (callees), it denotes the inclusive time this function (each
callee) contributed to each caller (this function).
children For each indexed function, this is inclusive minus exclusive runtime, i.e.,
the contribution of all its callees to inclusive time. Part of this time contributes
to inclusive runtime of each of the function’s callers and is denoted in the re-
spective caller rows. The callee rows in this column designate the contribution
of each callee’s callees to the function’s inclusive runtime.
called denotes the number of times the function was called (probably split into re-
cursive plus nonrecursive contributions, as shown in case of shade() above).
Which fraction of the number of calls came from each caller is shown in the
caller row, whereas the fraction of calls for each callee that was initiated from
this function can be found in the callee rows.
There are tools that can represent the butterfly profile in a graphical way, making it
possible to browse the call tree and quickly find the “critical path,” i.e., the sequence
of functions (from the root to some leaf) that shows dominant inclusive contributions
for all its elements.
Line-based profiling
Function profiling becomes useless when the program to be analyzed contains
large functions (in terms of code lines) that contribute significantly to overall run-
time:
1 % cumulative self self total
2 time seconds seconds calls s/call s/call name
3 73.21 13.47 13.47 1 13.47 18.40 MAIN__
4 6.47 14.66 1.19 21993788 0.00 0.00 mvteil_
5 6.36 15.83 1.17 51827551 0.00 0.00 ran1_
6 6.25 16.98 1.15 35996244 0.00 0.00 gzahl_
Here the MAIN function in a Fortran program requires over 73% of overall runtime
but has about 1700 lines of code. If the hot spot in such functions cannot be found by
simple common sense, tools for line-based profiling should be used. Many products,
free and commercial, exist that can perform this task to different levels of sophisti-
cation. As an example we pick the open source profiling tool OProfile [T19], which
can in some sense act as a replacement for gprof because it can do function-based
flat and butterfly profiles as well. With OProfile, the only prerequisite the binary has

Basic optimization techniques for serial code 41
to fulfill is that debug symbols must be included (usually this is accomplished by the
-g compiler option). Any special instrumentation is not required. A profiling dae-
mon must be started (usually with the rights of a super user), which subsequently
monitors the whole computer and collects data about all running binaries. The user
can later extract information about a specific binary. Among other things, this can be
an annotated source listing in which each source line is accompanied by the number
of sampling hits (first column) and the relative percentage of total program samples
(second column):
1 : DO 215 M=1,3
2 4292 0.9317 : bremsdir(M) = bremsdir(M) + FH(M)
*
Z12
3 1462 0.3174 : 215 CONTINUE
4 :
5 682 0.1481 : U12 = U12 + GCL12
*
Upot
6 :
7 : DO 230 M=1,3
8 3348 0.7268 : F(M,I)=F(M,I)+FH(M)
*
Z12
9 1497 0.3250 : Fion(M)=Fion(M)+FH(M)
*
Z12
10 501 0.1088 :230 CONTINUE
This kind of data has to be taken with a grain of salt, though. The compiler-generated
symbol tables must be consistent so that a machine instruction’s address in memory
can be properly matched to the correct source line. Modern compilers can reorganize
code heavily if high optimization levels are enabled. Loops can be fused or split,
lines rearranged, variables optimized away, etc., so that the actual code executed
may be far from resembling the original source. Furthermore, due to the strongly
pipelined architecture of modern microprocessors it is usually impossible to attribute
a specific moment in time to a particular source line or even machine instruction.
However, looking at line-based profiling data on a loop-by-loop basis (samples inte-
grated across the loop body) is relatively safe; in case of doubt, recompilation with a
lower optimization level (and inlining disabled) may provide more insight.
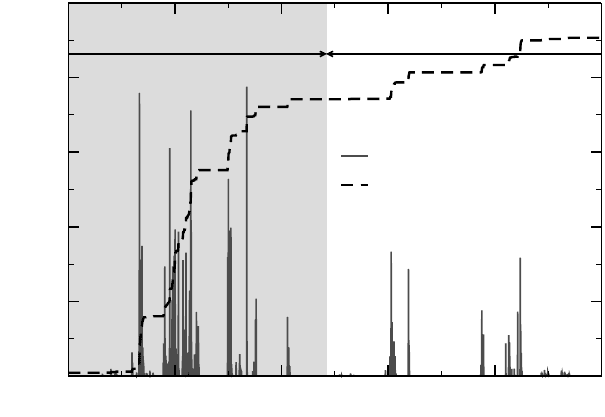
Above source line profile can be easily put into a form that allows identification
of hot spots. The cumulative sum over all samples versus source line number has a
steep slope wherever many sampling hits are aggregated (see Figure 2.1).
2.1.2 Hardware performance counters
The first step in performance profilingis concerned withpinpointing the hot spots
in terms of runtime, i.e., clock ticks. But when it comes to identifying the actual
reason for a code to be slow, or if one merely wants to know by which resource it
is limited, clock ticks are insufficient. Luckily, modern processors feature a small
number of performance counters (often far less than ten), which are special on-chip
registers that get incremented each time a certain event occurs. Among the usually
several hundred events that can be monitored, there are a few that are most useful for
profiling:
• Number of bus transactions, i.e., cache line transfers. Events like “cache
misses” are commonly used instead of bus transactions, however one should
42 Introduction to High Performance Computing for Scientists and Engineers
1000 1500 2000 2500
source line #
0
5 k
10 k
15 k
20 k
samples
samples
cumulative sum (/20)
MAIN function subroutines
Figure 2.1: Sampling histogram (solid) with number of samples vs. source code line number.
Dashed line: Cumulative sum over samples. Important hot spots (about 50% of overall time)
are around line 1000 of the MAIN function, which encompasses over 1700 lines of code.
be aware that prefetching mechanisms (in hardware or software) can interfere
with the number of cache misses counted. In that respect, bus transactions are
often the safer way to account for the actual data volume transferred over the
memory bus. If the memory bandwidth used by a processor is close to the
theoretical maximum (or better, close to what standard low-level bandwidth
benchmarks like STREAM [W119, 134] can achieve; see Section 3.1), there is
no point in trying to optimize further for better bus utilization. The number can
also be used for checking the correctness of some theoretical model one may
have developed for estimating the data transfer requirements of an application
(see Section 3.1 for an example of such a model).
• Number of loads and stores. Together with bus transactions, this can give an
indication as to how efficiently cache lines are used for computation. If, e.g.,
the number of DP loads and stores per cache line is less than its length in DP
words, this may signal strided memory access. One should however take into
account how the data is used; if, for some reason, the processor pipelines are
stalled most of the time, or if many arithmetic operations on the data are per-
formed out of registers, the strided access may not actually be a performance
bottleneck.
• Number of floating-point operations. The importance of this very popular met-
ric is often overrated. As will be shown in Chapter 3, data transfer is the dom-
inant performance-limiting factor in scientific code. Even so, if the number

Basic optimization techniques for serial code 43
of floating-point operations per clock cycle is somewhere near the theoretical
maximum (either given by the CPU’s peak performance, or less if there is an
asymmetry between MULT and ADD operations), standard code optimization
is unlikely to achieve any improvement and algorithmic changes are probably
in order.
• Mispredicted branches. This counter is incremented when the CPU has pre-
dicted the outcome of a conditional branch and the prediction has proved to be
wrong. Depending on the architecture, the penalty for a mispredicted branch
can be tens of cycles (see Section 2.3.2 below). In general, scientific codes
tend to be loop-based so that branches are well predictable. However, “pointer
chasing” and computed branches increase the probability of mispredictions.
• Pipeline stalls. Dependencies between operations running in different stages
of the processor pipeline (see Section 1.2.3) can lead to cycles during which
not all stages are busy, so-called stalls or bubbles. Often bubbles cannot be
avoided, e.g., when performance is limited by memory bandwidth and the
arithmetic units spend their time waiting for data. Hence, it is quite difficult
to identify the point where there are “too many” bubbles. Stall cycle anal-
ysis is especially important on in-order architectures (like, e.g., Intel IA64)
because bubbles cannot be filled by the hardware if there are no provisions for
executing instructions that appear later in the instruction stream but have their
operands available.
• Number of instructions executed. Together with clock cycles, this can be a
guideline for judging how effectively the superscalar hardware with its mul-
tiple execution units is utilized. Experience shows that it is quite hard for
compiler-generated code to reach more than 2–3 instructions per cycle, even
in tight inner loops with good pipelining properties.
There are essentially two ways to use hardware counters in profiling. In order to get
a quick overview of the performance properties of an application, a simple tool can
measure overall counts from start to finish and probably calculate some derived met-
rics like “instructions per cycle” or “cache misses per load or store.” A typical output
of such a tool could look like this if run with some application code (these examples
were compiled from output generated by the lipfpm tool, which is delivered with
some SGI Altix systems):
1 CPU Cycles.............................................. 8721026107
2 Retired Instructions.................................... 21036052778
3 Average number of retired instructions per cycle........ 2.398151
4 L2 Misses............................................... 101822
5 Bus Memory Transactions................................. 54413
6 Average MB/s requested by L2............................ 2.241689
7 Average Bus Bandwidth (MB/s)............................ 1.197943
8 Retired Loads........................................... 694058538
9 Retired Stores.......................................... 199529719
10 Retired FP Operations................................... 7134186664
11 Average MFLOP/s......................................... 1225.702566

44 Introduction to High Performance Computing for Scientists and Engineers
12 Full Pipe Bubbles in Main Pipe.......................... 3565110974
13 Percent stall/bubble cycles............................. 40.642963
Note that the number of performance counters is usually quite small (between 2 and
4). Using a large number of metrics like in the example above may require running
the application multiple times or, if the profiling tool supports it, multiplexing be-
tween different sets of metrics by, e.g., switching to another set in regular intervals
(like 100ms). The latter introduces a statistical error into the data. This error should
be closely watched, especially if the counts involved are small or if the application
runs only for a very short time.
In the example above the large number of retired instructions per cycle indicates
that the hardware is well utilized. So do the (very small) required bandwidths from
the caches and main memory and the relation between retired load/store instructions
to L2 cache misses. However, there are pipeline bubbles in 40% of all CPU cycles.
It is hard to tell without some reference whether this is a large or a small value. For
comparison, this is the profile of a vector triad code (large vector length) on the same
architecture as above:
1 CPU Cycles.............................................. 28526301346
2 Retired Instructions.................................... 15720706664
3 Average number of retired instructions per cycle........ 0.551095
4 L2 Misses............................................... 605101189
5 Bus Memory Transactions................................. 751366092
6 Average MB/s requested by L2............................ 4058.535901
7 Average Bus Bandwidth (MB/s)............................ 5028.015243
8 Retired Loads........................................... 3756854692
9 Retired Stores.......................................... 2472009027
10 Retired FP Operations................................... 4800014764
11 Average MFLOP/s......................................... 252.399428
12 Full Pipe Bubbles in Main Pipe.......................... 25550004147
13 Percent stall/bubble cycles............................. 89.566481
The bandwidth requirements, the low number of instructions per cycle, and the re-
lation between loads/stores and cache misses indicate a memory-bound situation. In
contrast to the previous case, the percentage of stalled cycles is more than doubled.
Only an elaborate stall cycle analysis, based on more detailed metrics, would be able
to reveal the origin of those bubbles.
Although it can provide vital information, collecting “global” hardware counter
data may be too simplistic in some cases. If, e.g., the application profile contains
many phases with vastly different performance properties (e.g., cache-bound vs.
memory-bound, etc.), integrated counter data may lead to false conclusions. Restrict-
ing counter increments to specific parts of code execution can help to break down
the counter profile and get more specific data. Most simple tools provide a small
library with an API that allows at least enabling and disabling the counters under
program control. An open-source tool that can do this is, e.g., contained in the LIK-
WID [T20, W120] suite. It is compatible with most current x86-based processors.
A even more advanced way to use hardware performance counters (that is, e.g.,
supported by OProfile, but also by other tools like Intel VTune [T21]) is to use sam-
pling to attribute the events they accumulate to functions or lines in the application