Griffiths D. Head First Statistics
Подождите немного. Документ загружается.

you are here 4 31
visualizing information
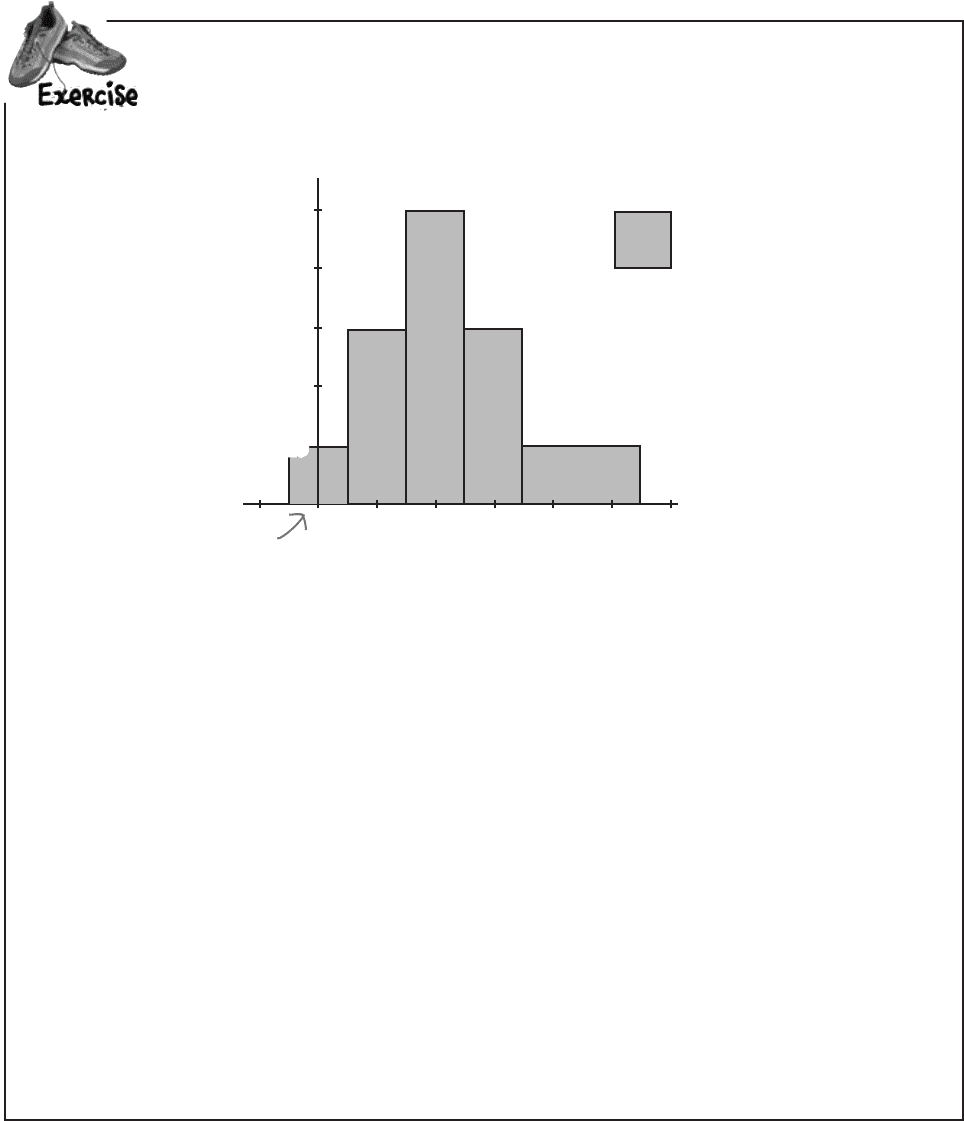
Here’s a histogram representing the number of levels completed in each game of Cows Gone
Wild. How many games have been played in total? Assume each level is a whole number.
-0.5 to 0.5 represents 0 levels, as all
values within this range round to 0.
Level
Represents 10 games
0 1 2 3 4 5-1 6
Frequency Density
No. Levels Completed per Game
20
50
40
30
10
32 Chapter 1
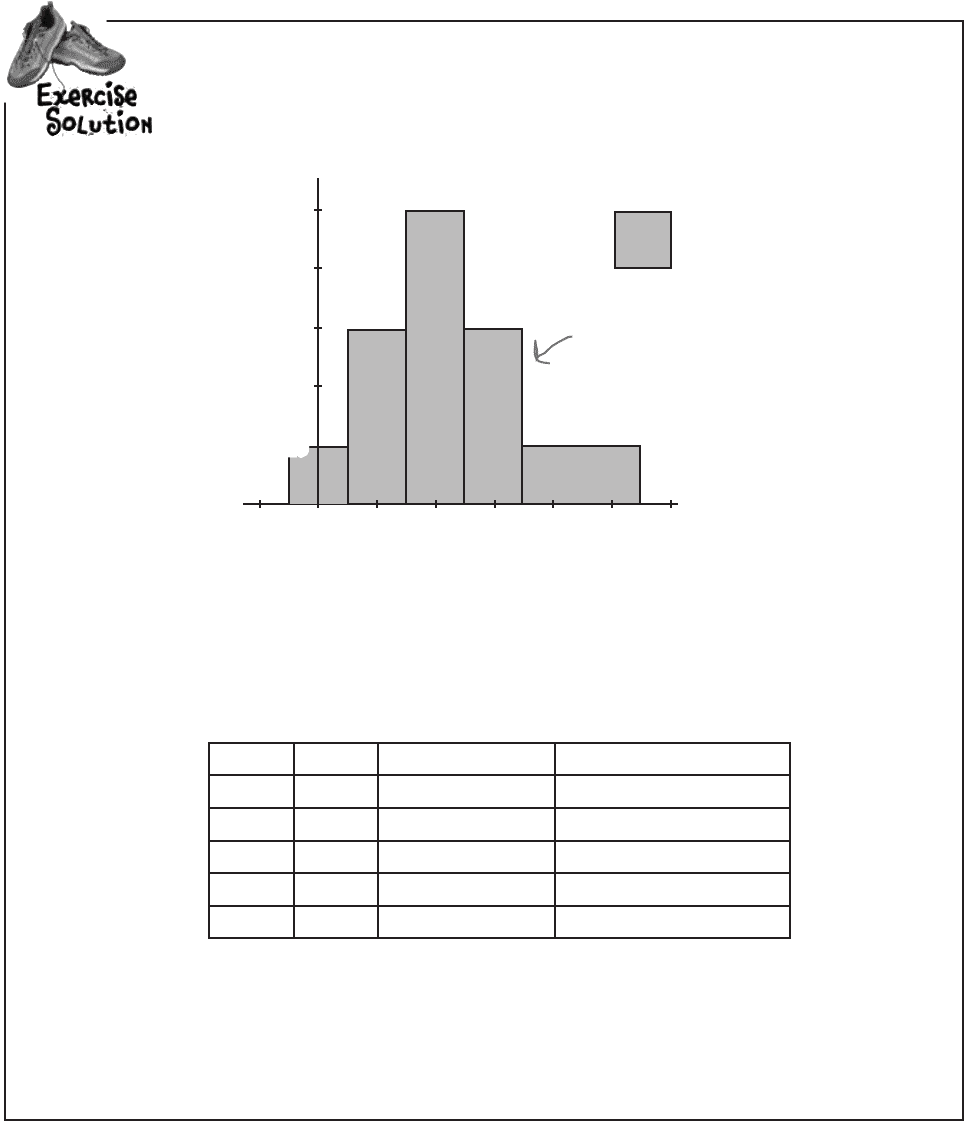
Here’s a histogram representing the number of levels completed in each game of Cows Gone
Wild. How many games have been played in total? Assume each level is a whole number.
Level Width Frequency Density Frequency
0 1 10 1x10 = 10
1 1 30 1x30 = 30
2 1 50 1x50 = 50
3 1 30 1x30 = 30
4–5 2 10 2x10 = 20
We need to find the total number of games played, which means we need to find the total frequency.
The total frequency is equal to the area of each bar added together. In other words, we multiply the width
of each bar by its frequency density to get the frequency, and then add the whole lot up together.
Total Frequency = 10 + 30 + 50 + 30 + 20
= 140
Each level is a whole
number, so the bar
for level 3 goes from
2.5 to 3.5.
Level
Represents 10 games
0 1 2 3 4 5-1 6
Frequency Density
No. Levels Completed per Game
20
50
40
30
10
exercise solution
you are here 4 33
visualizing information
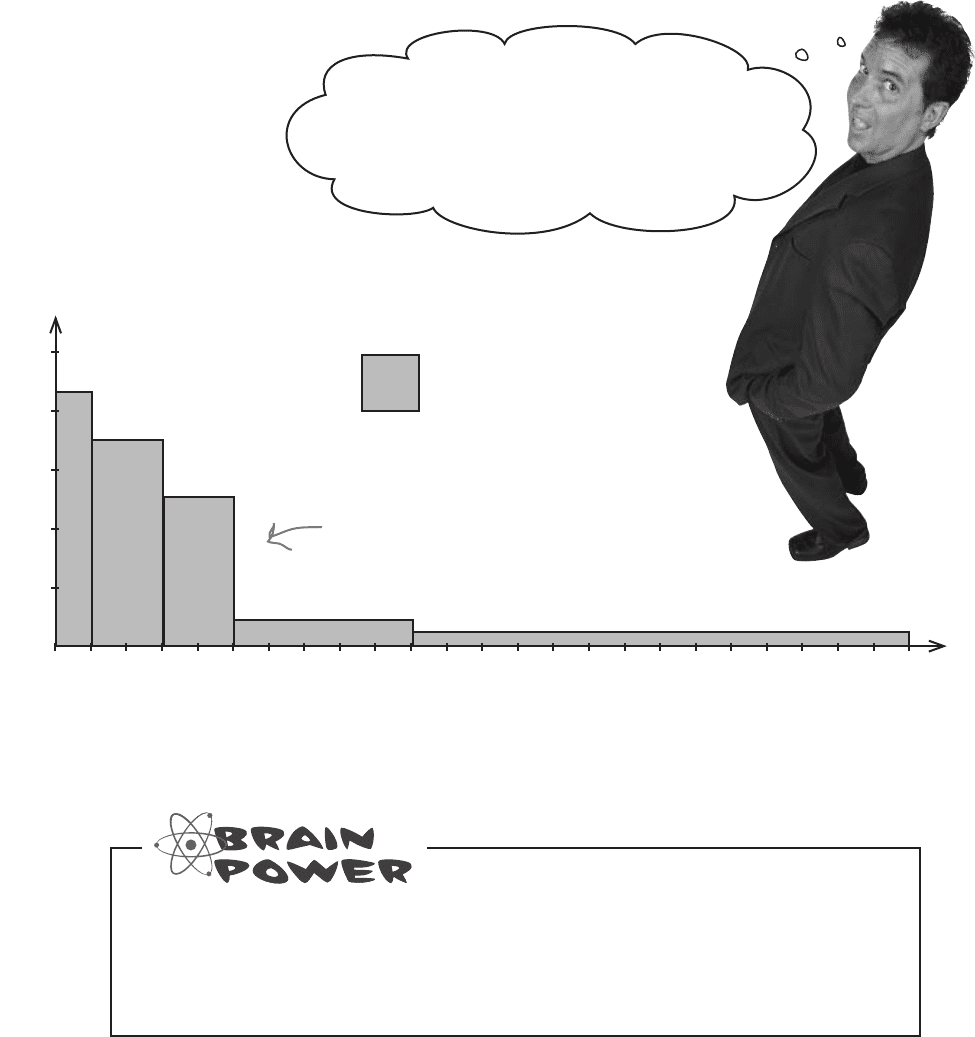
Histograms can’t do everything
What sort of information do you think we should show on the chart? What sort
of information should we plot? Write your answer below.
It’s tricky to see at a glance what the running totals are in this
chart. In order to find the frequency of players playing for up to
5 hours, we need to add different frequencies together. We need
another sort of chart…but what?
I’d really like to be able to see at a glance how many
people play for less than a certain number of hours.
Like, instead of seeing how many people play for
between 3 and 5 hours, could we have a graph that
shows how many people play for
up to
5 hours?
Let’s see if we can help the CEO out. Here’s the
histogram we had before.
While histograms are an excellent way to display
grouped numeric data, there are still some
kinds of this data they’re not ideally suited for
presenting—like running totals…
The histogram tells us the frequency density of
particular groups. It’s not so hot at giving us
information about how many players play for less
than a certain amount of hours.
Hours
Frequency Density
Hours Spent Gaming per Day
Represents 1000 Days
2000
1000
3000
5000
4000
0
2410530 1
34 Chapter 1
The CEO needs some sort of chart that will show him the total
frequency below a particular value: the cumulative frequency.
By cumulative frequency, we basically mean a running total.
What we need to come up with is some sort of graph that shows
hours on the horizontal axis and cumulative frequency on the
vertical axis. That way, the CEO will be able to take a value and
read off the corresponding frequency up to that point. He’ll be able
to find out how many people play for up to 5 hours, 6 hours, or
whatever other number of hours he’s most interested in at the time.
Before we can draw the chart, we need to know what exactly
we need to plot on the chart. We need to calculate cumulative
frequencies for each of the intervals that we have, and also work
out the upper limit of each interval.
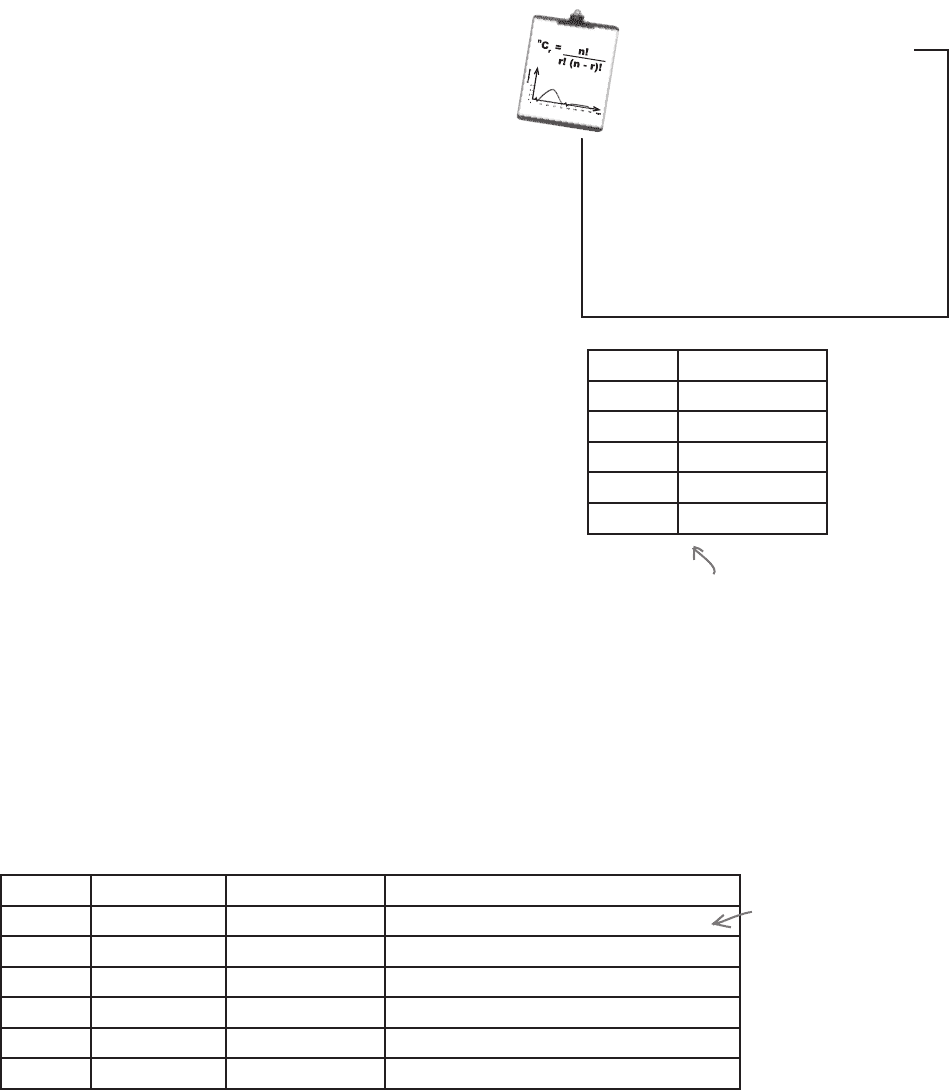
Let’s start by looking at the data.
So what are the cumulative frequencies?
First off, let’s suppose the CEO needs to plot the cumulative frequency, or
total frequency, of up to 1 hour. If we look at the data, we know that the
frequency of the 0–1 group is 4300, and we can see that is the upper limit of
the group. This means that the cumulative frequency of hours up to 1 is 4300.
Next, let’s look at the total frequency up to 3. We know what the frequencies
are for the 0–1 and 1–3 groups, and 3 is again the upper limit. To find the
total frequency of hours up to 3, we add together the frequency of the 0–1
group and the 1–3 group.
Can you see a pattern? If we take the upper limit of each of the groups of
hours, we can find the total frequency of hours up to that value by adding
together the frequencies. Applying this to all the groups gives us
Hours Frequency
0–1 4,300
1–3 6,900
3–5 4,900
5–10 2,000
10–24 2,100
Here’s the data.
Hours Frequency Upper limit Cumulative frequency
0 0 0 0
0–1 4,300 1 4,300
1–3 6,900 3 4,300+6,900 = 11,200
3–5 4,900 5 4,300+6,900+4,900 = 16,100
5–10 2,000 10 4,300+6,900+4,900+2,000 = 18,100
10–24 2,100 24 4,300+6,900+4,900+2,000+2,100 = 20,200
We’ve added in 0, as
you can’t play games
for LESS than 0
hours a week.
Introducing cumulative frequency
Cumulative
Frequency
The total frequency up to
certain value. It’s basically a
running total of the frequencies.
Vital StatisticsVital Statistics
cumulative frequency graphs
you are here 4 35
visualizing information
Hours
Cumulative Frequency
Running Total of Hours Played
0 5 10 15 20
10000
0.0
15000
20000
22500
25
17500
12500
5000
2500
7500
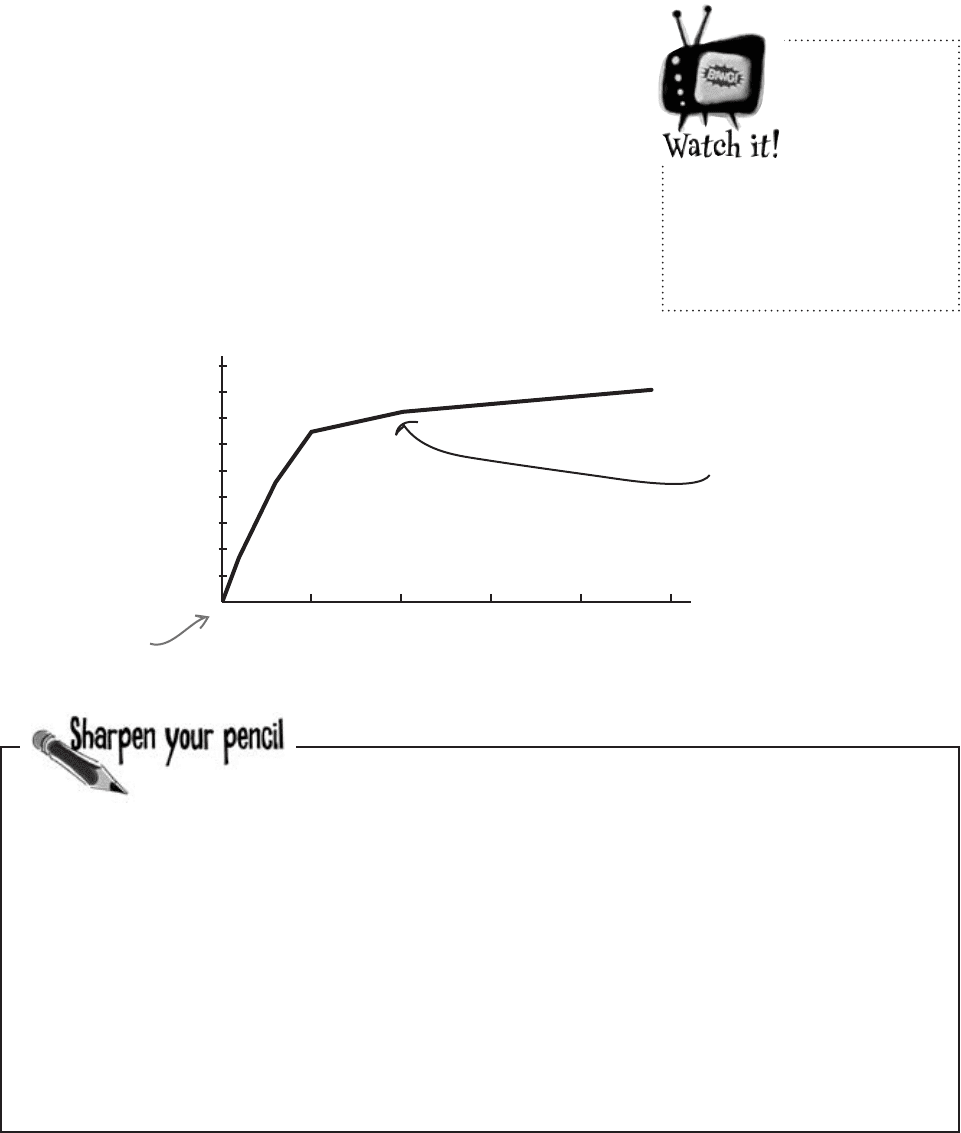
Drawing the cumulative frequency graph
Now that we have the upper limits and cumulative frequencies, we
can plot them on a chart. Draw two axes, with the vertical one for the
cumulative frequency and the horizontal one for the hours. Once you’ve
done that, plot each of the upper limits against its cumulative frequency,
and then join the points together with a line like this:
Always start your chart
where the cumulative
frequency is 0.
You plot this point by
plotting 10 hours against
a cumulative frequency of
18,100.
The CEO wants you to find the number of instances of people
playing online for up to 4 hours. See if you can estimate this
using the cumulative frequency diagram.
Cumulative
frequencies
can never
decrease.
If your cumulative
frequency decreases at
any point, check your
calculations.

36 Chapter 1
0 5
10000
15000
5000
2500
7500
0.0
Q:
What’s a cumulative frequency?
A: The cumulative frequency of a value
is the sum of the frequencies up to and
including that value. It tells you the total
frequency up to that point.
As an example, suppose you have data
telling you how old people are. The
cumulative frequency for value 27 tells
you how many people there are up to and
including age 27.
Q:
Are cumulative frequency graphs
just for grouped data?
A: Not at all; you can use them for
any sort of numeric data. The key thing
is whether you want to know the total
frequency up to a particular value, or
whether you’re more interested in the
frequencies of particular values instead.
Q:
On some charts you can show
more than one set of data on the same
chart. What about for cumulative
frequency graphs?
A: You can do this for cumulative
frequency graphs by drawing a separate
line for each set of data. If, say, you wanted
to compare the cumulative frequencies by
gender, you could draw one line showing
males and the other females. It would be
far more effective to show both lines on one
chart, as it makes it easier to compare the
two sets of data.
Q:
Is there a limit to how many lines
you can show on one chart?
A: There’s no specific limit, as it all
depends on your data. Don’t have so many
lines that the graph becomes cluttered
and you can no longer use it to read off
cumulative frequencies and compare sets
of data.
Q:
Remind me, how do I find the
cumulative frequency of a value?
A: You can find the cumulative frequency
by reading it straight off the graph. You
locate the value you want to find the
cumulative frequency for on the horizontal
axis, find where this meets the cumulative
frequency curve, and then read the value of
cumulative frequency off the vertical axis.
Q:
If I already know the cumulative
frequency, can I use the graph to find the
corresponding value?
A: Yes you can. Look for the cumulative
frequency on the vertical axis, find where it
meets the cumulative frequency curve, and
then read off the value.
To do this, we find 4 on the horizontal axis, find where
this value meets the line of the graph, and read off the
corresponding cumulative frequency on the vertical axis.
This gives us an answer of approximately 13,750. In other
words, there are approximately 13,750 instances of
people playing online for under 4 hours.
The CEO wants you to find the number of instances of people
playing online for less than 4 hours. See if you can estimate this
using the cumulative frequency diagram.
4
13750
12500
sharpen solution and no dumb questions
you are here 4 37
visualizing information
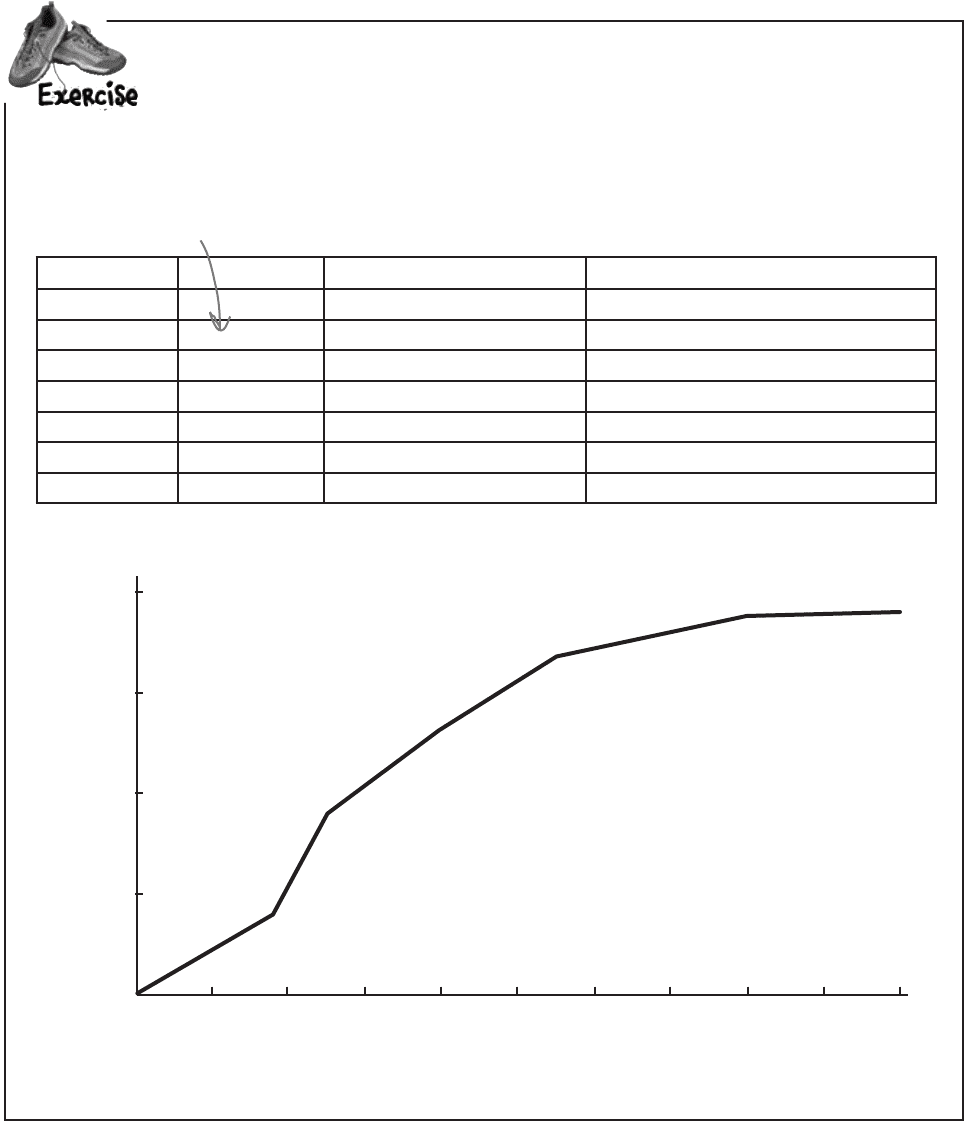
During the Manic Mango keynote, the CEO wants to explain how he wants to target particular age
groups. He has a cumulative frequency graph showing the cumulative frequency of the ages, but
he needs the frequencies too, and the dog ate the piece of paper they were written on. See if you
can use the cumulative frequency graph to estimate what the frequencies of each group are.
Age group Upper limit Cumulative frequency Frequency
<0 0 0 0
0–17 18
18–24
25–39
40–54
55–79
80–99
The upper limit is 18 because someone is classed as being 17
from the point of their 17th birthday up until the point
they turn 18. Ages are generally rounded down.
Hours
Cumulative Frequency
Number of Players Under a Particular Age
0 10 20 30 40
10000
0.0
50
5000
2500
7500
60 70 80 90 100
38 Chapter 1
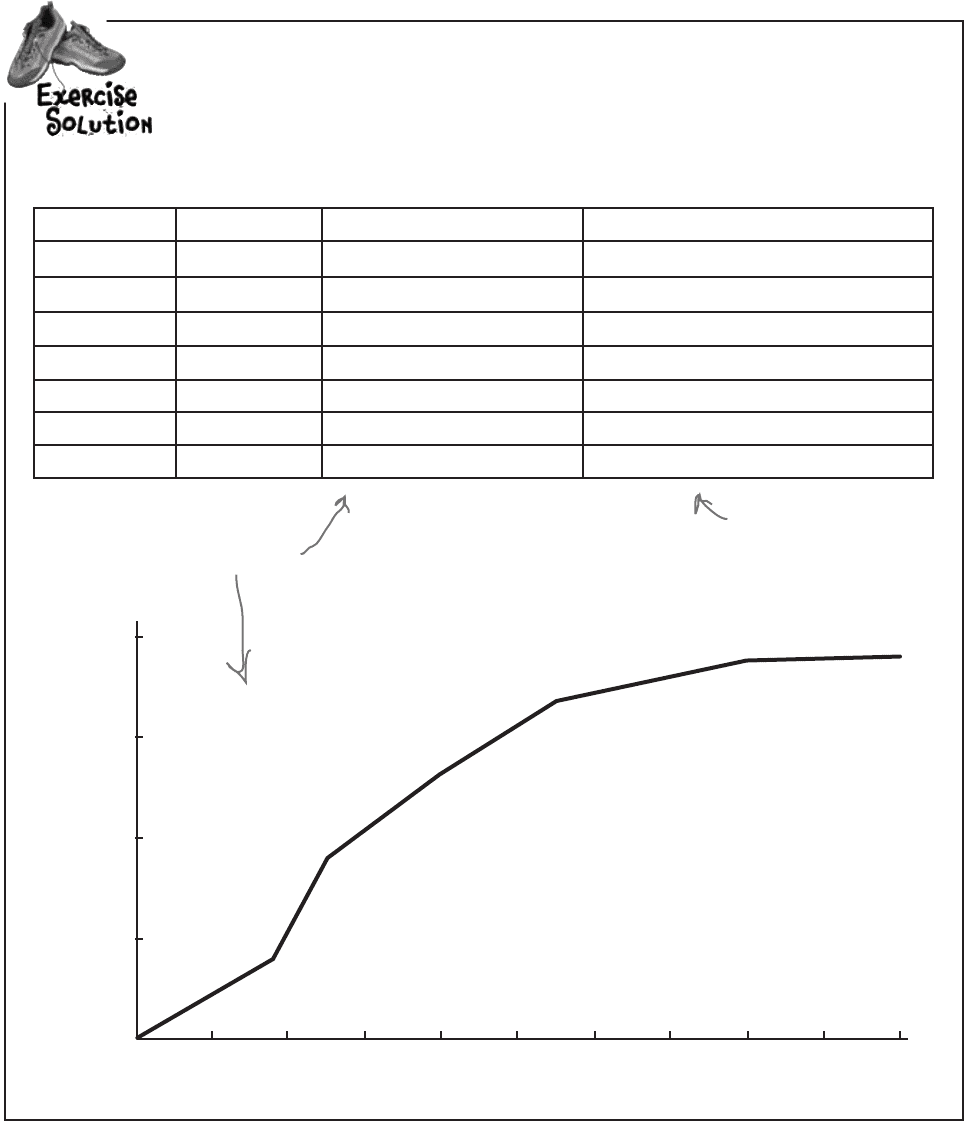
During the Manic Mango keynote, the CEO wants to explain how he wants to target particular age
groups. He has a cumulative frequency graph showing the cumulative frequency of the ages, but
he needs the frequencies too, and the dog ate the piece of paper they were written on. See if you
can use the cumulative frequency graph to piece together what the frequencies of each group are.
Age group Upper limit Cumulative frequency Frequency
<0 0 0 0
0–17 18
2,000 2,000
18–24
25 4,500 4,500 - 2,000 = 2,500
25–39
40 6,500 6,500 - 4,500 = 2,000
40–54
55 8,500 8,500 - 6,500 = 2,000
55–79
80 9,400 9,400 - 8,500 = 900
80–99
100 9,500 9,500 - 9,400 = 100
Use the chart to
find the cumulative
frequencies.
You can find the frequencies by
taking the current cumulative
frequency, and subtracting the
previous one.
Don’t worry if you get slightly
different results—they’re just
estimates.
Hours
Cumulative Frequency
Number of Players Under a Particular Age
0 10 20 30 40
10000
0.0
50
5000
2500
7500
60 70 80 90 100
exercise solution
you are here 4 39
visualizing information
Choosing the right chart
The CEO is really happy with your work on cumulative frequency graphs, and
your bonus is nearly in the bag. He’s nearly finished preparing for the keynote,
but there’s just one more thing he needs: a chart showing Manic Mango profits
compared with the profits of their main rivals. Which chart should he use?
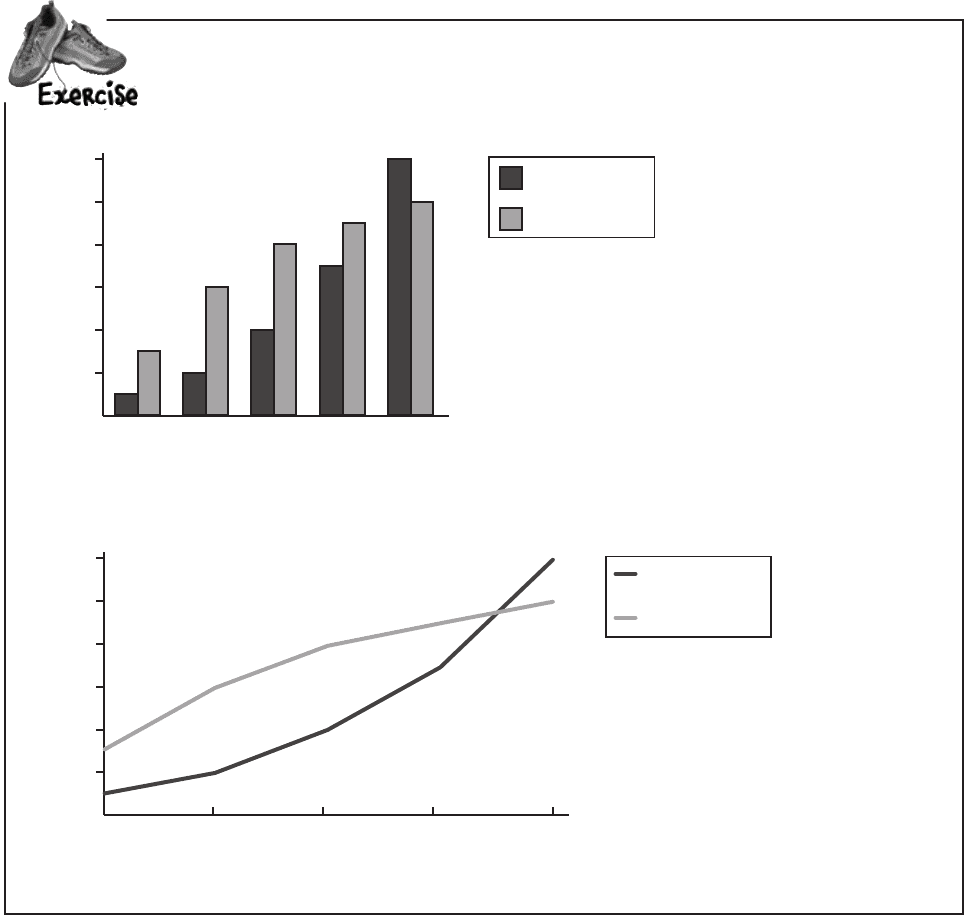
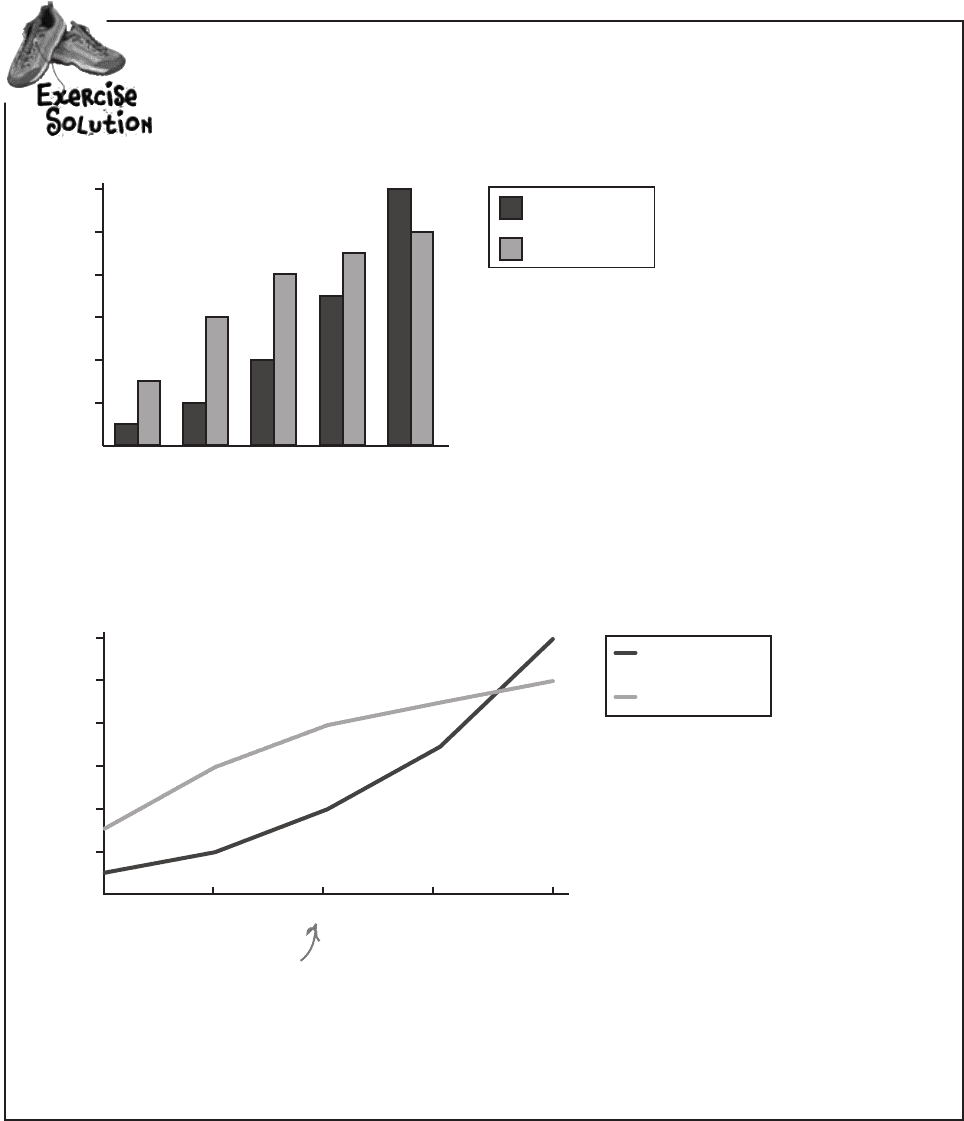
Here are two possible charts that the CEO could use in his keynote. Your
task is to annotate each one, and say what you think the strengths and
weaknesses are of each one relative to the other. Which would you pick?
Profit in dollars
Year
2003 2004 2005 2006 2007
400
0.0
600
500
200
100
300
Competitor
Manic Mango
Profit (thousands)
Profit in dollars
Year
400
0
600
500
200
100
300
Profit (thousands)
2003 2004 2005 2006 2007
Competitor
Manic Mango
40 Chapter 1
Here are two possible charts that the CEO could use in his keynote. Your task is to annotate
each one, and say what you think the strengths and weaknesses are of each one relative to the
other. Which would you pick?
The bar chart does a good job of
comparing the profit on a year-by-year
basis, and it’s great if you want to
compare profits in an individual year. As
an example, we can see that up to 2007,
the competitor made a bigger profit, but
in 2007 Manic Mango did.
A weaknesses of this chart is that if the
CEO suddenly decided to add a third
competitor, it might make the chart a
bit harder to take in at a single glance.
The line chart is better at showing a
trend, the year-on-year profits for each
company. The trend line for each company
is well-defined, which means we easily see
the pattern profits: Manic Mango profits
are climbing well, where its competition
is beginning to slacken off. It would also
be easy to add another company without
swamping the chart.
A weakness is that you can also compare
year-by-year profit, but perhaps the bar
chart is clearer.
We’d choose the line chart, as the
overall trend is clearer than on
the bar chart. But don’t worry if
you chose the other; the chart you
use depends on which key facts you
want to emphasize.
Profit in dollars
Year
2003 2004 2005 2006 2007
400
0.0
600
500
200
100
300
Competitor
Manic Mango
Profit (thousands)
Profit in dollars
Year
400
0
600
500
200
100
300
Profit (thousands)
2003 2004 2005 2006 2007
Competitor
Manic Mango
exercise solution