Greene W.H. Econometric Analysis
Подождите немного. Документ загружается.


APPENDIX B
✦
Probability and Distribution Theory
1019
and
Var[g(x)] =
'
x
g(x) − E [g(x)]
2
f (x) dx. (B-21)
(For convenience, we shall omit the equivalent definitions for discrete variables in the fol-
lowing discussion and use the integral to mean either integration or summation, whichever is
appropriate.)
A device used to approximate E[g(x)] and Var[g(x)] is the linear Taylor series approxi-
mation:
g(x) ≈ [g(x
0
) − g
(x
0
)x
0
] + g
(x
0
)x = β
1
+ β
2
x = g
∗
(x). (B-22)
If the approximation is reasonably accurate, then the mean and variance of g
∗
(x) will be ap-
proximately equal to the mean and variance of g(x). A natural choice for the expansion point is
x
0
= μ = E(x). Inserting this value in (B-22) gives
g(x) ≈ [g(μ) − g
(μ)μ] + g
(μ)x, (B-23)
so that
E[g(x)] ≈ g(μ), (B-24)
and
Var[g(x)] ≈ [g
(μ)]
2
Var[x]. (B-25)
A point to note in view of (B-22) to (B-24) is that E[g(x)] will generally not equal g(E[x]).
For the special case in which g(x) is concave—that is, where g
(x)<0—we know from Jensen’s
inequality that E[g(x)] ≤ g(E[x]). For example, E[log(x)] ≤log(E[x]).
B.4 SOME SPECIFIC PROBABILITY
DISTRIBUTIONS
Certain experimental situations naturally give rise to specific probability distributions. In the
majority of cases in economics, however, the distributions used are merely models of the observed
phenomena. Although the normal distribution, which we shall discuss at length, is the mainstay
of econometric research, economists have used a wide variety of other distributions. A few are
discussed here.
1
B.4.1 THE NORMAL DISTRIBUTION
The general form of the normal distribution with mean μ and standard deviation σ is
f (x |μ, σ
2
) =
1
σ
√
2π
e
−1/2[(x−μ)
2
/σ
2
]
. (B-26)
This result is usually denoted x ∼ N [μ, σ
2
]. The standard notation x ∼ f (x) is used to state that
“x has probability distribution f (x).” Among the most useful properties of the normal distribution
1
A much more complete listing appears in Maddala (1977a, Chapters 3 and 18) and in most mathematical
statistics textbooks. See also Poirier (1995) and Stuart and Ord (1989). Another useful reference is Evans,
Hastings, and Peacock (1993). Johnson et al. (1974, 1993, 1994, 1995, 1997) is an encyclopedic reference on
the subject of statistical distributions.
1020
PART VI
✦
Appendices
is its preservation under linear transformation.
If x ∼ N [μ, σ
2
], then (a + bx) ∼ N [a + bμ, b
2
σ
2
]. (B-27)
One particularly convenient transformation is a =−μ/σ and b =1/σ . The resulting variable
z=(x − μ)/σ has the standard normal distribution, denoted N [0, 1], with density
φ(z) =
1
√
2π
e
−z
2
/2
. (B-28)
The specific notation φ(z) is often used for this distribution and (z) for its cdf. It follows from
the definitions above that if x ∼ N [μ, σ
2
], then
f (x) =
1
σ
φ
x − μ
σ
.
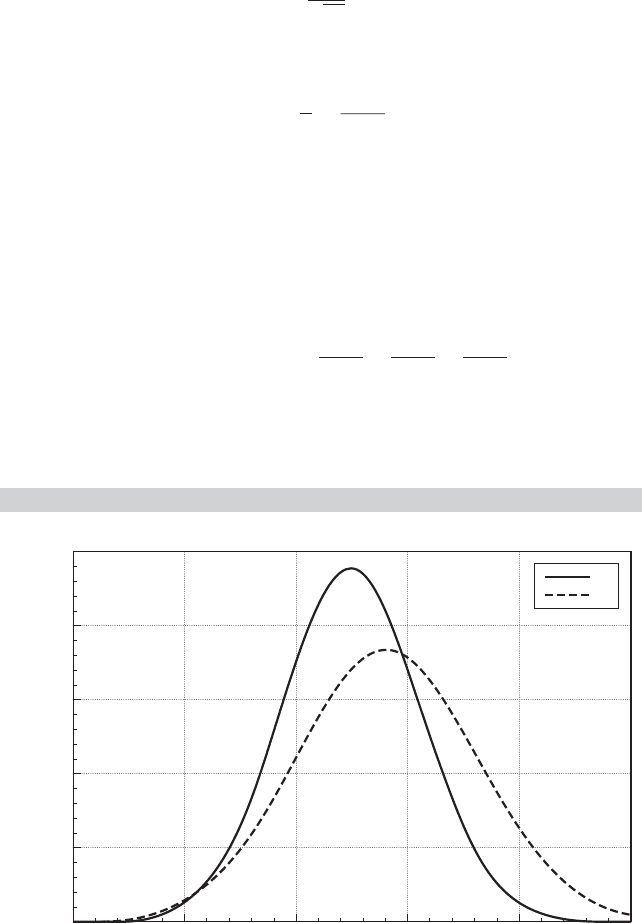
Figure B.1 shows the densities of the standard normal distribution and the normal distribution
with mean 0.5, which shifts the distribution to the right, and standard deviation 1.3, which, it can
be seen, scales the density so that it is shorter but wider. (The graph is a bit deceiving unless you
look closely; both densities are symmetric.)
Tables of the standard normal cdf appear in most statistics and econometrics textbooks.
Because the form of the distribution does not change under a linear transformation, it is not
necessary to tabulate the distribution for other values of μ and σ . For any normally distributed
variable,
Prob(a ≤ x ≤ b) = Prob
a − μ
σ
≤
x − μ
σ
≤
b − μ
σ
, (B-29)
which can always be read from a table of the standard normal distribution. In addition, because
the distribution is symmetric, (−z) = 1 − (z). Hence, it is not necessary to tabulate both the
negative and positive halves of the distribution.
FIGURE B.1
The Normal Distribution.
4.0 0.8 0.8
0.000
0.425
0.340
0.255
0.170
0.085
z
Density
f1Normal[0,1] and f2Normal[.5,1.3] Densities
2.4 4.02.4
f1
f2

APPENDIX B
✦
Probability and Distribution Theory
1021
B.4.2 THE CHI-SQUARED,
t
, AND
F
DISTRIBUTIONS
The chi-squared, t, and F distributions are derived from the normal distribution. They arise in
econometrics as sums of n or n
1
and n
2
other variables. These three distributions have associated
with them one or two “degrees of freedom” parameters, which for our purposes will be the
number of variables in the relevant sum.
The first of the essential results is
•
If z ∼ N[0, 1], then x = z
2
∼ chi-squared[1]—that is, chi-squared with one degree of
freedom—denoted
z
2
∼ χ
2
[1]. (B-30)
This distribution is a skewed distribution with mean 1 and variance 2. The second result is
•
If x
1
,...,x
n
are n independent chi-squared[1] variables, then
n
i=1
x
i
∼chi-squared[n]. (B-31)
The mean and variance of a chi-squared variable with n degrees of freedom are n and 2n, respec-
tively. A number of useful corollaries can be derived using (B-30) and (B-31).
•
If z
i
, i = 1,...,n, are independent N [0, 1] variables, then
n
i=1
z
2
i
∼ χ
2
[n]. (B-32)
•
If z
i
, i = 1,...,n, are independent N [0,σ
2
] variables, then
n
i=1
(z
i
/σ )
2
∼ χ
2
[n]. (B-33)
•
If x
1
and x
2
are independent chi-squared variables with n
1
and n
2
degrees of freedom, re-
spectively, then
x
1
+ x
2
∼ χ
2
[n
1
+ n
2
]. (B-34)
This result can be generalized to the sum of an arbitrary number of independent chi-squared
variables.
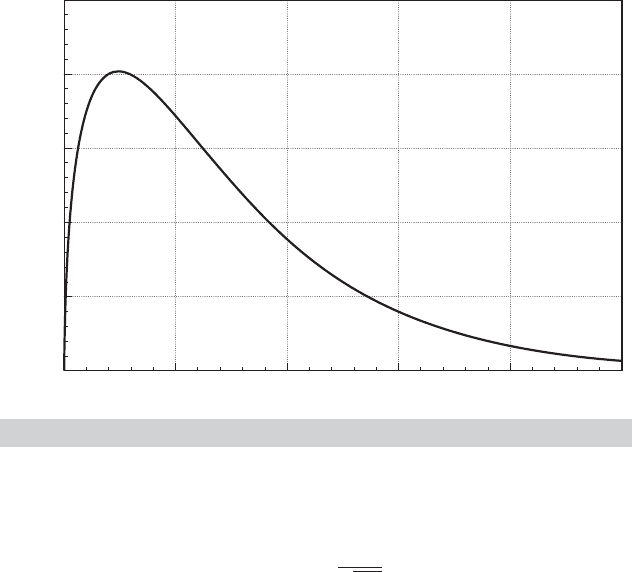
Figure B.2 shows the chi-squared density for three degrees of freedom. The amount of
skewness declines as the number of degrees of freedom rises. Unlike the normal distribution, a
separate table is required for the chi-squared distribution for each value of n. Typically, only a
few percentage points of the distribution are tabulated for each n. The table on the inside back
cover of this book gives lower (left) tail areas for a number of values.
•
If x
1
and x
2
are two independent chi-squared variables with degrees of freedom parameters
n
1
and n
2
, respectively, then the ratio
F [n
1
, n
2
] =
x
1
/n
1
x
2
/n
2
(B-35)
has the F distribution with n
1
and n
2
degrees of freedom.
The two degrees of freedom parameters n
1
and n
2
are the numerator and denominator degrees
of freedom, respectively. Tables of the F distribution must be computed for each pair of values
of (n
1
, n
2
). As such, only one or two specific values, such as the 95 percent and 99 percent upper
tail values, are tabulated in most cases.
1022
PART VI
✦
Appendices
0
0.00
0.30
0.24
0.18
0.12
0.06
24
x
Density
Chi-Squared[3] Density
6810
FIGURE B.2
The Chi-Squared [3] Distribution.
•
If z is an N [0, 1] variable and x is χ
2
[n] and is independent of z, then the ratio
t[n] =
z
√
x/n
(B-36)
has the t distribution with n degrees of freedom.
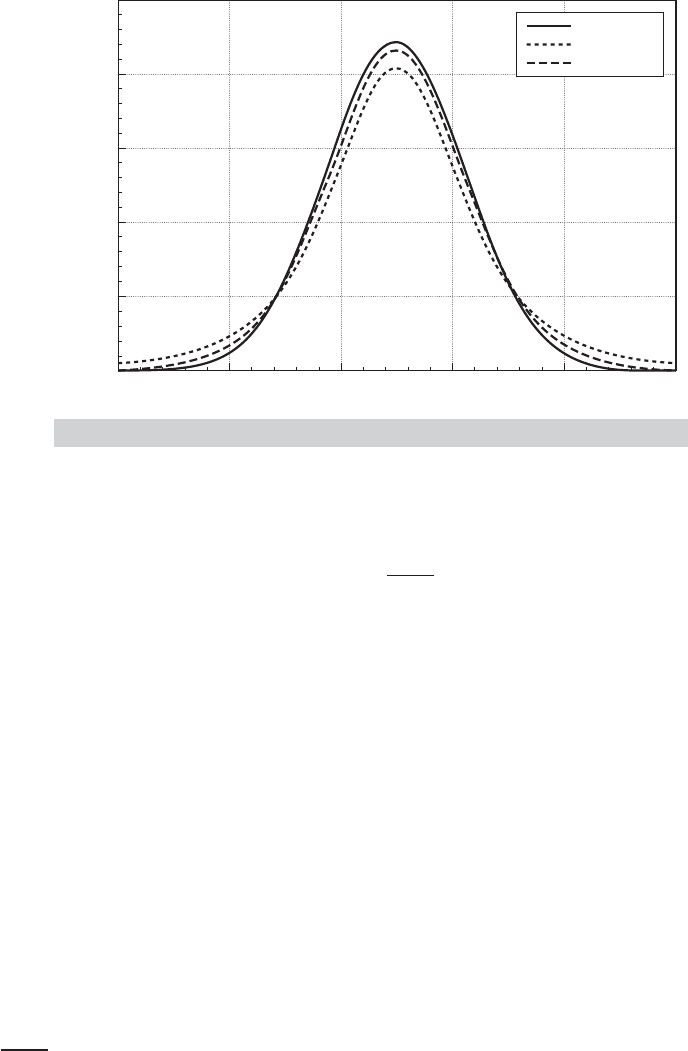
The t distribution has the same shape as the normal distribution but has thicker tails. Figure B.3
illustrates the t distributions with 3 and 10 degrees of freedom with the standard normal distribu-
tion. Two effects that can be seen in the figure are how the distribution changes as the degrees of
freedom increases, and, overall, the similarity of the t distribution to the standard normal. This
distribution is tabulated in the same manner as the chi-squared distribution, with several specific
cutoff points corresponding to specified tail areas for various values of the degrees of freedom
parameter.
Comparing (B-35) with n
1
=1 and (B-36), we see the useful relationship between the t and
F distributions:
•
If t ∼ t[n], then t
2
∼ F[1, n].
If the numerator in (B-36) has a nonzero mean, then the random variable in (B-36) has a non-
central t distribution and its square has a noncentral F distribution. These distributions arise in
the F tests of linear restrictions [see (5-6)] when the restrictions do not hold as follows:
1. Noncentral chi-squared distribution.Ifz has a normal distribution with mean μ and standard
deviation 1, then the distribution of z
2
is noncentral chi-squared with parameters 1 and μ
2
/2.
a. If z ∼ N [μ, ] with J elements, then z
−1
z has a noncentral chi-squared distribution
with J degrees of freedom and noncentrality parameter μ
−1
μ/2, which we denote
χ
2
∗
[J, μ
−1
μ/2].
b. If z ∼ N [μ, I] and M is an idempotent matrix with rank J, then z
Mz ∼ χ
2
∗
[J, μ
Mμ/2].
APPENDIX B
✦
Probability and Distribution Theory
1023
4.0 0.8 0.8
0.00
0.45
0.36
0.27
0.18
0.09
z
Density
Normal[0,1], t[3], and t[10] Densities
2.4 4.02.4
Normal[0,1]
t[3]
t[10]
FIGURE B.3
The Standard Normal,
t
[3], and
t
[10] Distributions.
2. Noncentral F distribution.IfX
1
has a noncentral chi-squared distribution with noncentrality
parameter λ and degrees of freedom n
1
and X
2
has a central chi-squared distribution with
degrees of freedom n
2
and is independent of X
1
, then
F
∗
=
X
1
/n
1
X
2
/n
2
has a noncentral F distribution with parameters n
1
, n
2
, and λ.
2
Note that in each of these
cases, the statistic and the distribution are the familiar ones, except that the effect of the
nonzero mean, which induces the noncentrality, is to push the distribution to the right.
B.4.3 DISTRIBUTIONS WITH LARGE DEGREES OF FREEDOM
The chi-squared, t, and F distributions usually arise in connection with sums of sample observa-
tions. The degrees of freedom parameter in each case grows with the number of observations.
We often deal with larger degrees of freedom than are shown in the tables. Thus, the standard
tables are often inadequate. In all cases, however, there are limiting distributions that we can use
when the degrees of freedom parameter grows large. The simplest case is the t distribution. The
t distribution with infinite degrees of freedom is equivalent to the standard normal distribution.
Beyond about 100 degrees of freedom, they are almost indistinguishable.
For degrees of freedom greater than 30, a reasonably good approximation for the distribution
of the chi-squared variable x is
z = (2x)
1/2
− (2n − 1)
1/2
, (B-37)
which is approximately standard normally distributed. Thus,
Prob(χ
2
[n] ≤ a) ≈ [(2a)
1/2
− (2n − 1)
1/2
].
2
The denominator chi-squared could also be noncentral, but we shall not use any statistics with doubly
noncentral distributions.

1024
PART VI
✦
Appendices
As used in econometrics, the F distribution with a large-denominator degrees of freedom is
common. As n
2
becomes infinite, the denominator of F converges identically to one, so we can
treat the variable
x = n
1
F (B-38)
as a chi-squared variable with n
1
degrees of freedom. The numerator degree of freedom will
typically be small, so this approximation will suffice for the types of applications we are likely to
encounter.
3
If not, then the approximation given earlier for the chi-squared distribution can be
applied to n
1
F.
B.4.4 SIZE DISTRIBUTIONS: THE LOGNORMAL DISTRIBUTION
In modeling size distributions, such as the distribution of firm sizes in an industry or the distribution
of income in a country, the lognormal distribution, denoted LN[μ, σ
2
], has been particularly
useful.
4
f (x) =
1
√
2πσx
e
−1/2[(ln x−μ)/σ ]
2
, x > 0.
A lognormal variable x has
E[x] = e
μ+σ
2
/2
,
and
Var[x] = e
2μ+σ
2
e
σ
2
− 1
.
The relation between the normal and lognormal distributions is
If y ∼ LN[μ, σ
2
], ln y ∼ N [μ, σ
2
].
A useful result for transformations is given as follows:
If x has a lognormal distribution with mean θ and variance λ
2
, then
ln x ∼ N(μ, σ
2
), where μ = ln θ
2
−
1
2
ln(θ
2
+ λ
2
) and σ
2
= ln(1 +λ
2
/θ
2
).
Because the normal distribution is preserved under linear transformation,
if y ∼ LN[μ, σ
2
], then ln y
r
∼ N [rμ, r
2
σ
2
].
If y
1
and y
2
are independent lognormal variables with y
1
∼ LN[μ
1
,σ
2
1
] and y
2
∼ LN[μ
2
,σ
2
2
],
then
y
1
y
2
∼ LN
μ
1
+ μ
2
,σ
2
1
+ σ
2
2
.
B.4.5 THE GAMMA AND EXPONENTIAL DISTRIBUTIONS
The gamma distribution has been used in a variety of settings, including the study of income
distribution
5
and production functions.
6
The general form of the distribution is
f (x) =
λ
P
(P)
e
−λx
x
P−1
, x ≥ 0,λ > 0, P > 0. (B-39)
Many familiar distributions are special cases, including the exponential distribution (P =1) and
chi-squared (λ =
1
2
, P =
n
2
). The Erlang distribution results if P is a positive integer. The mean is
P/λ, and the variance is P/λ
2
.Theinverse gamma distribution is the distribution of 1/x, where x
3
See Johnson, Kotz, and Balakrishnan (1994) for other approximations.
4
A study of applications of the lognormal distribution appears in Aitchison and Brown (1969).
5
Salem and Mount (1974).
6
Greene (1980a).

APPENDIX B
✦
Probability and Distribution Theory
1025
has the gamma distribution. Using the change of variable, y = 1/x, the Jacobian is |dx/dy|=1/y
2
.
Making the substitution and the change of variable, we find
f (y) =
λ
P
(P)
e
−λ/y
y
−(P+1)
, y ≥ 0,λ > 0, P > 0.
The density is defined for positive P. However, the mean is λ/(P − 1) which is defined only if
P > 1 and the variance is λ
2
/[(P − 1)
2
(P − 2)] which is defined only for P > 2.
B.4.6 THE BETA DISTRIBUTION
Distributions for models are often chosen on the basis of the range within which the random
variable is constrained to vary. The lognormal distribution, for example, is sometimes used to
model a variable that is always nonnegative. For a variable constrained between 0 and c > 0, the
beta distribution has proved useful. Its density is
f (x) =
(α + β)
(α)(β)
x
c
α−1
1 −
x
c
β−1
1
c
. (B-40)
This functional form is extremely flexible in the shapes it will accommodate. It is symmetric if
α = β, asymmetric otherwise, and can be hump-shaped or U-shaped. The mean is cα/(α + β),
and the variance is c
2
αβ/[(α +β +1)(α +β)
2
]. The beta distribution has been applied in the study
of labor force participation rates.
7
B.4.7 THE LOGISTIC DISTRIBUTION
The normal distribution is ubiquitous in econometrics. But researchers have found that for some
microeconomic applications, there does not appear to be enough mass in the tails of the normal
distribution; observations that a model based on normality would classify as “unusual” seem not
to be very unusual at all. One approach has been to use thicker-tailed symmetric distributions.
The logistic distribution is one candidate; the cdf for a logistic random variable is denoted
F(x) = (x) =
1
1 + e
−x
.
The density is f (x) = (x)[1 − (x)]. The mean and variance of this random variable are zero
and π
2
/3.
B.4.8 THE WISHART DISTRIBUTION
The Wishart distribution describes the distribution of a random matrix obtained as
W =
n
i=1
(x
i
− μ)(x
i
− μ)
,
where x
i
is the ith of nKelement random vectors from the multivariate normal distribution with
mean vector, μ, and covariance matrix, . This is a multivariate counterpart to the chi-squared
distribution. The density of the Wishart random matrix is
f (W) =
exp
−
1
2
trace
−1
W
|W|
−
1
2
(n−K−1)
2
nK/2
||
K/2
π
K(K−1)/4
5
K
j=1
n + 1 − j
2
.
The mean matrix is n. For the individual pairs of elements in W,
Cov[w
ij
, w
rs
] = n(σ
ir
σ
js
+ σ
is
σ
jr
).
7
Heckman and Willis (1976).
1026
PART VI
✦
Appendices
0.0000
012345
x
67891011
0.2500
0.1875
0.1250
0.0625
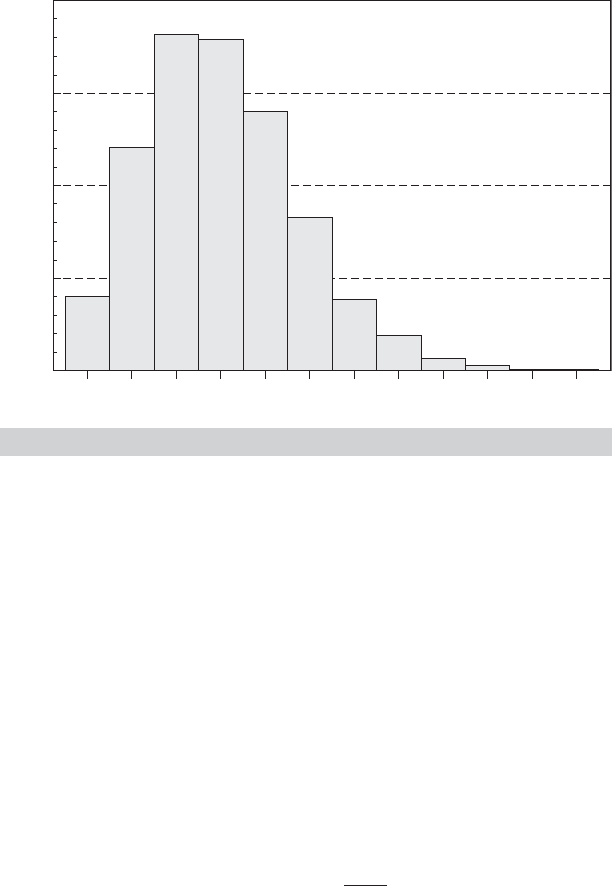
FIGURE B.4
The Poisson [3] Distribution.
B.4.9 DISCRETE RANDOM VARIABLES
Modeling in economics frequently involves random variables that take integer values. In these
cases, the distributions listed thus far only provide approximations that are sometimes quite
inappropriate. We can build up a class of models for discrete random variables from the Bernoulli
distribution for a single binomial outcome (trial)
Prob(x = 1) = α,
Prob(x = 0) = 1 −α,
where 0 ≤α ≤1. The modeling aspect of this specification would be the assumptions that the suc-
cess probability α is constant from one trial to the next and that successive trials are independent.
If so, then the distribution for x successes in n trials is the binomial distribution,
Prob(X = x) =
n
x
α
x
(1 − α)
n−x
, x = 0, 1,...,n.
The mean and variance of x are nα and nα(1 − α), respectively. If the number of trials becomes
large at the same time that the success probability becomes small so that the mean nα is stable,
then, the limiting form of the binomial distribution is the Poisson distribution,
Prob(X = x) =
e
−λ
λ
x
x!
.
The Poisson distribution has seen wide use in econometrics in, for example, modeling patents,
crime, recreation demand, and demand for health services. (See Chapter 18.) An example is
shown in Figure B.4.
B.5 THE DISTRIBUTION OF A FUNCTION
OF A RANDOM VARIABLE
We considered finding the expected value of a function of a random variable. It is fairly common
to analyze the random variable itself, which results when we compute a function of some random
variable. There are three types of transformation to consider. One discrete random variable may
APPENDIX B
✦
Probability and Distribution Theory
1027
be transformed into another, a continuous variable may be transformed into a discrete one, and
one continuous variable may be transformed into another.
The simplest case is the first one. The probabilities associated with the new variable are
computed according to the laws of probability. If y is derived from x and the function is one to
one, then the probability that Y = y(x) equals the probability that X = x. If several values of x
yield the same value of y, then Prob(Y = y) is the sum of the corresponding probabilities for x.
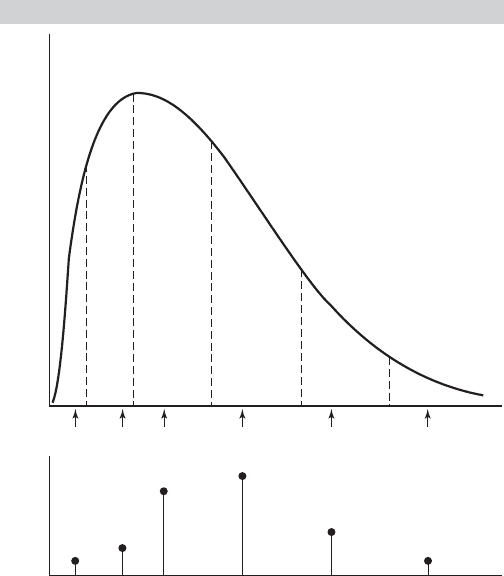
The second type of transformation is illustrated by the way individual data on income are typ-
ically obtained in a survey. Income in the population can be expected to be distributed according
to some skewed, continuous distribution such as the one shown in Figure B.5.
Data are often reported categorically, as shown in the lower part of the figure. Thus, the
random variable corresponding to observed income is a discrete transformation of the actual
underlying continuous random variable. Suppose, for example, that the transformed variable y is
the mean income in the respective interval. Then
Prob(Y = μ
1
) = P(−∞ < X ≤ a),
Prob(Y = μ
2
) = P(a < X ≤ b),
Prob(Y = μ
3
) = P(b < X ≤ c),
and so on, which illustrates the general procedure.
If x is a continuous random variable with pdf f
x
(x) and if y = g(x) is a continuous monotonic
function of x, then the density of y is obtained by using the change of variable technique to find
FIGURE B.5
Censored Distribution.
Density
Relative
frequency
Incomea bc d e
1
2
3
4
5
6
1
2
3
4
5
6
1028
PART VI
✦
Appendices
the cdf of y:
Prob(y ≤ b) =
'
b
−∞
f
x
(g
−1
(y))|g
−1
(y)|dy.
This equation can now be written as
Prob(y ≤ b) =
'
b
−∞
f
y
(y) dy.
Hence,
f
y
(y) = f
x
(g
−1
(y))|g
−1
(y)|. (B-41)
To avoid the possibility of a negative pdf if g(x) is decreasing, we use the absolute value of the
derivative in the previous expression. The term |g
−1
(y)|must be nonzero for the density of y to be
nonzero. In words, the probabilities associated with intervals in the range of y must be associated
with intervals in the range of x. If the derivative is zero, the correspondence y = g(x) is vertical,
and hence all values of y in the given range are associated with the same value of x. This single
point must have probability zero.
One of the most useful applications of the preceding result is the linear transformation of a
normally distributed variable. If x ∼ N[μ, σ
2
], then the distribution of
y =
x − μ
σ
is found using the preceding result. First, the derivative is obtained from the inverse transformation
y =
x
σ
−
μ
σ
⇒ x = σ y + μ ⇒ f
−1
(y) =
dx
dy
= σ.
Therefore,
f
y
(y) =
1
√
2πσ
e
−[(σ y+μ)−μ]
2
/(2σ
2
)
|σ |=
1
√
2π
e
−y
2
/2
.
This is the density of a normally distributed variable with mean zero and unit standard deviation
one. This is the result which makes it unnecessary to have separate tables for the different normal
distributions which result from different means and variances.
B.6 REPRESENTATIONS OF A PROBABILITY
DISTRIBUTION
The probability density function (pdf) is a natural and familiar way to formulate the distribution
of a random variable. But, there are many other functions that are used to identify or characterize
a random variable, depending on the setting. In each of these cases, we can identify some other
function of the random variable that has a one-to-one relationship with the density. We have
already used one of these quite heavily in the preceding discussion. For a random variable which
has density function f (x), the distribution function, F(x), is an equally informative function that
identifies the distribution; the relationship between f (x) and F(x) is defined in (B-6) for a discrete
random variable and (B-8) for a continuous one. We now consider several other related functions.
For a continuous random variable, the survival function is S(x) =1 − F(x) =Prob[X ≥x].
This function is widely used in epidemiology, where x is time until some transition, such as recovery