FitzGerald J., Dennis A., Durcikova A. Business Data Communications and Networking
Подождите немного. Документ загружается.

12.3 CONFIGURATION MANAGEMENT 455
4th-Floor
Wiring Closet
127.00.40.10
3300
CH_Eng_Hub1
127.00.40.20
3300
CH_R&D_Hub
3rd-Floor
Wiring Closet
127.00.30.10
3300
CH_Eng_Hub2
127.00.30.20
3300
CH_HRFIN_Hub
2nd-Floor
Wiring Closet
1st-Floor Computer Room
127.00.20.10
3300
CH_Mktg_Hub
127.00.20.20
CHRAS1
3300
CH_Sales_Hub
Seattle
Dublin
Helsinki
Buenos Aires
Cairo
127.00.10.01
NM_Island_Server CH_Web_Server
127.00.10.16
NM_Reprise _Server CH_Mail_Server
127.00.10.15
CH_Backup_Server CH_Domain_Server
127.00.10.14
NM_Virgin_Server CH_SQL_Server
127.00.10.13
Legend
T1, T3
Fiber
CAT 5
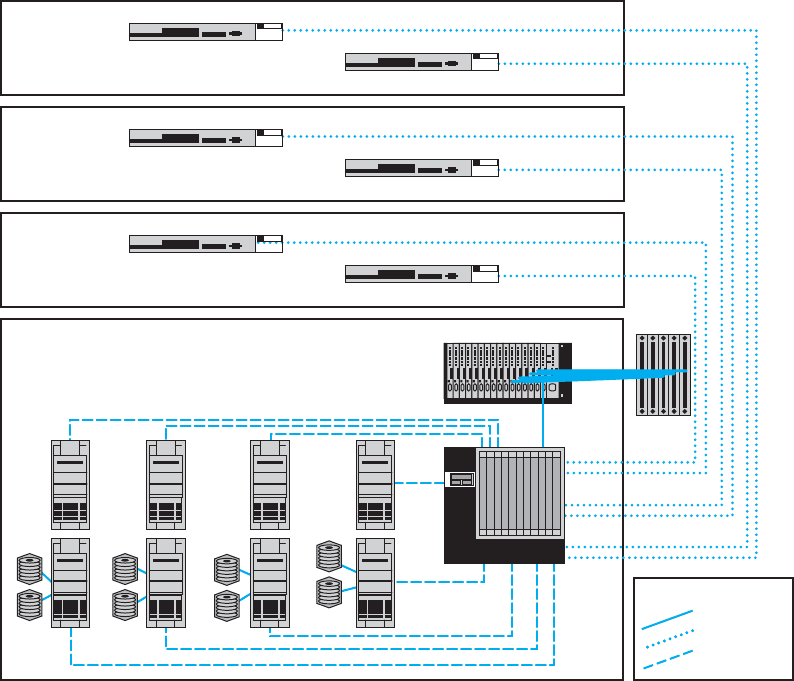
FIGURE 12.1 Network configuration diagram
Source: netViz
from a common carrier), network servers, network devices (e.g., hubs, routers), and client
computers. For most organizations, this is a large set of diagrams: one for each LAN,
BN, and WAN. Figure 12.1 shows a diagram of network devices in one office location.
These diagrams must be supplemented by documentation on each individual net-
work component (e.g., circuit, hub, server). Documentation should include the type of
device, serial number, vendor, date of purchase, warranty information, repair history,
telephone number for repairs, and any additional information or comments the network
manager wishes to add. For example, it would be useful to include contact names and
telephone numbers for the individual network managers responsible for each separate
LAN within the network, and common carrier telephone contact information. (Whenever
possible, establish a national account with the common carrier rather than dealing with
individual common carriers in separate states and areas.)
A similar approach can be used for network software. This includes the network
operating system and any special-purpose network software. For example, it is impor-
tant to record which network operating system with which version or release date is

456 CHAPTER 12 NETWORK MANAGEMENT
installed on each network server. The same is true of application software. As discussed
in Chapter 6 on LANs, sharing software on networks can greatly reduce costs although
it is important to ensure that the organization is not violating any software license rules.
Software documentation can also help in negotiating site licenses for software.
Many users buy software on a copy-by-copy basis, paying the retail price for each copy.
It may be cheaper to negotiate the payment of one large fee for an unlimited use license
for widely used software packages instead of paying on a per-copy basis.
The third type of documentation is the user and application profiles, which should
be automatically provided by the network operating system or additional vendor or
third-party software agreements. These should enable the network manager to easily
identify the files and directories to which each user has access and each user’s access
rights (e.g., read-only, edit, delete). Equally important is the ability to access this infor-
mation in the “opposite” direction; that is, to be able to select a file or directory and
obtain a list of all authorized users and their access rights.
In addition, other documentation must be routinely developed and updated pertain-
ing to the network. This includes network hardware and software manuals, application
software manuals, standards manuals, operations manuals for network staff, vendor con-
tracts and agreements, and licenses for software. The documentation should include
details about performance and fault management (e.g., preventive maintenance guidelines
and schedules, disaster recovery plan, and diagnostic techniques), end user support (e.g.,
applications software manuals, vendor support telephone numbers), and cost management
(e.g., annual budgets, repair costs for each device). The documentation should also include
any legal requirements to comply with local or federal laws, control, or regulatory bodies.
Maintaining documentation is usually a major issue for most organizations. Have
you written programs? How well did you document them? Many technicians hate doc-
umentation because it is not “fun” and doesn’t provide immediate value the same way
that solving problems does. Therefore, it is often overlooked so when someone leaves
the organization, the knowledge of the network leaves with them.
12.4 PERFORMANCE AND FAULT
MANAGEMENT
Performance management means ensuring the network is operating as efficiently as
possible whereas fault management means preventing, detecting, and correcting faults
in the network circuits, hardware, and software (e.g., a broken device or improperly
installed software). Fault management and performance management are closely related
because any faults in the network reduce performance. Both require network monitoring,
which means keeping track of the operation of network circuits and devices to ensure
they are functioning properly and to determine how heavily they are used.
12.4.1 Network Monitoring
Most large organizations and many smaller ones use network management software to
monitor and control their networks. One function provided by these systems is to collect
operational statistics from the network devices. For small networks, network monitoring

12.4 PERFORMANCE AND FAULT MANAGEMENT 457
A Day in the Life: Network Policy Manager
All large organizations have formal policies for the
use of their networks (e.g., wireless LAN access, pass-
word, server space). Most large organizations have a
special policy group devoted to the creation of net-
work policies, many of which are devoted to network
security. The job of the policy officer is to steer the
policy through the policy making process and ensure
that all policies are in the best interests of the organi-
zation as a whole. Although policies are focused inside
the organization, policies are influenced by events both
inside and outside the organization. The policy man-
ager spends a significant amount of time working
with outside organizations such as the U.S. Depart-
ment of Homeland Security, CIO and security officer
groups, and industry security consortiums. The goal is
to make sure all policies (especially security policies)
are up-to-date and provide a good balance between
costs and benefits.
A typical policy begins with networking staff writ-
ing a summary containing the key points of the pro-
posed policy. The policy manager takes the summary
and uses it to develop a policy that fits the structure
required for organizational policies (e.g., date, ratio-
nale, scope, responsible individuals, and procedures).
This policy manager works with the originating staff
to produce an initial draft of the proposed policy. Once
everyone in the originating department and the policy
office are satisfied with the policy, it is provided to
an advisory committee of network users and network
managers for discussion. Their suggestions are then
incorporated in the policy or an explanation is provided
is to why the suggestions will not be incorporated in
the policy.
After several iterations, a policy becomes a draft
policy and is posted for comment from all users within
the organization. Comments are solicited from inter-
ested individuals and the policy may be revised. Once
the draft is finalized, the policy is then presented
to senior management for approval. Once approved,
the policy is formally published, and the organization
charged with implementing the policy begins to use it
to guide their operations.
With thanks to Mark Bruhn
12.4 NETWORK MANAGEMENT SALARIES
MANAGEMENT
FOCUS
Network management is not easy, but it doesn’t pay too badly. Here are some typical
jobs and their respective annual salaries.
Network Vice President $150,000
Network Manager 90,000
Telecom Manager 77,000
LAN Administrator 70,000
WAN Administrator 75,000
Network Designer 80,000
Network Technician 60,000
Technical Support Staff 50,000
Trainer 50,000
458 CHAPTER 12 NETWORK MANAGEMENT
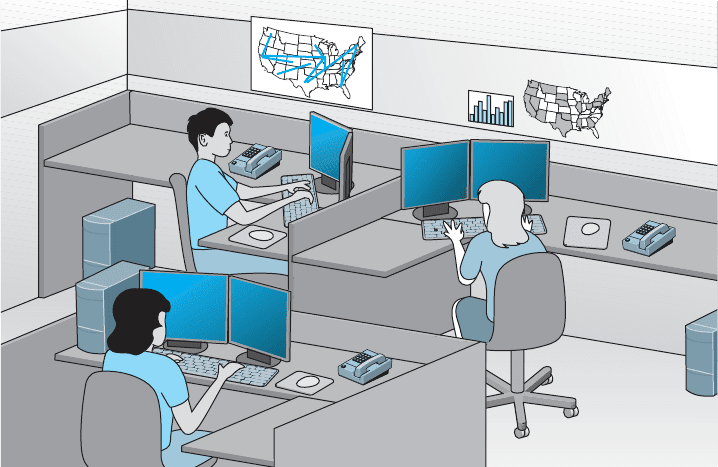
FIGURE 12.2 A network operations center
is often done by one person, aided by a few simple tools (discussed later in this chapter).
These tools collect information and send messages to the network manager’s computer.
In large networks, network monitoring becomes more important. Large networks
that support organizations operating 24 hours a day are often mission critical, which
means a network problem can have serious business consequences. For example, consider
the impact of a network failure for a common carrier such as AT&T or for the air
traffic control system. These networks often have a dedicated network operations center
(NOC) that is responsible for monitoring and fixing problems. Such centers are staffed by
a set of skilled network technicians that use sophisticated network management software.
When a problem occurs, the software immediately detects the problems and sends an
alarm to the NOC. Staff members in the NOC diagnose the problem and can sometimes
fix it from the NOC (e.g., restarting a failed device). Other times, when a device or
circuit fails, they must change routing tables to route traffic away from the device and
inform the common carrier or dispatch a technician to fix or replace it.
Figure 12.2 depicts an NOC similar to one at Indiana University. The NOC at
Indiana University is staffed 24 hours a day, 7 days a week to monitor the univer-
sity’s networks. The NOC also has responsibility for managing portions of several very
high-speed networks including the Abilene Network of Internet2 (see Management Focus
Box 12.5).
The parameters monitored by a network management system fall into two distinct
categories: physical network statistics and logical network information. Gathering
statistics on the physical network parameters includes monitoring the operation of the
network’s modems, multiplexers, circuits linking the various hardware devices, and any
other network devices. Monitoring the physical network consists of keeping track of cir-
cuits that may be down and tracing malfunctioning devices. Logical network parameters
12.4 PERFORMANCE AND FAULT MANAGEMENT 459
include performance measurement systems that keep track of user response times, the
volume of traffic on a specific circuit, the destination of data routed across various
networks, and any other indicators showing the level of service provided by the network.
Some types of management software operate passively, collecting the information
and reporting it back to the central NOC. Others are active, in that they routinely send test
messages to the servers or application being monitored (e.g., an HTTP Web page request)
and record the response times. One common type of monitoring approach is the network
weather map, which displays the usage of all major circuits in the network in real time.
1
Performance tracking is important because it enables the network manager to be
proactive and respond to performance problems before users begin to complain. Poor
network reporting leads to an organization that is overburdened with current problems
and lacks time to address future needs. Management requires adequate reports if it is to
address future needs.
12.4.2 Failure Control Function
Failure control requires developing a central control philosophy for problem reporting,
whether the problems are first identified by the NOC or by users calling in to the NOC
or a help desk. Whether problem reporting is done by the NOC or the help desk, the
organization should maintain a central telephone number for network users to call when
any problem occurs in the network. As a central troubleshooting function, only this group
or its designee should have the authority to call hardware or software vendors or common
carriers.
Many years ago, before the importance (and cost) of network management was
widely recognized, most networks ignored the importance of fault management. Network
devices were “dumb” in that they did only what they were designed to do (e.g., routing
packets) but did not provide any network management information.
For example, suppose a network interface card fails and begins to transmit garbage
messages randomly. Network performance immediately begins to deteriorate because
these random messages destroy the messages transmitted by other computers, which need
to be retransmitted. Users notice a delay in response time and complain to the network
support group, which begins to search for the cause. Even if the network support group
suspects a failing network card (which is unlikely unless such an event has occurred
before), locating the faulty card is very difficult and time consuming.
Most network managers today are installing managed devices that perform their
functions (e.g., routing, switching) and also record data on the messages they process
(see Chapter 12). These data can be sent to the network manager’s computer when the
device receives a special control message requesting the data, or it can send an alarm
message to the network manager’s computer if the device detects a critical situation.
In this way, network faults and performance problems can be detected and reported by
the devices themselves before they become serious. In the case of the failing network
card, a managed device could record the increased number of retransmissions required
to successfully transmit messages and inform the network management software of the
problem. A managed hub or switch might even be able to detect the faulty transmissions
1
One example of network weather maps for the Internet that provides a simple overview is www
.InternetTrafficReport.com.

460 CHAPTER 12 NETWORK MANAGEMENT
12.5 INTERNET2WEATHER MAP
MANAGEMENT
FOCUS
The Abilene network is an Internet2
high-performance backbone that connects
regional gigapops to provide high-speed network
services to over 220 Internet2 university, corpo-
rate, and affiliate member institutions in all 50
states, the District of Columbia, and Puerto Rico.
The current network is primarily an OC-192c (10
Gbps) backbone employing optical transport tech-
nology and advanced high-performance routers.
The network is monitored 24 hours a day,
seven days a week from the network opera-
tions center (NOC) located on the campus of
Indiana University in Indianapolis. The NOC over-
sees problem, configuration, and change manage-
ment; network security; performance and policy
monitoring; reporting; quality assurance; schedul-
ing; and documentation. The center provides a
structured environment that effectively coordi-
nates operational activities with all participants
and vendors related to the function of the network.
The NOC uses multiple network manage-
ment software running across several platforms.
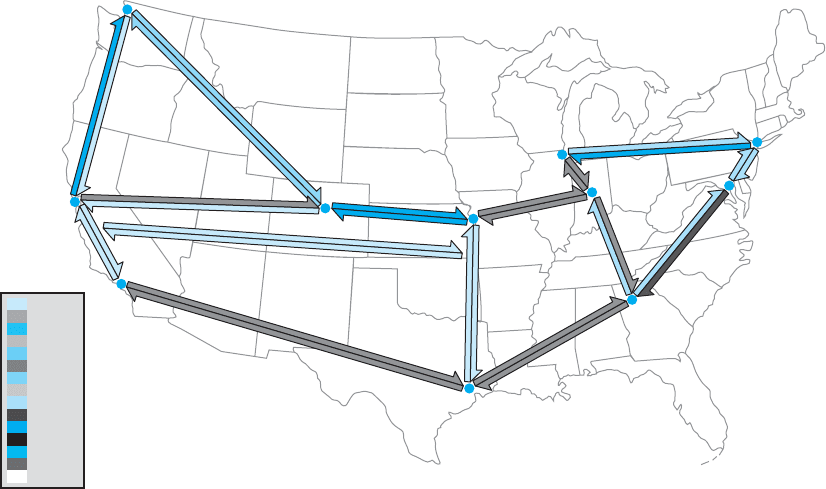
Figure 12.3 shows one of the tools used by the
NOC that is available to the general public: the
Internet2 Weather Map. Each of the major circuits
connecting the major Abilene gigapops is shown
on the map. Each link has two parts, showing the
utilization of the circuits to and from each pair
of gigapops. The links are color-coded to quickly
show the utilization of the link. Figure 12.3 is not
in color so it is difficult to read, but if you visit the
Abilene Web site (the URL is listed below), you
can see that circuits with very low utilization are
different shades of blue, which turn to green and
then yellow and orange as utilization increases
to 10 percent of capacity. Once utilization climbs
above 30 percent, the link is shown in deeper
shades of red and then purple. If you look back
at the photo in Figure 12.2 you’ll see the weather
map displayed on the large screen in the NOC.
The link from the Chicago gigapop to the New
York City gigapop, for example, indicates that over
the last few minutes, an average of 546 Mbps has
been transmitted, giving a 10 percent utilization.
The link from New York City to Chicago shows
that over the last few minutes, an average of 6.2
Gbps has been transmitted, giving a 70 percent
utilization.
If you look carefully at the utilization rates and
percentages, you will see that not all circuits in the
Abilene network were 10 Gbps when this weather
map was done. Currently, the plan is to upgrade
most circuits to 100G.
SOURCE: abilene.internet2.edu.
from the failing network card, disable the incoming circuit so that the card could not
send any more messages, and issue an alarm to the network manager. In either case,
finding and fixing the fault is much simpler, requiring minutes, not hours.
Numerous software packages are available for recording fault information. The
reports they produce are known as trouble tickets. The software packages assist the help
desk personnel so they can type the trouble report immediately into a computerized failure
analysis program. They also automatically produce various statistical reports to track how
many failures have occurred for each piece of hardware, circuit, or software package. Auto-
mated trouble tickets are better than paper because they allow management personnel to
gather problem and vendor statistics. There are four main reasons for trouble tickets: problem
tracking, problem statistics, problem-solving methodology, and management reports.
Problem tracking allows the network manager to determine who is responsible
for correcting any outstanding problems. This is important because some problems often
are forgotten in the rush of a very hectic day. In addition, anyone might request infor-
mation on the status of a problem. The network manager can determine whether the
problem-solving mechanism is meeting predetermined schedules. Finally, the manager
12.4 PERFORMANCE AND FAULT MANAGEMENT 461
175M
STTL
80M
391M
337M
30M
126M
51M
314M
414M
319M
140M
149M
133M
70M
88M
768M
883M
998M
29M
SNVA
DNVR
KSCY
ATLA
HSTN
IPLS
150M
546M
6.2G
818M
527M
NYCM
WASH
477M
227M
999M
<
<
<
<
<
<
<
<
<
<
<
<
<
<
<
0.05%
0.01%
0.05%
0.1%
0.5%
1%
2%
5%
10%
30%
60%
70%
80%
90%
100%
Line Utilization
226M
102M
CHIN
LOSA
347M
FIGURE 12.3 Internet2 Weather Map
can be assured that all problems are being addressed. Problem tracking also can assist
in problem resolution. Are problems being resolved in a timely manner? Are over-
due problems being flagged? Are all resources and information available for problem
solving?
Problem statistics are important because they are a control device for the network
managers as well as for vendors. With this information, a manager can see how well the
network is meeting the needs of end users. These statistics also can be used to determine
whether vendors are meeting their contractual maintenance commitments. Finally, they
help to determine whether problem-solving objectives are being met.
Problem prioritizing helps ensure that critical problems get priority over less impor-
tant ones. For example, a network support staff member should not work on a problem
on one client computer if an entire circuit with dozens of computers is waiting for help.
Moreover, a manager must know whether problem-resolution objectives are being met.
For example, how long is it taking to resolve critical problems?
Management reports are required to determine network availability, product and
vendor reliability (mean time between failures), and vendor responsiveness. Without
them, a manager has nothing more than a “best guess” estimate for the effectiveness of
either the network’s technicians or the vendor’s technicians. Regardless of whether this
information is typed immediately into an automated trouble ticket package or recorded
manually in a bound notebook-style trouble log, the objectives are the same.
The purposes of the trouble log are to record problems that must be corrected and
to keep track of statistics associated with these problems. For example, the log might

462 CHAPTER 12 NETWORK MANAGEMENT
12.1 TECHNICAL REPORTS
TECHNICAL
FOCUS
Technical reports that are helpful to network man-
agers are those that provide summary information,
as well as details that enable the managers to
improve the network. Technical details include:
•
Circuit use
•
Usage rate of critical hardware such as host com-
puters, front-end processors, and servers
•
File activity rates for database systems
•
Usage by various categories of client computers
•
Response time analysis per circuit or per com-
puter
•
Voice versus data usage per circuit
•
Queue-length descriptions, whether in the host
computer, in the front-end processor, or at remote
sites
•
Distribution of traffic by time of day, location, and
type of application software
•
Failure rates for circuits, hardware, and software
•
Details of any network faults
reveal that there were 37 calls for software problems (3 for one package, 4 for another
package, and 30 for a third software package), 26 calls for cable modem problems evenly
distributed among two vendors, 49 calls for client computers, and 2 calls to the common
carrier that provides the network circuits. These data are valuable when the design and
analysis group begins redesigning the network to meet future requirements.
12.4.3 Performance and Failure Statistics
There are many different types of failure and recovery statistics that can be collected.
The most obvious performance statistics are those discussed above: how many packets
are being moved on what circuits and what the response time is. Failure statistics also
tell an important story.
One important failure statistic is availability, the percentage of time the network
is available to users. It is calculated as the number of hours per month the network
is available divided by the total number of hours per month (i.e., 24 hours per day
× 30 days per month = 720 hours). The downtime includes times when the network
is unavailable because of faults and routine maintenance and network upgrades. Most
network managers strive for 99 to 99.5 percent availability, with downtime scheduled
after normal working hours.
The mean time between failures (MTBF) is the number of hours or days of
continuous operation before a component fails. Obviously, devices with higher MTBF
are more reliable.
When faults occur, and devices or circuits go down, the mean time to repair
(MTTR) is the average number of minutes or hours until the failed device or circuit is
operational again. The MTTR is composed of these separate elements:
MTTRepair = MTTDiagnose + MTTRespond + MTTFix
The mean time to diagnose (MTTD) is the average number of minutes until the
root cause of the failure is correctly diagnosed. This is an indicator of the efficiency of
problem management personnel in the NOC or help desk who receive the problem report.

12.4 PERFORMANCE AND FAULT MANAGEMENT 463
12.2 ELEMENTS OF A TROUBLE REPORT
TECHNICAL
FOCUS
When a problem is reported, the trouble log staff
members should record the following:
•
Time and date of the report
•
Name and telephone number of the person who
reported the problem
•
The time and date of the problem (and the time
and date of the call)
•
Location of the problem
•
The nature of the problem
•
When the problem was identified
•
Why and how the problem happened
The mean time to respond (MTTR) is the average number of minutes or hours
until service personnel arrive at the problem location to begin work on the problem.
This is a valuable statistic because it indicates how quickly vendors and internal groups
respond to emergencies. Compilation of these figures over time can lead to a change
of vendors or internal management policies or, at the minimum, can exert pressure on
vendors who do not respond to problems promptly.
Finally, after the vendor or internal support group arrives on the premises, the last
statistic is the mean time to fix (MTTF). This figure tells how quickly the staff is able to
correct the problem after they arrive. A very long time to fix in comparison with the time
of other vendors may indicate faulty equipment design, inadequately trained customer
service technicians, or even the fact that inexperienced personnel are repeatedly sent to
fix problems.
For example, suppose your Internet connection at home stops working. You call
your ISP, and they fix it over the phone in 15 minutes. In this case, the MTTRepair is
15 minutes, and it is hard to separate the different parts (MTTD, MTTR, and MTTF).
Suppose you call your ISP and spend 60 minutes on the phone with them, and they can’t
fix it over the phone; instead, the technician arrives the next day (18 hours later) and
spends one hour fixing the problem. In this case MTTR = 1 hour + 18 hours + 1 hour =
20 hours.
The MTBF can be influenced by the original selection of vendor-supplied equip-
ment. The MTTD relates directly to the ability of network personnel to isolate and
diagnose failures and can often be improved by training. The MTTR (respond) can be
influenced by showing vendors or internal groups how good or bad their response times
have been in the past. The MTTF can be affected by the technical expertise of internal
or vendor staff and the availability of spare parts onsite.
Another set of statistics that should be gathered are those collected daily by the
network operations group, which uses network management software. These statistics
record the normal operation of the network, such as the number of errors (retransmissions)
per communication circuit. Statistics also should be collected on the daily volume of
transmissions (characters per hour) for each communication circuit, each computer, or
whatever is appropriate for the network. It is important to closely monitor usage rates,
the percentage of the theoretical capacity that is being used. These data can identify

464 CHAPTER 12 NETWORK MANAGEMENT
12.3 MANAGEMENT REPORTS
TECHNICAL
FOCUS
Management-oriented reports that are helpful to
network managers and their supervisors provide
summary information for overall evaluation and for
network planning and design. Details include:
•
Graphs of daily/weekly/monthly usage, number of
errors, or whatever is appropriate to the network
•
Network availability (uptime) for yesterday, the
last 5 days, the last month, or any other specific
period
•
Percentage of hours per week the network is
unavailable because of network maintenance and
repair
•
Fault diagnosis
•
Whether most response times are less than or
equal to 3 seconds for online real-time traffic
•
Whether management reports are timely and con-
tain the most up-to-date statistics
•
Peak volume statistics as well as average volume
statistics per circuit
•
Comparison of activity between today and a sim-
ilar previous period
computers/devices or communication circuits that have higher-than-average error or usage
rates, and they may be used for predicting future growth patterns and failures. A device
or circuit that is approaching maximum usage obviously needs to be upgraded.
Such predictions can be accomplished by establishing simple quality control
charts similar to those used in manufacturing. Programs use an upper control limit
and a lower control limit with regard to the number of blocks in error per day or per
week. Notice how Figure 12.4 identifies when the common carrier moved a circuit from
one microwave channel to another (circuit B), how a deteriorating circuit can be located
and fixed before it goes through the upper control limit (circuit A) and causes problems
for the users, or how a temporary high rate of errors (circuit C) can be encountered when
installing new hardware and software.
012345678910111213141516
0
500
800
1100
2000
Weeks
Number of blocks in error
Circuit C had
new hardware/software
implemented here
Circuit B moved to
a new microwave
channel
Circuit A is
deteriorating
Upper control
limit (1,100)
Lower control
limit (500)
C
A
B
FIGURE 12.4 Quality
control chart for circuits