FitzGerald J., Dennis A., Durcikova A. Business Data Communications and Networking
Подождите немного. Документ загружается.

EXERCISES 475
EXERCISES
12-1. What factors might cause peak loads in a net-
work? How can a network manager determine if
they are important and how are they taken into
account when designing a data communications
network?
12-2. Today’s network managers face a number of
demanding problems. Investigate and discuss
three major issues.
12-3. Research the networking budget in your organi-
zation and discuss the major cost areas. Discuss
several ways of reducing costs over the long term.
12-4. Explore the Internet2 weather map at abilene
.internet2.edu.
12-5. Do the puzzle on the next page.
Down
5. A measure of cost effectiveness that includes direct and indirect costs
9. The first step in network design is to examine user ______
11. A device that sends requests to different servers in a cluster
15. A measure of cost effectiveness that focuses only on direct costs
16. This form of encryption has two keys
17. One of the most common security threats
18. This fixes a security hole
19. A device that prevents power loss
21. The document asking vendors to bid on a proposal
24. A non-technical way to get someone's password
25. Storing your content on other people's servers
Across
16
10
19
18
20 21 22
23
24
25
11 12 13 14
15
17
1 2 3
4 5 6 7
8 9
1. The average time it takes to fix
a broken device
2. Documenting the network is
part of ______ management
3. A system to prevent intrusion
4. A contract with a common
carrier always has this
6. A strong encryption standard
7. This device limits the amount
of network capacity available
to a user
8. Denial of service
10. Storing other people’s Web
content on your network
12. Obsolete encryption standard
13. The highest level of security is
to check something you ____
14. Staff working in this
organization monitor
the network
18. Using email to trick users into
revealing their password
20. This form of encryption
has one key
22. The largest single part of a
networking budget is
the cost of _____
23. A network management
standard

476 CHAPTER 12 NETWORK MANAGEMENT
MINI-CASES
I. City School District, Part 1
City School District is a large, urban school district that operates 27 schools serving 22,000 students from
kindergarten through grade 12. All schools are networked into a regional WAN that connects the schools to the
district central office and each other. The district has a total of 5,300 client computers. The table below shows
the annual costs. Calculate the real TCO (without wasted time).
Budget Item Annual Cost
IT Staff Salaries $7,038,400
Consultants 1,340,900
Software 657,200
Staff training 545,900
Client computers 2,236,600
Servers 355,100
Network 63,600
Supplies and parts 2,114,700
II. City School District, Part 2
Read and complete Mini-case I above. Examine the TCO by category. Do you think that this TCO indicates a
well-run network? What suggestions would you have?
III. Central Textiles
Central Textiles is a clothing manufacturer that operates 16 plants throughout the southern United States and in
Latin America. The Information Systems Department, which reports to the vice president of finance, operates
the central mainframe and LAN at the headquarters building in Spartanburg, South Carolina, and the WAN
that connects all the plants. The LANs in each plant are managed by a separate IT group at each plant that
reports to the plant manager (the plant managers report to the vice president of manufacturing). The telephone
communications system and long-distance agreements are managed by a t elecommunications department in the
headquarters that reports to the vice president of finance. The CEO of Central Textiles has come to you asking
about whether this is the best arrangement, or whether it would make more sense to integrate the three functions
under one new department. Outline the pros and cons of both alternatives.
IV. Internet2
Reread Management Focus 12.5. If the weather map shown in Figure 12.3 is a typical traffic pattern for Internet2,
how would you suggest that they improve performance?

HANDS-ON ACTIVITY 12A 477
CASE STUDY
NEXT-DAY AIR SERVICE
See the Web site.
HANDS-ON ACTIVITY 12A
Network Monitoring
One of the key tasks of network management is mon-
itoring the network to make sure everything is running
well. There are many effective network monitoring tools
available and several have demonstrations you can view
on the Web. One of my favorites is solarwinds.net. They
have a live demonstration of their network management
software available at npm.solarwinds.net.
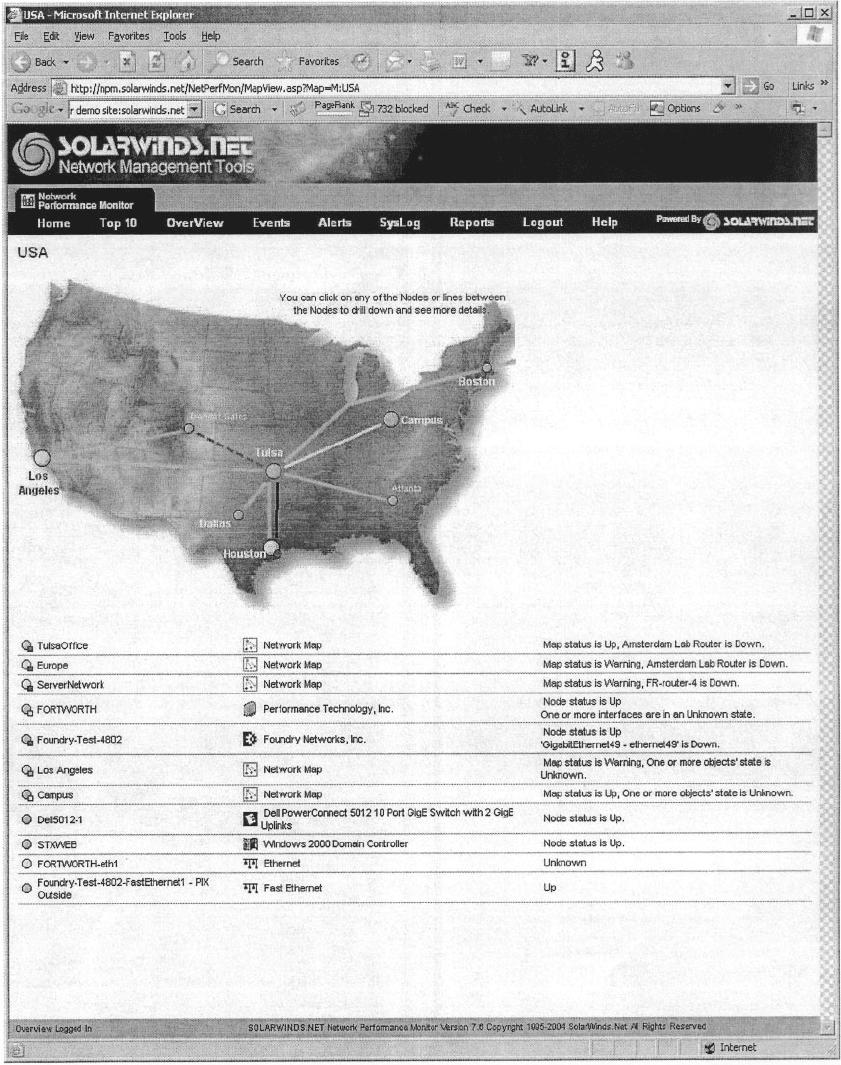
Once you arrive at their page you can select which
part of their network to examine. Figure 12.10 shows the
U.S. portion of the network. It shows a map of the net-
work with circuits and locations color coded to show their
status (green for good, yellow for some problems, and red
for major problems), although the colors are hard to see in
the figure. You can click on a circuit, a city, or a link on
the bottom of the page to obtain more information about
that part of the network.
The Tulsa Office shows green on the map, with a small
red box next to it in the more detailed listing below the
map. This indicates that the network is operating well, but
that there is minor trouble with some part of the network
that is not having a major impact.
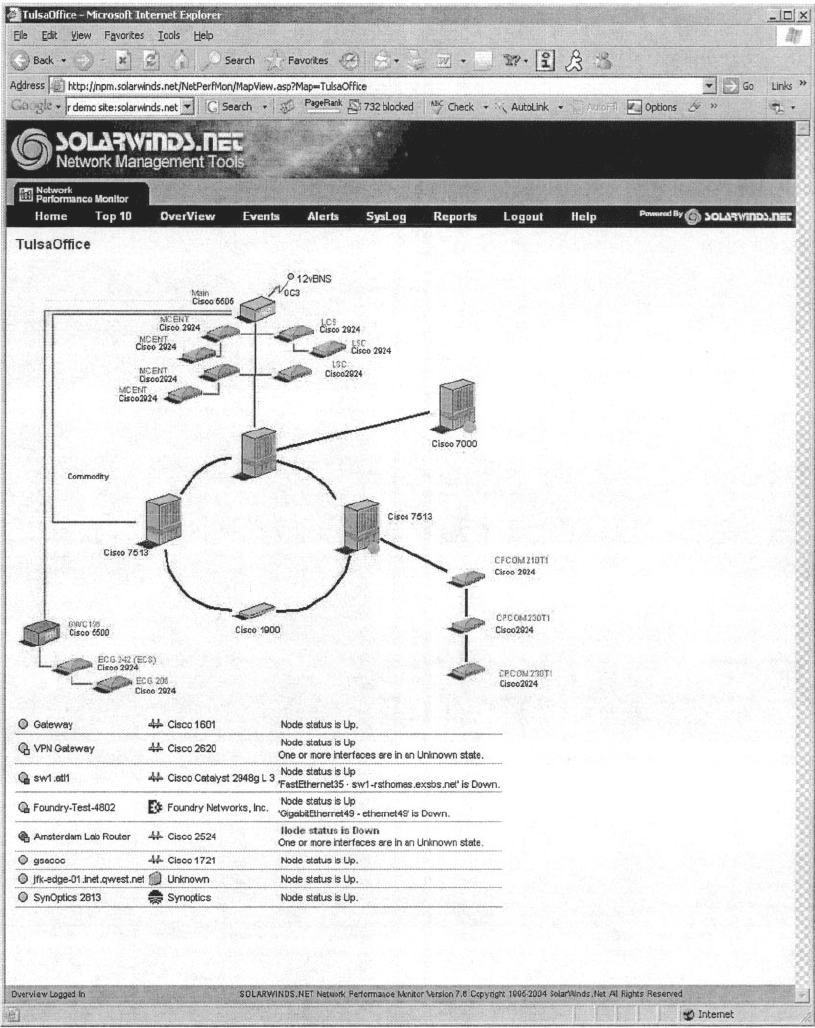
Figure 12.11 shows what happened when I clicked on
the Tulsa Office. We now see the details of the network
in Tulsa. It has a set of switches and routers, all of which
are green, except the Amsterdam Lab Router (GWC198)
which is shown in bright red (although it’s hard to see the
real colors from this figure). The table below the network
map also says that the router is down, again in bright red
letters, in addition to a red bullet in front of the line.
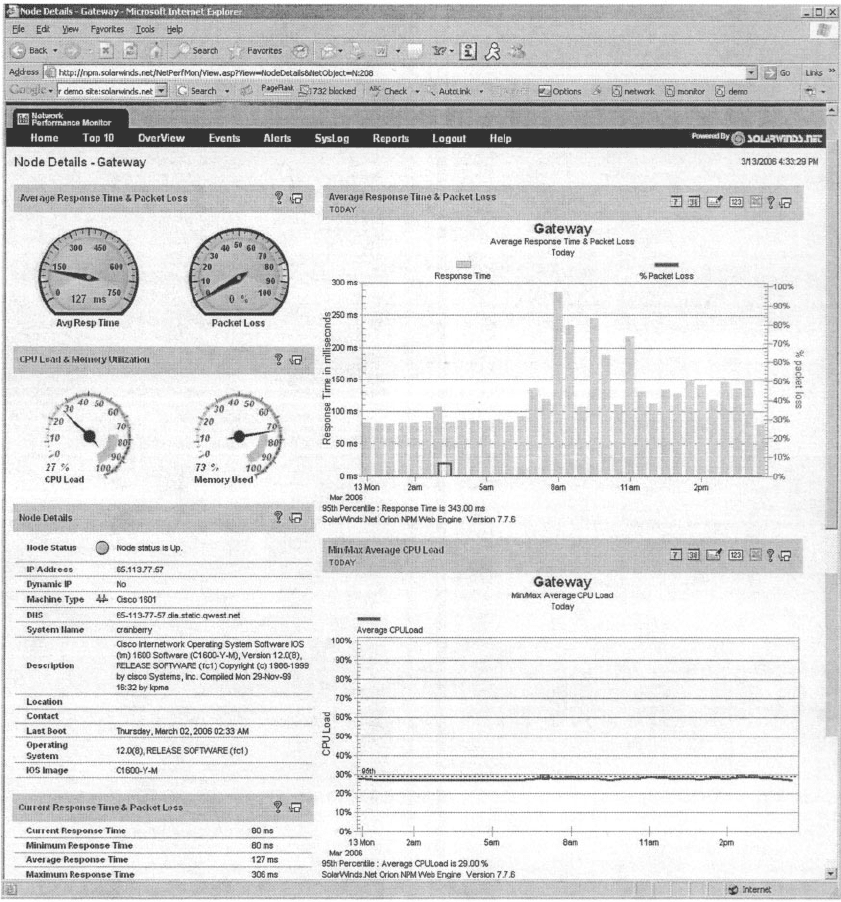
You can click on any device in the picture or in the
table to obtain more information about it. Figure 12.12
shows the status of the Gateway Router which connects
the Tulsa Office to the 12vBNS network at the top of the
display. At first glance, you can see the four “dashboard
gauges” that show that response time is good at below
150 milliseconds, that there is no noticeable packet loss,
that the CPU load is good at less than 30 percent, and
that memory usage is hitting the high level at almost
75 percent. Memory usage is not yet a problem, but
it’s probably time to plan for a memory upgrade before
the device begins to have problems from running out of
memory.
The two graphs in this figure show data over the past
12 hours for comparison. The first graph shows a few
spikes in response time in the morning (a Monday morn-
ing) as people returning from the weekend begin reading
email, but nothing that would be a problem. Likewise,
between 2 a.m. and 5 a.m., something happened to cause
some packet loss but it was not substantial (major thunder-
storms swept through Tulsa overnight, so they may have
been to blame). The second graph shows that the CPU
load was fairly constant over the last 12 hours, always
below 30 percent.
The rest of the display shows additional informa-
tion about the device, such as what it is (a Cisco 1601
router), what version of the operating system it is running
(12.0(8)), its IP address (65.113.77.57), and when it was
last booted (2:33 a.m., March 2, 2006).
Deliverables
1. What is the general status of the Boston location
right now?
2. Are there any problems in the Boston location? If
so, describe them.
3. Pick one of the devices in Boston. How has
response changed over the past 24 hours?
478 CHAPTER 12 NETWORK MANAGEMENT
FIG URE 12.10 Solarwinds.net network monitoring software
HANDS-ON ACTIVITY 12A 479
FIG URE 12.11 Status of the Tulsa office
480 CHAPTER 12 NETWORK MANAGEMENT
FIG URE 12.12 Information about the Gateway router

Part Five
APPENDICES

APPENDIX A
CONNECTOR CABLES
When a message leaves a computer and begins to move onto the network, the first
component it encounters is the connector cable between the computer and the circuit.
When people discuss connector cables, the focus is on the standards (such as RS232 or
RS449).
A.1 RS232 (DB-25)/RS449 (DB-9)
When people talk about connector cables, they frequently refer to them as a RS232,
DB-25, RS449, or DB-9. This is because each connector cable is based on a specified
standard. Calling the connector by its standard designation allows everyone to know
precisely which connector is being discussed.
The RS232 standard is the most frequently mentioned. It was first issued in 1962,
and its third revision, RS232C, was issued in 1969. The RS232D standard was issued in
1987 to expand on RS232C. The RS232D standard is also known as the EIA-232-D.
The RS232 connector cable is the standard interface for connecting data terminal
equipment (DTE) to data circuit terminating equipment (DCE). The newer RS232D is speci-
fied as having 25 wires and using the DB-25 connector plug like the one used on computers.
If this connector cable is attached to a computer, people may refer to it simply as DB-25; if
it is not attached to a computer, they may refer to it as the RS232 interface.
DTE comprises the data source, the data sink, or both. In reality, it is any piece of
equipment at which a data communications path begins or ends, such as a terminal. DCE
provides all the functions required to establish, maintain, and terminate a connection.
This includes signal conversion and coding between the DTE and the common carrier’s
circuit, including the modem. A modem is DCE.
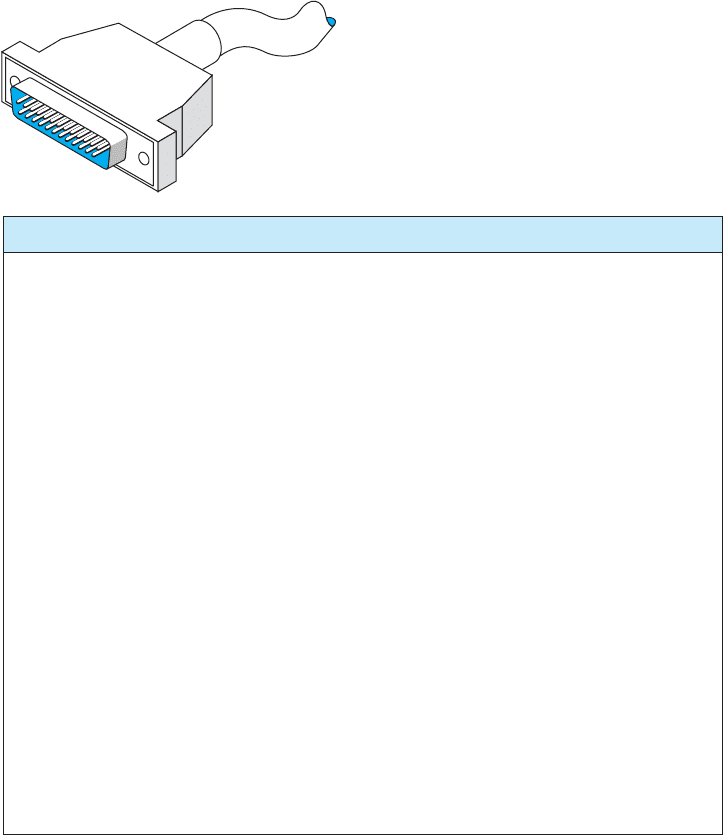
Figure A.1 shows a picture of the RS232D interface plug and describes each of its
25 protruding pins. It is the standard connector cable (25 wires/pins) that passes control
signals and data between the terminal (DTE) and the modem (DCE). This standard
has been supplied by the Electronic Industries Association (EIA). Outside the United
States, this RS232D connector cable is known as the V.24 and V.28. The V.24 and V.28
standards have been accepted by the international standards group known as the ITU-T.
These standards provide a common description of what the signal coming out of and
going into the serial port of a computer or terminal looks like electrically. Specifically,
RS232 provides for a signal changing from a nominal +12 volts to a nominal −12 volts.
The standard also defines the cables and connectors used to link data communications
devices. This is the cable that connects an external modem to your computer.
A.1 RS232 (DB-25)/RS449 (DB-9) 483
PinCircuit Name
1
2
3
4
5
6
7
8
9
10
11
12
13
14
15
16
17
18
19
20
21
22
23
24
25
Shield
Transmitted data
Received data
Request to send
Clear to send
DCE ready
Signal ground
Received line signal detector
(Reserved for testing)
(Reserved for testing)
(Unassigned)
Secondary received line signal detector/data signal rate select (DCE source)
Secondary clear to send
Secondary transmitted data
Transmitter signal element timing (DCE source)
Secondary received data
Receiver signal element timing (DCE source)
Local loopback
Secondary request to send
DTE ready
Remote loopbacks/signal quality detector
Ring indicator
Data signal rate select (DTE/DCE source)
Transmitter signal element timing (DTE source)
Text mode
FIGURE A.1 RS232 cable specifications. DCE = data circuit terminating equipment;
DTE = data terminal equipment
The RS232 has a maximum 50-foot cable length, but it can be increased to 100 feet
or more by means of a special low-capacitance, extended-distance cable. This is not
advised, however, because some vendors may not honor maintenance agreements if the
cable is lengthened beyond the 50-foot standard.
In illustration, we present the cable distances for Texas Instruments’ products. The
cable length of the RS232 varies according to the speed at which you transmit. For Texas
484 APPENDIX A CONNECTOR CABLES
Instruments, the connector cable length can be up to 914 meters (1 meter = 1.1 yards)
when transmitting at 1,200 bps, 549 meters when transmitting at 2,400 bps, 244 meters
when transmitting at 4,800 bps, and 122 meters when transmitting at 9,600 bps. When
end users operate equipment at maximum distances, it is important to remember that
they must meet the restrictions on all types of equipment used, including the electrical
environment, cable construction, and cable wiring. This means that when you want to
operate at a maximum cable distance, you must contact the computer and/or modem
vendors to obtain their maximum cable distance before you proceed.
The RS449 standard has been adopted as U.S. Federal Standard 1031. The RS449 is
shown in Figure A.2. A 4,000-foot cable length can be used, there are 37 pins instead of
25 (useful for digital transmission), and various other circuit functions have been added,
such as diagnostic circuits and digital circuits. In addition, secondary channel circuits
(reverse channel) have been put into a separate 9-pin connector known as a DB-9. The
serial port on your microcomputer may be either a DB-9 or a DB-25.
For some of the new features, look at pin 32 (Select standby). With this pin, the
terminal can instruct the modem to use an alternate standby network such as changing
from a private leased line to a public packet network, either for backup or simply to
access another database not normally used. In other words, a terminal can be connected
to two different networks, and the operator can enter a keyboard command to switch the
connection from one network to another. With regard to loopback pins 10 and 14, the
terminal can allow basic tests without special test equipment or the manual exchanging
of equipment or cables.
With microcomputers, the RS232 and RS449 also are referred to as D-type con-
nectors. As stated above, the RS232 may be called a DB-25, and the 9-pin RS449 may
be called a DB-9. Look at Figure A.3 to see the computer pin configurations for these
two connectors.
There are also X.20 and X.21 interface cables. The X.20 interface is for asyn-
chronous communications, and the X.21 is for synchronous communications. Each is
based on only 15 pins (wires) connecting the DTE and the DCE; the presence of fewer
pins requires an increased intelligence in both the DTE and the DCE. X.20 and X.21 are
international standards intended to provide an interface with the X.25 packet switching
networks discussed elsewhere in this book.
Another option that may become available in the near future is a fiber-optic cable
in place of the standard RS232 electrical cables. Currently, by using fiber-optic cable,
we can locate a computer 1,000 meters (3,280 feet) from a server. With a 1,000-meter
fiber-optic cable, these products can communicate at speeds ranging from 19,200 bps to
twice that speed. Therefore, you get not only greater distance (1,000 meters) but also
greater speed. This may be another example in which fiber optics eventually will replace
electronics.
The high-speed serial interface (HSSI) is beginning to appear in new products. HSSI
defines the physical and electrical interface between the DTE and the DCE equipment. It
was developed by Cisco Systems of Menlo Park, California, and T3plus of Santa Clara,
California. They have submitted it to the American National Standards Institute, which
also formalized the EIA-232 and V.35 standards. HSSI allows data transfers over the
connector cable at 52 million bps, whereas RS-449 cannot handle more than 10 million
bps. HSSI is a 50-pin connector using shielded twisted-pair cabling.