Everitt B.S. The Cambridge Dictionary of Statistics
Подождите немного. Документ загружается.

characteristic of an empirical distribution
^
f formed on the basis of a random sample drawn
from f . The
bootstrap
is a direct application of this principle. [MV2 Chapter 9.]
PMR: Abbreviation for proportionate mortality ratio .
Point^biserial correlation: A special case of
Pearson’s product moment correlation coefficient
used when one variable is continuous (y) and the other is a binary variable (x) representing a
natural dichotomy. Given by
r
pb
¼
y
1
y
0
s
y
ffiffiffiffiffi
pq
p
where
y
1
is the sample mean of the y variable for those individuals with x ¼ 1,
y
0
is the
sample mean of the y variable for those individuals with x ¼ 0, s
y
is the standard deviation of
the y values, p is the proportion of individuals with x ¼ 1 and q ¼ 1 p is the proportion of
individuals with x ¼ 0. See also biserial correlation. [KA2 Chapter 26.]
Point estimate: See estimate .
Point estimation: See estimation.
Point prevalence: See prevalence.
Point proce ss: A
stochastic process
concerned with the occurrence of events at points of time or
space determined by some chance mechanism. [Point Processes, 1994, D. R. Cox and
V. Isham, Chapman and Hall/CRC Press, London.]
Point process data: A set of ordered numbers to be thought of as the times of events that occurred
in some time interval, say ð0; TÞ. Usual examples are the times of telephone calls and the
times of particle emission by some radioactive material. [Point Processes, 1994, D. R. Cox
and V. Isham, Chapman and Hall/CRC Press, London.]
d
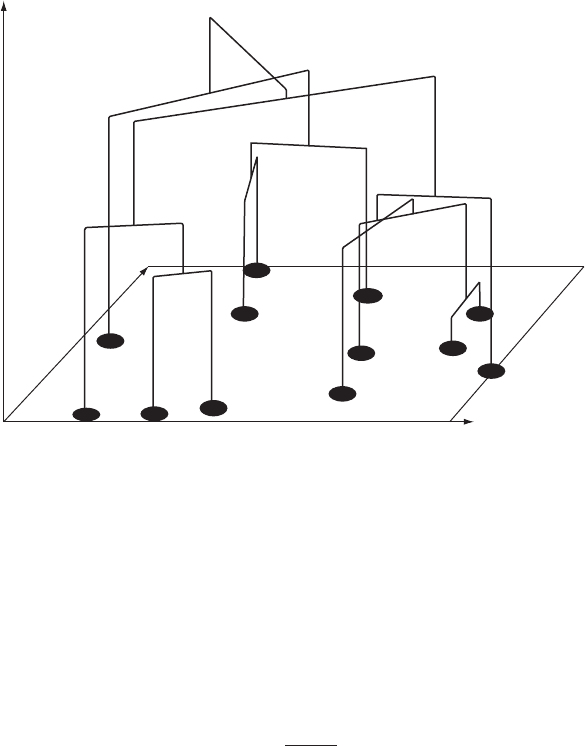
Fig. 105 Combining the output of a hierarchical cluster analysis and a two-dimensional plot. (Taken
from Data Science, Classification and Related Methods, 1998, with permission of the publishers,
Springer.)
329

Point scoring: A simple
distribution free method
that can be used for the prediction of a response that
is a binary variable from the observations on a number of explanatory variables which are
also binary. The simplest version of the procedure, often called the Burgess method, operates
by first taking the explanatory variables one at a time and determining which level of each
variable is associated with the higher proportion of the ‘success’ category of the binary
response. The prediction score for any individual is then just the number of explanatory
variables at the high level (usually only variables that are ‘ signifi cant’ are included in the
score). The score therefore varies from 0, when all explanatory variables are at the low level,
to its maximum value when all the significant variables are at the high level. The aim of the
method is to divide the population into risk groups. See also prognostic scoring system.
Poisson distribution: The probability distribution of the number of occurrences, X, of some
random event, in an interval of time or space. Given by
PrðX ¼ xÞ¼
e
l
l
x
x!
; x ¼ 0; 1; ...
The mean and variances of the distribution are both l. The
skewness
of the distribution is
1=
ffiffiffi
l
p
and its
kurtosis
is 3 þ1=l. The distribution is positively skewed for all values of l.
[STD Chapter 31.]
Poisson homogeneity test: See index of dispersion.
Poisson process: A
point process
with independent increments at constant intensity, say l. The
count after time t has therefore a
Poisson distribution
with mean lt.[Point Processes, 1994,
D. R. Cox and V. Isham, Chapman and Hall/CRC Press, London.]
Poissonregression: A method for the analysis of the relationship between an observed count with a
Poisson distribution
and a set of explanatory variables. [American Statistician, 1981, 35 ,
262–3.]
Poisson,Sime
´
on Denis (1781^1840): Born in Pithiviers, France, Poisson first studied medicine
and then turned to mathematics studying under
Laplace
and Lagrange. He became professor
at the École Polytechnique in 1806. Undertook research in celestial mechanics, electro-
magnetism as well as probability where his major work was Recherches sur la probabilité
des jugements en matiere criminelle et en matiere civile. This book contains the germ of the
two things now most commonly associated with Poisson’s name, the
Poisson distribution
and a generalization of the Bernoulli
law of large numbers
. Poisson died on 25 April 1840.
Poisson-stopped-sum distributions: Probability distributions arising as the distribution of
the sum of N independent and identically distributed random variables, where N is a random
variable with a
Poisson distribution
.[Univariate Discrete Distributions, 1992, N. Johnson,
S. Kotz and A. W. Kemp, Wiley, New York.]
Poker tests: A special frequency test for combinations of five or more digits in a random number.
Counts of ‘busts’, ‘pairs,’‘two pairs,’‘threes,’‘full house,’ etc. are tested against expected
frequencies of these occurrences. [Handbook of Parametric and Nonparametric Statistical
Procedures,4
th
edition, 2007, D.Sheskin, Chapman and Hall/CRC, Boca Raton.]
Polishing: An iterative process aimed at producing a set of residuals from a linear regression analysis
that show no relationship to the explanatory variable.
Po litz ^ Simmons technique: A method for dealing with the ‘not-at-home’ problem in household
interview surveys. The results are weighted in accordance with the proportion of days the
respondent is ordinarily at home at the time he or she was interviewed. More weight is given
330

to respondents who are seldom at home, who represent a group with a high non-response
rate. See also probability weighting.[Sampling Techniques, 3rd edition, 1977, W. G.
Cochran, Wiley, New York.]
Polya
´
distri bution: See beta-binomial distribution .
P oly ch otomous var ia bl es: Strictly variables that can take more than two possible values, but
since this would include all but binary variables, the term is conventionally used for
categorical variables with more than two categories. [Categorical Data Analysis, 1990,
A. Agresti, Wiley, New York.]
Polynomial regression: A linear model in which powers and possibly cross-products of explan-
atory variables are included. For example
E ð yj xÞ¼β
0
þ β
1
x þβ
2
x
2
[SMR Chapter 11.]
Polynomial trend: A trend of the general form
y ¼ β
0
þ β
1
t þ β
2
t
2
þþβ
m
t
m
often fitted to a
time series
.
P olyno mia l-t ri go nomet ric regressi on: A form of regression analysis in which the proposed
model relating the response variable y to an explanatory variable x is
E ð yj xÞ¼β
0
þ
X
d
j¼1
β
j
x
j
þ
X
l
j¼1
fc
j
cosðjxÞþs
j
sinðjxÞg
To fit a data set with such a model, values must be chosen for d and l. Typically d is fixed, for
example, d ¼ 2, so that a low-order polynomial is included in the regression. The parameter
l, which defines the number of sine and cosine terms, is then manipulated to obtain a suitable
amount of smoothing. The coefficients, β
0
; β
1
; ...; β
d
; c
1
; ...; c
l
; s
1
; ...; s
l
are estimated by
least squares. See also kernel regression smoothing and spline function.[Journal of the
Royal Statistical Society, Series A, 1977, 140,411–31.]
Poly-W eibul l distri bution: The probability distribution of the minimum of m independent random
variables X
1
; ...; X
m
each having a
Weibull distribution
. Given by
f ðxÞ¼
X
m
j¼1
γ
j
x
γ
j
1
β
γ
j
j
exp
X
m
k¼1
x
β
k
γ
k
()
x
4
0
where γ
i
and β
i
are parameters of the Weibull distribution associated with X
i
.[Journal of the
American Statistical Association, 1993, 88, 1412–18.]
PO PS: Abbreviation for principal oscillation pattern analysis.
Population: In statistics this term is used for any finite or infinite collection of ‘units’, which are often
people but may be, for example, institutions, events, etc. See also sample.
P opu l at i onaveraged models: Models for
clustered data
in which the marginal expectation of the
response variable is the primary focus of interest. An alternative approach is to use
subject-
specific models
which concentrate on the modelling of changes in an individual’s response.
This is accomplished by introducing subject-specific random effects into the model. A
mixed effects model
or
multilevel model
is an example. There are two key points which
differentiate the two types of model.
331
*
The regression coefficients of a population averaged model describe what the average
population response looks like. By contrast the regression coefficients of a subject-
specific model describe what the average individual’s response curve looks like. In
many cases and in particular when the model is linear in the subject-specific effects,
the two interpretations will coincide. In the more general non-linear setting, however,
the two approaches can lead to very different conclusions.
*
A further distinction lies in the specification of the underlying variance–covariance
struct ure. In population averaged models the marginal expectati ons are expli citly
modelled while choosing a variance–covariance structure that adequately describes
the correlation pat tern among the r epeated measurements. In subject-specific mod-
els, however, individual heterogeneity is modelled using subject-specific effects and
it is these random effects which partially determine the variance–covariance
structure.
See also clustered data, generalized estimating equations and mixed-effects logistic
regression.[Analysis of Longitudinal Data, 2nd edition, 2002, P. Diggle, P. J. Heagerty,
K.-Y. Liang and S. Zeger, Oxford Science Publications, Oxford.]
Population genetics: The study of the distributions of genes in populations across space and time,
and the factors that influence these distributions. [Statistics in Human Genetics, 1998,
P. Sham, Arnold, London.]
P opu l ati o n g rowth models: Models intended for forecasting the growth of human populations.
In the short term simple geometric or exponential growth models of the form
P
t
¼ P
0
ð1 þrÞ
t
or P
t
¼ P
0
e
rt
where P
0
is population at time 0, P
t
is population at time t, r is the growth rate and t is time,
can be reasonably accurate. In the long term, however, it is clear that populations cannot
grow exponentially. The most common currently used methods are based on controlling
explicitly for fertility, mortality and migration. The
Leslie matrix model
is the basis of most
such computational procedures for making projections. [Mathematical Models for the
Growth of Human Populations, 1973, J. H. Pollard, Cambridge University Press,
Cambridge.]
Population projection matrix: See Leslie matrix model.
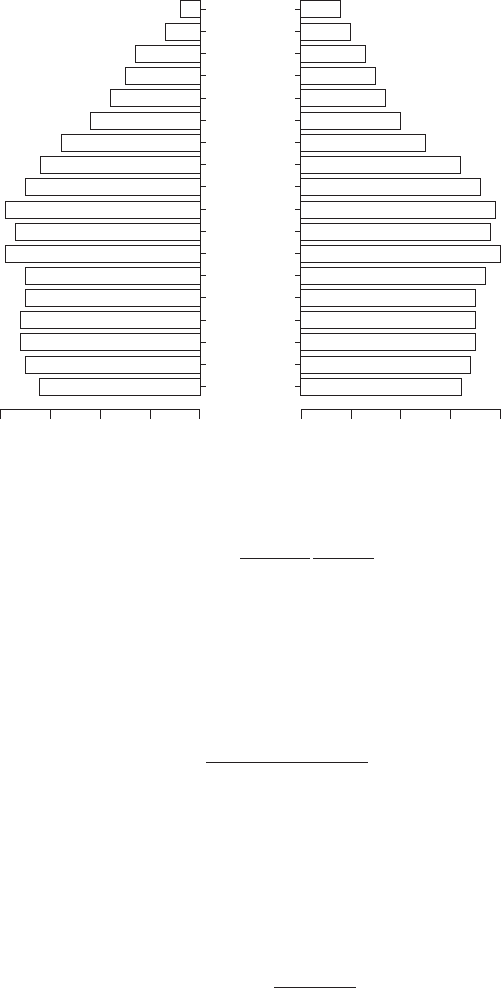
Population pyramid: A diagram designed to show the comparison of a human population by sex
and age at a given time, consisting of a pair of histograms, one for each sex, laid on their
sides with a common base. The diagram is intended to provide a quick overall comparison of
the age and sex structure of the population. A population whose pyramid has a broad base
and narrow apex has high fertility. Changing shape over time reflects the changing compo-
sition of the population associated with changes in fertility and mortality at each age. The
example in Fig. 106 shows population pyramids for men and women in Australia in 2002.
[A Workbook in Demography, 1974, R. Pressat, Methuen, London.]
P opu l at i on wei g hting ad j ustments: A procedure for making estimates of the quantities of
interest in a sample survey representative of a given population rather than the one actually
sampled. [Research in Higher Education, 2008, 49, 153–171.]
P ortmanteau tests: Tests for assessing the fit of models for
time series
in the presence of
outliers
.
[Computational Statistics, 1994, 9, 301–10.]
Positive bi nomial distri bution: A probability distribution that arises from the
binomial distribu-
tion
by omission of the zero value. Given explicitly as
332
PrðX ¼ xÞ¼
n!
x!ðn xÞ!
p
x
q
nx
ð1 q
n
Þ
x ¼ 1; 2; ...; n
[Univariate Discrete Distributions, 2005, N. L. Johnson, A. W. Kemp and S. Kotz, Wiley,
New York.]
Positive hypergeometric distribution: A probability distribution that arises from the
hyper-
geometric distribution
by omission of the zero value. Given explicitly by
PrðX ¼ xÞ¼
r
x
N r
n x
N
n
N r
n
x ¼ 1; ...; minðn; rÞ
[Univariate Discrete Distributions, 2005, N. L. Johnson, A. W. Kemp and S. Kotz, Wiley,
New York.]
PositivePoissondistribution: A probability distribution that arises from the
Poisson distribution
by omission of the zero value; for example, because the observational apparatus becomes
active only when at least one event occurs. Given explicitly by
PrðX ¼ xÞ¼
e
l
l
x
x!ð1 e
l
Þ
x ¼ 1; 2; ...
[Univariate Discrete Distributions, 2005, N. L. Johnson, A. W. Kemp and S. Kotz, Wiley,
New York.]
P ositive predictive val ue: The probability that a person having a positive result on a
diagnostic
test
actually has a particular disease. See also negative predictive value. [SMR Chapter 4.]
Australian population pyramid 2002
Male FemaleAge
85+
80–44
75–79
70–74
65–69
60–64
55–59
45–49
50–54
40–44
35–39
30–34
25–29
20–24
15–19
10–14
5–9
0–4
432
234
1
1
0
0
%
%
Fig. 106 Example of population pyramids; men and women in Australia.
333

Positive skewness: See skewness.
Positive synergism: See synergism.
Post-enumeration survey: A survey composed of a sample of census enumerations and a sample
of the population. The two samples are based on a common area sample of census blocks and
of housing units within blocks. Used in making
dual system estimates
.
Posterior distributions: Probability distributions that summarize information about a random
variable or parameter after, or a posteriori to, having obtained new information from
empirical data. Used almost entirely within the context of
Bayesian inference
. See also
prior distributions. [KA2 Chapter 31.]
Posteriorpredictive checks: An approach to assessing model fit when using
Bayesian inference
.
Measures of discrepancy between the estimated model and the data are constructed and their
posterior predictive distribution compared to the discrepancy observed for the dataset.
[Annals of Statistics, 1984, 12, 1151–1172.]
Posterior probability: See Bayes’ theorem.
Post-hoc comparisons: Analyses not explicitly planned at the start of a study but suggested by an
examination of the data. Such comparisons are generally performed only after obtaining a
significant overall F value. See also multiple comparison procedures, sub-group analy-
sis, data dredging and planned comparisons.
Poststratification: The classification of a simple random sample of individuals into strata after
selection. In contrast to a conventional
stratified sampling
, the stratum sizes here are random
variables. [Statistician, 1991, 40, 315–23.]
Poststratification adjustment: One of the most frequently used
population weighting adjust-
ments
used in complex surveys, in which weights for elements in a class are multiplied by a
factor so that the sum of the weights for the respondents in the class equals the population
total for the class. The method is widely used in household surveys to control the weighted
sample totals to known population totals for certain demographic subgroups. For example,
in the US National Health Interview Survey, poststratification by age, sex and race is
employed. [International Statistical Review, 1985, 53, 221–38.]
Potthoff and Whitlinghill’s test: A test for the existence of
disease clusters
.[Biometrika,
1966, 53, 167 –82.]
Potthoff test: A conservative test for equality of the locations of two distributions when the under-
lying distributions differ in shape. [Biometrika, 1966, 53, 1183–90.]
Power: The probability of rejecting the null hypothesis when it is false. Power gives a method of
discriminating between competing tests of the same hypothesis, the test with the higher
power being preferred. It is also the basis of procedures for estimating the sample size
needed to detect an effect of a particular magnitude. [SMR Chapter 8.]
Power divergence statistics: Generalized measures of the ‘distance’ between a vector of
estimated proportions, p
0
¼½p
1
...; p
r
and the vector of the corresponding ‘true’ values
p
0
¼½p
1
; ...; p
r
. The general form of such measures is
I
l
ðp; pÞ¼
1
lðl þ1Þ
X
r
i¼1
p
i
p
i
p
i
l
1
"#
This is known as the directed divergence of order l. The usual
chi-squared statistic
corresponds to l ¼ 1, the deviance is the limit as l ! 0 and the
Freeman–Tukey test
to
l ¼0:5. [Journal of the Royal Statistical Society, Series B, 1984, 46, 440–64.]
334

Power exponential distribution: A probability distribution, f (x) given by
f ðxÞ¼
1
G 1 þ
1
2β
2
1þ
1
2β
exp
1
2
j
x
j
2β
; 1
5
5
1; 0
5
; 0
5
β 1
See also multivariate power exponential distribution.[Communications in Statistics,
A27, 589–600.]
Power function distribution: A
beta distribution
with β ¼ 1.
Power law process: A technique often used to model failure data from repairable systems, for
which the expected number of failures by time t is modelled as
MðtÞ¼ðαtÞ
γ
The expected rate of occurrence of failures, dM ðtÞ=dt is given by
αγðαtÞ
γ1
If γ
4
1 this increases with time, as often happens with aging machinery, but if γ
5
1it
decreases and so the model can be applied to reliability growth as well as systems that
deteriorate with age. [Water Resources Research, 1997, 33, 1567–83.]
Power spectrum: A function, hð!Þ,defined on p ! p for a
stationary time series
, which has
the following properties;
1. The function hð!Þ defines the amount of ‘power’ or the contribution to the total
variance of the time series made by the frequencies in the band ½!; !!
2. Harmonic components with finite power produce spikes hð!Þ.
3. For real series the spectrum is symmetric, hð!Þ¼hð!Þ.
The function hð!Þ is related to the
autocovariance function
, γðkÞ, of the series by
hð!Þ¼
1
2p
X
1
k¼1
γðkÞcos k! p ! p
The implication is that all the information in the autocovariance is also contained in the
spectrum and vice versa. As an example, consider a
white noise process
in which the
autocovariances are zero apart from the first which is
2
,sohð!Þ¼
2
=2p, i.e. a ‘flat ’
spectrum. See also harmonic analysis and spectral analysis.[Applications of Time Series
Analysis in Astronomy and Meteorology, 1997, edited by T. Subba Rao, M. B. Priestley and
O. Lessi, Chapman and Hall/CRC Presss, London.]
Power transfer function: See linear filters.
Power transformation: A transformation of the form y ¼ x
m
.
P^P plot: Abbreviation for probability–probability plot.
Pragmatic analysis: See explanatory analysis.
Precision: A term applied to t he likely spread of estimates of a par ameter in a sta tistical model.
Measured by the inverse of the standard deviati on of the es timator; this can be
decreased, and hence precision i ncreased, by using a larger s ample size. [SMR
Chapter 2.]
Precision matrix: A synonym for concentration matrix.
Pred ictor variab les: Synonym for explanatory variables.
335

Prentice criterion: A criterion for assessing the validity of a
surrogate endpoint
in a
clinical trial
,in
the sense that the test based on the surrogate measure is a valid test of the hypothesis of
interest about the true end point. Specifically the criterion is that of the
conditional inde-
pendence
of the treatment and the true end point, given the surrogate end point. [Statistics in
Medicine, 1989, 8, 431–40.]
PRESS statistic: A measure of the generalizability of a model in a regression analysis based on the
calculation of
residuals
of the form
^
e
ðiÞ
¼ y
i
^
y
ðiÞ
where y
i
is the observed value of the response variable for observation i and ^y
ðiÞ
is the
predicted value of the response variable for this observation found from the fitted regression
equation calculated from the data after omitting the observation. From these residuals a
multiple correlation coefficient
type of statistic is obtained as
R
2
PRESS
¼ 1
X
n
i¼1
^
e
2
ðiÞ
X
n
i¼1
ðy
i
yÞ
2
This can be used to assess competing models. [ARA Chapter 7.]
Prev al ence: A measure of the number of people in a population who have a particular disease at a
given point in time. Can be measured in two ways, as point prevalence and period
prevalence, these being defined as follows;
point prevalence ¼
number of cases at a particular moment
number in population at that moment
period prevalence ¼
number of cases during a specified time period
number in population at midpoint of period
Essentially measures the amount of a disease in a population. See also incidence. [SMR
Chapter 14.]
Preventedfraction: A measure that can be used to attribute protection against disease directly to an
intervention. The measure is given by the proportion of disease that would have occurred
had the intervention not been present in the population, i.e.
PF ¼
PAI PI
PAI
where PAI is the risk of disease in the absence of the intervention in the population and PI is
overall risk in the presence of the intervention. See also attributable risk.[Statistics in
Medicine, 1995, 14,51–72.]
Prevention trials:
Clinical trials
designed to test treatments preventing the onset of disease in
healthy subjects. An early example of such a trial was that involving various whooping-
cough vaccines in the 1940s. [Controlled Clinical Trials, 1990, 11, 129–46.]
Prevosti’s distance: A measure of genetic distance between two populations P and Q based upon,
but not restricted to, the difference between the frequencies of chromosomal arrangements in
each population. It is defined as
D
p
¼
1
2r
X
r
j¼1
X
k
j
i¼1
jp
ji
q
ji
j
where r is the number of chromosomes or loci and p
ji
and q
ji
are the probabilities of
chromosomal arrangement or allele i in the chromosome or locus of populations P and Q
336
respectively. The distance is estimated in the obvious way by replacing probabilities with
observed sample frequencies. The distance has been used in studies of chromosome poly-
morphism as well as in other fields such as anthropology and sociology. [Annual Review of
Anthropology, 1985, 14, 343–73.]
Prewhitening: A term for transformations of
time series
intended to make their spectrum more nearly
that of a
white noise process
. [TMS Chapter 7.]
P rinc ipa l co m pone nts an alysis: A procedure for analysing
multivariate data
which transforms
the original variables into new ones that are uncorrelated and account for decreasing
proportions of the variance in the data. The aim of the method is to reduce the dimensionality
of the data. The new variables, the principal components, are defined as linear functions of
the original variables. If the first few principal components account for a large percentage of
the variance of the observations (say above 70%) they can be used both to simplify
subsequent analyses and to display and summarize the data in a parsimonious manner.
See also factor analysis. [MV1 Chapter 2.]
P rinc ipa l com ponen ts regressi on anal ysi s: A procedure often used to overcome the
problem of
multicollinearity
in regression, when simply deleting a number of the
explanatory variables is not considered appropriate. Essentially the response variable is
regressed on a small number of principal component scores resulting from a
principal
components analysis
of the explanatory variables. [ARA Chapter 9.]
P rinc ipa l coo rd in ates a n alysi s: Synonym for classical scaling.
Principal curve: A smooth, one-dimensional curve that passes through the middle of a q-dimensional
data set; it is nonparametric, and its shape is suggested by the data. [Annals of Statistics,
1996, 24, 1511–20.]
Principal factor analysis: A method of
factor analysis
which is essentially equivalent to a
principal
components analysis
performed on the
reduced covariance matrix
obtained by replacing the
diagonal elements of the sample
variance–covariance matrix
with estimated communalities.
Two frequently used estimates of the latter are (a) the square of the
multiple correlation
coefficient
of the ith variable with all other variables, (b) the largest of the absolute values of
the correlation coefficients between the ith variable and one of the other variables. See also
maximum likelihood factor analysis.[Applied Multivariate Data Analysis, 2nd edition,
2001, B. S. Everitt and G. Dunn, Edward Arnold, London.]
Principal Hessiandirections: A method based on the
Hessian matrix
of a regression function that
can be effective for detecting and visualizing nonlinearities. [Journal of the American
Statistical Association, 1992, 87, 1025–39.]
Principal oscillation pattern analysis (POPS): A method for isolating spatial patterns with a
strong temporal dependence, particularly in the atmospheric sciences. Based on the assump-
tion of a first-order
Markov chain
.[Journal of Climate, 1995, 8, 377–400.]
Principal points: Points
1
;
2
; ...;
k
which minimize the expected squared distance of a p-variate
random variable x from the nearest of the
i
.[Statistics and Computing, 1996, 6, 187–90.]
Principal stratification: A me thod for adjusting for a response variable C that is intermediate on
the causal pathway from a treatment to the final response y. C has potential outcomes C(1)
and C(0), respectively, when a unit is assigned treatment 1 or 0 (see
Neyman -Rubin
causal model
). A common mistake is to treat C
OBS
, the observed value of C,asifitwere
a covariate and conduct analysis stratified on C
OBS
.Thecorrectapproachistostratifyon
the principal strata (C(1),C(0)), latent classes which are unaffected by treatment
337
assignment and can hence be tr eated as a vector covariate. An important example is
modelling of causal effects taking complia nce into consideration, where C represents
compliance status. [Biom etrics, 2002, 58,21–29.]
Prior distributions: Probability distributions that summarize information about a random variable
or parameter known or assumed at a given time point, prior to obtaining further information
from empirical data. Used almost entirely within the context of
Bayesian inference
. In any
particular study a variety of such distributions may be assumed. For example, reference
priors represent minimal prior information; clinical priors are used to formalize opinion of
well-informed specific individuals, often those taking part in the trial themselves. Finally,
sceptical priors are used when large treatment differences are considered unlikely. See also
improper prior distribution, Jeffreys prior distribution and posterior distributions .
[KA2 Chapter 3.]
Probabilistic distance measures: Distance measures for two classes or groups (G
1
and G
2
)
based on their conditional probability density functions, PrðxjG
1
Þ and PrðxjG
2
Þ. Such
distance functions satisfy the following conditions
*
D ¼ 0if PrðxjG
1
Þ¼PrðxjG
2
Þ
*
D 0
*
D attains its maximum value when the classes are disjoint, i.e., when PrðxjG
1
Þ¼0
and PrðxjG
2
Þ 6¼ 0. An example of such a distance measure is
Bhattacharyya’s dis-
tance
.[Statistical Pattern Recognition, 1999, A. Webb, Arnold, London.]
Pr o bab ilisti c match ing: A technique developed to maximize the accuracy of linkage decisions
based on the level of agreement and disagreement between the identifiers on different
records in data bases. Used in
record linkage
applications when there are no unique personal
identifiers present. [Handbook of Record Linkage, 1988, H. B. Newcombe, Oxford
University Press, New York.]
Probability: A measure associated with an event A and denoted by PrðAÞwhich takes a value such that
0 PrðAÞ1. Essentially the quantitative expression of the chance that an event will
occur. In general the higher the value of PrðAÞthe more likely it is that the event will occur. If
an event cannot happen PrðAÞ¼0; if an event is certain to happen PrðAÞ¼1. Numerical
values can be assigned in simple cases by one of the following two methods:
(1) If the
sample space
can be divided into subsets of n (n 2) equally likely outcomes
and the event A is associated with r (0 r n) of these, then PrðAÞ¼r=n.
(2) If an experiment can be repeated a large number of times, n, and in r cases the event A
occurs, then r=n is called the relative frequency of A. If this leads to a limit as n !1,
this limit is PrðAÞ.
See also addition rule for probabilities, personal probabilities, and law of large num-
bers. [KA1 Chapter 8.]
Probability density: See probability distribution.
Probability distribution: For a discrete random variable, a mathematical formula that gives the
probability of each value of the variable. See, for example,
binomial distribution
and
Poisson
distribution
. For a continuous random variable, a curve described by a mathematical formula
which specifies, by way of areas under the curve, the probability that the variable falls within
a particular interval. Examples include the normal distribution and the
exponential distri-
bution
. In both cases the term probability density may also be used. (A distinction is
sometimes made between ‘density’ and ‘distribution’, when the latter is reserved for the
probability that the random variable falls below some value. In this dictionary, however, the
338