Everitt B.S. The Cambridge Dictionary of Statistics
Подождите немного. Документ загружается.

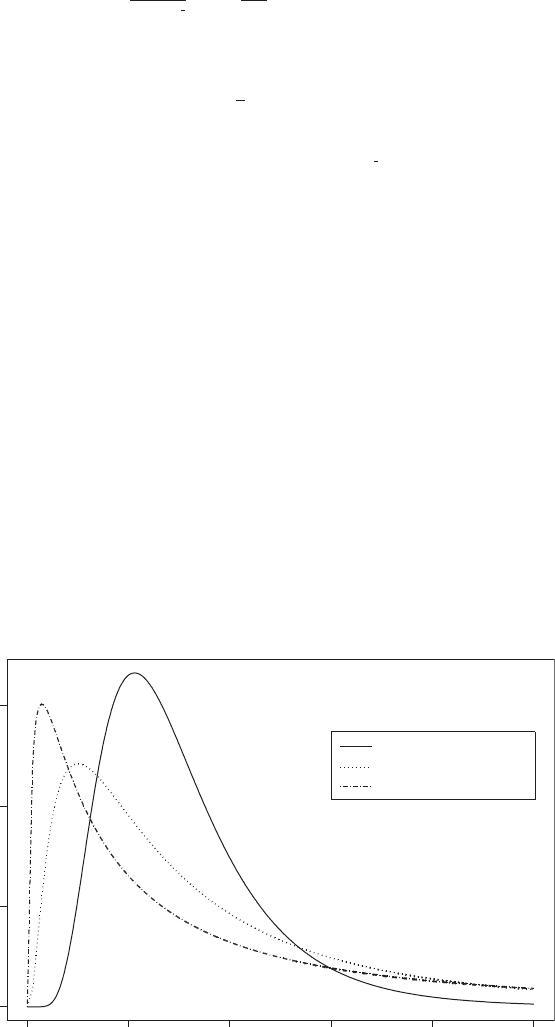
Lognormal distri bution: The probability distribution of a random variable, X, for which ln (X) has
a normal distribution with mean µ and variance σ
2
. The distribution is given by
f ðxÞ¼
1
xð2pÞ
1
2
exp
1
2
2
ðln x Þ
2
0 x
5
1
The mean, variance,
skewness
and
kurtosis
of the distribution are
mean ¼ expð þ
1
2
2
Þ
variance ¼ expð2 þ
2
Þðexpð
2
Þ1Þ
skewness ¼ðexpð
2
Þþ2Þðexpð
2
Þ1Þ
1
2
kurtosis ¼ expð4
2
Þþ2 expð3
2
Þþ3 expð2
2
Þ3
For small σ the distribution is approximated by the normal distribution. Some examples of
the distribution are given in Fig. 90. [STD Chapter 25.]
Logrank test: A test for comparing two or more sets of
survival times
, to assess the null hypothesis
that there is no difference in the survival experience of the individuals in the different groups.
For the two-group situation the
test statistic
is
U ¼
X
r
j¼1
ðd
1j
e
1j
Þ
where d
1j
is the number of deaths in the first group at t
(j)
, the jth ordered death time,
j ¼ 1; 2; ...; r, and e
1j
is the corresponding expected number of deaths given by
e
1j
¼ n
1j
d
j
=n
j
where d
j
is the total number of deaths at time t
(j)
, n
j
is the total number of individuals at risk at
this time, and n
1j
the number of individuals at risk in the first group. The expected value of U
is zero and its variance is given by
x
f(x)
0246810
0.0 0.1 0.2 0.3
mu = 1.0, sigma = 0.5
mu = 1.0, sigma = 1.0
mu = 1.0, sigma = 1.5
Fig. 90 Lognormal distributions for µ = = 1.0; σ = 0.5, 1.0, 1.5.
259

V ¼
X
r
j¼1
n
j
v
1j
where
v
1j
¼
n
1j
n
2j
d
j
ðn
j
d
j
Þ
n
2
j
ðn
j
1Þ
Consequently U=
ffiffiffiffi
V
p
can be referred to a standard normal distribution to assess the
hypothesis of interest. Other tests use the same test statistic with different values for the
weights. The Tarone–Ware test, for example, uses w
j
¼
ffiffiffi
n
p
j
and the Peto-Prentice test uses
w
j
¼
Y
j
i¼1
n
i
d
i
þ 1
n
i
þ 1
[SMR Chapter 13.]
LOGXACT: A specialized statistical package that provides exact inference capabilities for
logistic
regression
. [Cytel Software Corp., 675 Massachusetts Avenue, Cambridge, MA 02139
USA.]
Lomb periodogram: A generalization of the
periodogram
for unequally spaced
time series
.
[Biological Rhythm Research, 2001, 32, 341–5.]
Lo ngini ^ K oopman mode l: In
epidemiology
a model for primary and secondary infection, based
on the characterization of the
extra-binomial variation
in an infection rate that might arise
due to the ‘clustering’ of the infected individual within households. The assumptions
underlying the model are:
*
a person may become infected at most once during the course of the epidemic;
*
all persons are members of a closed ‘community’. In addition each person belongs to a
single ‘household’. A household may consist of one or several individuals;
*
the sources of infection from the community are distributed homogeneously through-
out the community. Household members mix at random within the household;
*
each person can be infected either from within the household or from the community.
The probability that a person is infected from the community is independent of the
number of infected members in his or her household;
The probability that exactly k additional individuals will become infected for a household
with s initial susceptibles and j initial infections is
Pðkjs; jÞ¼
s
k
Pðkjk; jÞB
ðskÞ
Q
ðjþkÞðskÞ
k ¼ 0; 1; ...; s 1
Pðsjs; jÞ¼1
X
s1
k¼0
Pðkjs; kÞ
where B is the probability that a susceptible individual is not infected from the community
during the course of the infection, and Q is the probability that a susceptible person escapes
infection from a single infected household member . [Statistics in Medicine, 1994, 13, 1563–74.]
Lo ngit u dinaldata: Data arising when each of a number of subjects or patients give rise to a vector of
measurements representing the same variable observed at a number of different time points.
Such data combine elements of multivariate data and
time series
data. They differ from the
former, however, in that only a single variable is involved, and from the latter in consisting of
a (possibly) large number of short series, one from each subject, rather than a single long
260
series. Such data can be collected either prospectively, following subjects forward in time, or
retrospectively, by extracting measurements on each person from historical records. This
type of data is also often known as repeated measures data, particularly in the social and
behavioural sciences, although in these disciplines such data are more likely to arise from
observing individuals repeatedly under different experimental conditions rather than from a
simple time sequence. Special statistical methods are often needed for the analysis of this
type of data because the set of measurements on one subject tend to be intercorrelated. This
correlation must be taken into account to draw valid scientific inferences. The design of most
such studies specifies that all subjects are to have the same number of repeated measure-
ments made at equivalent time intervals. Such data is generally referred to as balanced
longitudinal data. But although balanced data is generally the aim, unbalanced longitudinal
data in which subjects may have different numbers of repeated measurements made at
differing time intervals, do arise for a variety of reasons. Occasionally the data are unbal-
anced or incomplete by design; an investigator may, for example, choose in advance to take
measurements every hour on one half of the subjects and every two hours on the other half.
In general, however, the main reason for unbalanced data in a longitudinal study is the
occurrence of
missing values
in the sense that intended measurements are not taken, are lost
or are otherwise unavailable. See also Greenhouse and Geisser correction, Huynh–Feldt
correction, compound symmetry, generalized estimating equations, Mauchly test,
response feature analysis, time-by-time ANOVA and split-plot design.[Analysis of
Longitudinal Data, 2nd edition, 2002, P. J. Diggle, P. J. Heagerty, K.-Y. Liang and
S. Zeger, Oxford Scientific Publications, Oxford.]
Lon gitu dinal stu dies: Studies that give rise to
longitudinal data
. The defining characteristic of
such a study is that subjects are measured repeatedly through time.
Long memory processes: A
stationary stochastic process
with slowly decaying or long-range
correlations. See also long-range dependence.[Statistics for Long Memory Processes,
1995, J. Beran, Chapman and Hall/CRC Press, London.]
Long -range dependence: Small but slowly decaying correlations in a stochastic process. Such
correlations are often not detected by standard tests, but their effect can be quite strong.
[Journal of the American Statistical Association, 1997, 92, 881–93.]
Lord, Frederic Mather ( 1 912^2000): Born in Hanover, New Hampshire, Lord graduated from
Dartmouth College in 1936 and received a Ph.D. from Princeton in 1952. In 1944 he joined the
Educational Testing Service and is recognized as the principal developer of the statistical
machinery underlying modern mental testing. Lord died on 5 February 2000 in Naples, Florida.
Lo r d’sparadox: The fact that estimates of treatment effects using
change scores
, where (posttest–
pretest) is regressed on treatment, differ from
analysis of covariance
, where the posttest is
regressed on both treatment and pretest. [ Sociological Methodology, 1990, 20,93–114.]
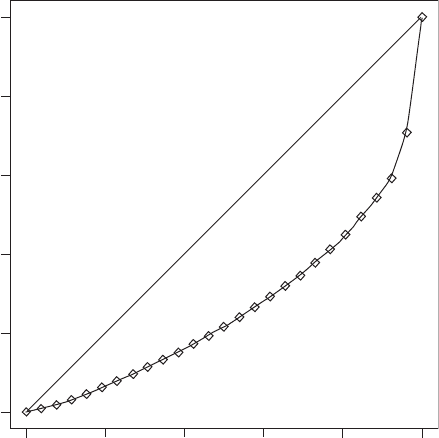
Lorenz curve: Essentially a graphical representation of the cumulative distribution of a variable,
most often used for income or wealth. If the risks of disease are not monotonically increasing
as the exposure becomes heavier, the data have to be rearranged from the lowest to the highest
risk before the calculation of the cumulative percentages. Associated with such a curve is the
Gini index defined as twice the area between the curve and the diagonal line. This index is
between zero and one, with larger values indicating greater variability while smaller ones
indicate greater uniformity. The further the Lorenz curve lies below the line of equality, the
more unequal is the distribution of, in Figure 91 for example, income. [KA1 Chapter 2.]
Loss function: See decision theory.
261
Lotteri es: See national lotteries.
Low-dose extrapolation: The estimation of the potential risks associated with a low dose of, for
example, a suspected carcinogen, for observed data on individuals exposed to moderately
high levels of the agent of interest. One approach is to rely on an assumed mathematical
function relating risk to exposure, for example the
probit
or
logit
. In many cases however it is
possible to postulate different models that fit the observed data equally well, but which
provide point estimates of risk at low exposures that differ by several orders of magnitude.
See also detection limits and dose-response curve .[Communications in Statistics:
Simulation and Computation, 1988, 11,27–45.]
Lower triangular matrix: A matrix in which all the elements above the main diagonal are zero. An
example is the following,
L ¼
1000
2300
1130
1567
0
B
B
@
1
C
C
A
LSD: Abbreviation for least significant difference.
LST: Abbreviation for large simple trial.
L-statistics: Linear functions of order statistics often used in estimation problems because they are
typically computationally simple. [Statistics in Civil Engineering, 1997, A. V. Metcalfe,
Edward Arnold, London.]
Lugann i and Rice formu la: A
saddlepoint method
approximation to a probability distribution
from a corresponding
cumulant generating function
. [KA1 Chapter 11.]
0.0
0.0
0.2
0.4
0.6
0.8
1.0
0.2 0.4
Income
Total income
0.6
0.8
1.0
Fig. 91 Example of Lorenz curve and Gini index.
262
L yapunov exponent: A measure of the experimental divergence of trajectories in chaotic systems
[Fractal Geometry, 1990, K. Falconer, Wiley, Chichester.]
Lynden^Bell method: A method for estimating the
hazard rate
, or probability distribution of a
random variable observed subject to data truncation. It is closely related to the
product-limit
estimator
for censored data. [Monthly Notices of the Royal Astronomical Society, 1987, 226,
273–80.]
263

M
Machine learning: A term that literally means the ability of a machine to recognize patterns that
have occurred repeatedly and to improve its performance based on past experience. In
essence this reduces to the study of computer algorithms that improve automatically
through experience. A computer program is said to learn from experience E with respect
to some class of tasks T and performance measure P, if its performance at tasks in T,as
measured by P, improves with experience E. Machine learning is inherently a multi-
disciplinary field using results and techniques from probability and statistics, computa-
tional complexity theory,
information theory
etc; it is closely related to
pattern recognition
and
artificial intelligence
and is widely used in modern
data mining
.[Introduction to
Machine Learning, 2004, E. Alpaydin, MIT Press, Boston.]
Mack^Wolfe te st: A
distribution free test
for one way designs for testing a null hypothesis of
equality against an alternative specifying an
umbrella ordering
. [NSM Chapter 6.]
MAD: Abbreviation for median absolute deviation .
MADAM: Abbreviation for mean and dispersion additive model.
M ahalanobis D
2
: A measure of the distance between two groups of individuals given by
D
2
¼ð
x
1
x
2
Þ
0
S
1
ð
x
1
x
2
Þ
where
x
1
and
x
2
are the mean vectors of the two groups and S is a weighted average of the
variance–covariance matrices
of the two groups, S
1
and S
2
, i.e.
S ¼
n
1
S
1
þ n
2
S
2
n
1
þ n
2
where n
1
and n
2
are the sample sizes in the two groups. See also Hotelling’s T
2
test. [MV1
Chapter 4.]
M ahalanobis, Pransanta Chandra ( 1 893^1 972): Born in Calcutta, India, Mahalanobis first
studied physics in Calcutta and then in Cambridge where he was elected a senior research
scholar in 1915. He eventually returned to India to teach at the Presidency College in
Calcutta. Mahalanobis made major contributions to many areas of statistics. His D
2
statistic
arose from work on anthropometric problems. Mahalanobis’ work on field experiments led
to a close friendship with
Fisher
. In 1931 he founded the Indian Statistical Institute.
Mahalanobis was made a Fellow of the Royal Society in 1945 and given one of his country’s
highest awards the Padma Vibhushan. He died on 28 June 1972 in Calcutta.
Mahalonobis-Taguchi system: A diagnostic and predictive method for analyzing patterns in
multivariate data
. The system is reported to make accurate forecasts using small, correlated
data sets. [Concurrent Engineering, 2006, 14, 343–354.]
Main effect: An estimate of the independent effect of usually a factor variable on a response variable
in
analysis of variance
. [SMR Chapter 12.]
264
Mainframes: High speed, large and expensive computers with a very large storage capacity and
capable of supporting thousands of users simultaneously. Mainframes support more simul-
taneous programs than
supercomputers
, but the latter can execute a single program faster.
Mainland, Donald (19 02^19 85): Mainland graduated in medicine at Edinburgh University and
in 1930 he became Professor and Chairman of the Department of Anatomy at Dalhousie
University. He later developed an interest in measurement issues and statistics, publishing a
book on statistics in medicine in 1937. In 1950 Mainland became Professor of Medical
Statistics at New York University. A prolific writer on statistical issues, Mainland died in
July 1985 in Kent, Connecticut.
Majority rule: A requirement that the majority of a series of
diagnostic tests
are positive before
declaring that a patient has a particular complaint. See also unanimity rule.[Statistics in
Medicine, 1987, 7, 549–557.]
Mallows’ C
p
statistic: An index used in
multiple regression analysis
as an aid in choosing the
‘best’ subset of explanatory variables. The index is defined as
C
p
¼
X
n
i¼1
ðy
i
^
y
ðkÞ
i
Þ
2
=s
2
n þ 2p
where n is the number of observations, y
i
is the observed value of the response variable for
individual i,
^
y
ðkÞ
i
is the corresponding predicted value from a model with a particular set of k
explanatory variables and s
2
is the residual mean square after regression on the complete set
of p explanatory variables. The model chosen is the one with the minimum value of C
p
. See
also Akaike’s information criterion and all subsets regression. [ARA Chapter 7.]
Malthus, Thomas Rober t (1 766^183 4): Malthus studied history, poetry, modern languages,
classics and mathematics at Jesus College, Cambridge. After being elected to a Fellowship at
Jesus in 1793 he became a curate in a small town, Albury in 1798, the year in which he
published the first version of his famous work, Essay on the Principle of Population as it
affects the Future Improvement of Society. Malthus was a strong advocate of statistical
investigation and was a founder member of the Statistical Society of London. He died in
December 1834 in Bath, UK.
Malthusian parameter: The rate of increase that a population would ultimately attain if its age-
specific birth and death rates were to continue indefinitely. Explicitly the parameter λ in the
exponential equation of population growth, NðtÞ¼N
0
e
lt
, where N
0
is the initial population
size (t=0) and t is the elapsed time. See also population growth model.[Proceedings of the
National Academy of Science, USA, 1996, 93, 276–8.]
M a ndel , J oh n ( 1914^2007): Born in Antwerp, Belgium, Mandel received a master ’s degree in
chemistry from the University Libre de Bruxelles in 1937 and worked as a chemist in
Belgium up to 1940 when he was forced to flee to France and then Portugal before travelling
to the United States. In New York he again worked as a chemist, studying mathematics at
night at Brooklyn College. In 1965 Mandel received a doctorate in mathematical statistics
from the Eindhoven University of Technology in the Netherlands. Mandel then spent
40 years as a statistician at the National Institute of Standards and Technology in
Washington and became an internationally recognized authority on the application of
mathematical and statistical methods in the physical sciences. He received many honours
including the Shewhart Medal and the American Statistical Association’s W. J. Youden
Award. Mandel died on the 1st October 2007 in Silver Springs, USA.
Manhattan distance: Synonym for city block distance.
265
M ani fest variable: A variable that can be measured directly, in contrast to a
latent variable
.
M ann ^ Whitney test: A
distribution free test
used as an alternative to the
Student’s t-test
for
assessing whether two populations have the same median. The test statistic
U
is calculated
from comparing each pair of values, one from each group, scoring these pairs 1 or 0
depending on whether the first group observation is higher or lower than that from the
second group and summing the resulting scores over all pairs. In the case of no ties then
U ¼ W nðn þ 1Þ=2
where
n
is the number of observations in the smaller group and
W
is the rank sum statistic
associated with
Wilcoxon’s rank sum test
. The two tests are thus equivalent. Tables giving
critical values of the test statistic are available, and for moderate and large sample sizes, a
normal approximation can be used. [SMR Chapter 6.]
MANOVA: Acronym for multivariate analysis of variance.
Mantel, Nathan (19 19 ^20 02): Born in New York, Mantel graduated from City College in 1939
with a major in statistics. His career as a statistician began in 1940 in the War Production
Board. After the war Mantel joined the National Cancer Institute where he remained until his
retirement. Mantel made substantial contributions to biostatistics and epidemiology, includ-
ing the
Mantel–Haenszel estimator
. He died on 26 May 2002, in Potomac, Maryland.
M ant el^ Haenszel esti mato r: An estimator of the assumed common
odds ratio
in a series of
two-by-two contingency
tables arising from different populations, for example, occupation,
country of origin, etc. Specifically the estimator is defined as
ω ¼
X
k
i¼1
a
i
d
i
=
X
k
i¼1
c
i
b
i
where k is the number of two-by-two tables involved and a
i
,b
i
,c
i
d
i
are the four counts in the
ith table. [Case-Control Studies: Design, Conduct, Analysis, 1982, J. J. Schlesselman, Oxford
University Press, Oxford.]
M any-outl ier detection procedures: Procedures for detecting multiple
outliers
in a sample of
n observations, x
1
; x
2
; ...; x
n
. Generally based on assuming that k of the observations
x
i
1
; x
i
2
; ...; x
i
k
are outliers distributed normally with mean þ l
i
j
; j ¼ 1; ...; k and variance
2
, while the remaining n-k observations are normally distributed with mean µ and again
variance
2
. Three such procedures are:
1. The extreme standardized deviate (ESD), given by
ESD
i
¼jx
ðS
i
1Þ
xðS
i1
Þj=sðS
i1
Þ; i ¼ 1; ...; k
where x
ðS
i
1Þ
is the observation farthest away from the mean
xðS
i1
Þ in the subset
S
i–1
,and
s
2
ðS
i1
Þ¼
X
niþ1
j¼1
½x
j
ðS
i1
Þ
xðS
i1
Þ
2
=ðn iÞ
S
0
¼fx
1
; x
2
; ...; x
n
g and subsets S
i
; i ¼ 1; ...; k 1 are formed by deleting an
observation farthest from the mean of the subset S
i-1
2. The standardized range procedure (STR):
STR
i
¼½x
l
ðS
i1
Þx
s
ðS
i1
Þ=sðS
i1
Þ; i ¼ 1; ...; k
where x
l
ðS
i1
Þ is the largest observation in the subset S
i-1
, and x
s
ðS
i1
Þ is the smallest
observation in the subset S
i-1
.
266

3. The kurtosis procedure (KUR):
KUR
i
¼ðn i þ 1Þ
X
niþ1
j¼1
½x
j
ðS
i1
Þ
xðS
i1
Þ
4
=½
X
niþ1
j¼1
fx
j
ðS
i1
Þ
xðS
i1
Þ
2
g
2
;
i ¼ 1; ...; k
Sample values of any of these statistics are compared with the corresponding critical
values for i=k. If a sample value is found to be greater than the corresponding critical
value, k outliers are declared to be present in the sample; otherwise, similar compar-
isons are made for i ¼ k 1; ...; 1 until for a particular value of i=l, the sample value
is greater than the corresponding ordeal value in which case l outliers are declared to
be present in the sample. If for i=1 the sample value of the statistics is less than or
equal to the corresponding critical value, no outliers are detected. [Technometrics,
1975, 17, 221–7.]
MAPestimate: Abbreviation for maximum a posteriori estimate.
Maple: A computer system for both mathematical computation and computer algebra. See also
Mathematica [http://www.maplesoft.com/]
Mardia’ s multivariate normality test: A test that a set of
multivariate data
arise from a
multivariate normal distribution
against departures due to
kurtosis
. The test is based on
the following multivariate kurtosis measure
b
2;q
¼
1
n
X
n
i¼1
fðx
i
xÞ
0
S
1
ðx
i
xÞg
2
where q is the number of variables, n is the sample size, x
i
is the vector of observations for
subject i,
x is the mean vector of the observations, and S is the sample
variance–covariance
matrix
. For large samples under the hypothesis that the data arise from a multivariate normal
distribution, b
2,q
, has a normal distribution with mean q(q þ2) and variance 8qðq þ 2Þ=n.
[Multivariate Analysis, 1979, K. V. Mardia, J. T. Kent and J. M. Bibby, Academic Press,
London.]
MAREG: A software package for the analysis of marginal regression models. The package allows the
application of
generalized estimating equations
and
maximum likelihood methods
, and
includes techniques for handling
missing values
.[Statistical Software Newsletter in
Computational Statistics and Data Analysis, 1997, 24, 237–41 and http://www.stat.uni-
muenchen.de/sfb386/software/mareg/winmareg.html]
Marginal distribution: The probability distribution of a single variable, or combinations of vari-
ables, in a multivariate distribution. Obtained from the multivariate distribution by integrat-
ing over the other variables. [KA1 Chapter 1.]
Marginal homogeneity : A term applied to
square contingency tables
when the probabilities of
falling in each category of the row classification equal the corresponding probabilities for the
column classification. See also Stuart–Maxwell test.
Marginal likelihood: See likelihood.
M a rg i na l matching: The matching of treatment groups in terms of means or other summary
characteristics of the matching variables. Has been shown to be almost as efficient as the
matching of individual subjects in some circumstances. [Work, Employment and Society,
1994, 8, 421–31.]
267
Marginal models: See population averaged model.
Marginal structural model (MSM): A model for estimation of the causal effect of a time-
dependent exposure in the presence of
time-dependent covariates
that may simultaneously
be confounders and intermediate variables. Inverse-probability-of-treatment weighting esti-
mators (extensions of the
Horvitz-Thompson estimator
) are used to estimate causal effects
based on the concept of potential outcomes (see
Neyman-Rubin causal framework
). A
simpler but more limited approach than using a
structural nested model
.[Epidemiology,
2000, 11, 550–560.]
Marginal totals: A term often used for the total number of observations in each row and each column
of a
contingency table
.
Markers of disease progression: Quantities that form a general monotonic series throughout
the course of a disease and assist with its modelling. In general such quantities are highly
prognostic in predicting the future course. An example is CD4 cell count (cells per µl),
which is generally accepted as the best marker of HIV disease progression. [Chemical and
Biological Interactions, 1994, 91, 181–6.]
Market model: A
linear regression
model of the form
r
t
¼ α þ βm
t
þ
t
where r
t
,m
t
represent the returns of the stock and of the market in period t;
t
is the error term
which is uncorrelated to the market return in period t. This model is widely used in modern
portfolio management. [Mathematical Finance, 1997, 7, 127–55.]
M a rk ov, Andrey And reyevic h ( 1856^1922): Born in Ryazan, Russia, Markov studied at
St Petersburg where he became professor in 1893. In 1905 he left for self-imposed exile
in the town of Zaraisk. A student of
Chebyshev
, he worked on number theory and probability
theory. Best remembered for the concept of a
Markov chain
which has found many
applications in physics, biology and linguistics.
Markov chain: A
stochastic process
, fX
t
g; t ¼ 0; 1; 2; ... where X
t
takes values in the finite set
S ¼f1; 2; ...; Ng, and is such that
PrðX
n
¼ i
n
jX
0
¼ i
0
; ...; X
n1
¼ i
n1
Þ¼PrðX
n
¼ i
n
jX
n1
¼ i
n1
Þ
(Strictly this defines a discrete time Markov chain; if the set S contains an uncountable number
of elements then a continuous time Markov chain results.) The equation given implies that to
make predictions about the future behaviour of the system it suffices to consider only its
present state and not its past history. The probability PrðX
n
¼ i
n
jX
n1
¼ i
n1
Þ is known as a
one step transition probability. The more general transition probability,PrðX
n
¼ ijX
m
¼ jÞ
satisfies the famous Chapman–Kolmogorov equation given by
PrðX
n
¼ ijX
m
¼ jÞ¼
X
k
PrðX
r
¼ kjX
m
¼ jÞPrðX
n
¼ ijX
r
¼ kÞ m
5
r
5
n
A time-homogeneous Markov chain is one for which the transition probabilities depend only
on the difference n − m rather than on n or m. In particular, the one-step transition probability,
PrðX
n
¼ ijX
n1
¼ jÞ can be written as simply p
ij
. The N×Nmatrix, P, with ijth element p
ij
is
a stochastic matrix, i.e.
0 p
ij
1; 1 i; j N
X
N
j¼1
p
ij
¼ 1; 1 i N
268