Citibank: basic of corporate finance
Подождите немного. Документ загружается.


6-28 CORPORATE VALUATION – RISK
v-1.1 v.05/13/94
p.01/14/00
Creating a diversified portfolio of stocks enables an investor to
eliminate nearly all unsystematic risk. The unexpected events that cause
unsystematic risk include things like strikes, lawsuits, winning or losing
major contracts, etc. Since these events that make up company-specific
risk are essentially random occurrences, diversification allows us to
eliminate them as risk factors. In other words, on average, the positive
events of all the companies in the portfolio tend to cancel out the
negative events.
Risk that
affects the
entire market
The other type of risk is called systematic risk (market risk or
undiversifiable risk). Systematic risk cannot be eliminated by
diversification because the unexpected events that create systematic
risk affect all companies in the market. Such events may include war,
inflation, recession, etc.
The risk of an individual security is not the primary concern of the
investor. The relevant riskiness of an individual security is its
contribution to the riskiness of a well-diversified portfolio. For
example, the riskiness of Ford Motor stock is the contribution that the
Ford stock makes to the overall riskiness of the portfolio in which it is
held.
Reduction of
unsystematic
risk
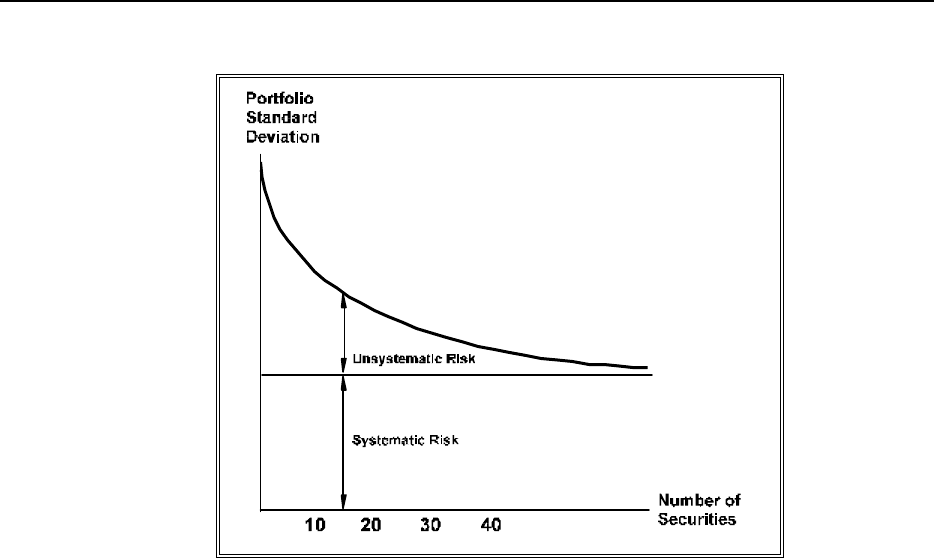
The graph in Figure 6.16 illustrates how the addition of securities
to the portfolio eliminates the unsystematic risk, while the systematic
risk remains constant. The standard deviation for the expected return
of the portfolio is on the vertical axis. The number of securities held
in the portfolio is on the horizontal axis.
www.LisAri.com
CORPORATE VALUATION – RISK 6-29
v.05/13/94 v-1.1
p.01/14/00
Figure 6.16: Reduction of Unsystematic Risk
You can see that as the number of securities increases, the amount
of unsystematic risk declines. Many studies have been completed to
determine the optimal size of a portfolio. Analysts say that over
95% of the unsystematic risk is eliminated in a portfolio of about
40 securities.
Market index
portfolio
A portfolio that contains all of the stocks in the market, based on
weight within the market, is often called the market portfolio. The
New York Stock Exchange (NYSE) lists over 1,500 different stocks.
The standard deviation for a market index portfolio containing all of
the NYSE stocks historically has been about 15.1% (s
M
= 15.1%).
This represents the amount of risk that can not be eliminated by
diversification and corresponds to the risk premium that is added to
the risk-free level of interest rates discussed in Unit Two.
www.LisAri.com

6-30 CORPORATE VALUATION – RISK
v-1.1 v.05/13/94
p.01/14/00
Summary
An investor with a diversified portfolio has invested with different
companies in several industries to reduce unsystematic (company-
specific) risk.
Events that affect the entire market, such as war, inflation, and
recession, contribute to the systematic or undiversifiable risk of
a portfolio.
The relevant risk of holding a security is the individual security's
contribution to the overall risk of the portfolio. Different securities
will affect the same portfolio differently. The same security will have
different contributions to different portfolios. Investors will not be
rewarded for assuming risk that could have been eliminated through
diversification. The type of risk that remains after diversification is
systematic (market) risk.
Please check your understanding of "systematic" and "unsystematic risk" in Practice
Exercise 6.3. In the next section you will see how to measure systematic risk.
www.LisAri.com

CORPORATE VALUATION – RISK 6-31
v.05/13/94 v-1.1
p.01/14/00
PRACTICE EXERCISE 6.3
Directions: Mark the correct answer to each question. Compare your solutions to the
correct answers in the Answer Key that follows on the next page.
3. Portfolio diversification is an important strategy for investors because it:
____ a) reduces expected returns.
____ b) increases expected returns.
____ c) reduces systematic risk.
____ d. reduces unsystematic risk.
4. The type of risk that investors are compensated for is:
____ a) total risk.
____ b) unsystematic risk.
____ c) systematic risk.
____ d) normal or expected return.
Use the following portfolio information for the next question.
Amount Expected
Security Invested Weight Return
Stock A $5,000 0.25 9%
Stock B $5,000 0.25 10%
Stock C $6,000 0.30 11%
Stock D $4,000 0.20 12%
5. What is the expected return on the portfolio?
____ a) 10.00%
____ b) 10.25%
____ c) 10.45%
____ d) 10.50%
www.LisAri.com

6-32 CORPORATE VALUATION – RISK
v-1.1 v.05/13/94
p.01/14/00
ANSWER KEY
3. Portfolio diversification is an important strategy for investors because it:
d) reduces unsystematic risk.
Portfolio diversification reduces unsystematic risk. It does not
reduce market risk (systematic risk).
4. The type of risk that investors are compensated for is:
c) systematic risk.
Investors can expect to be rewarded for assuming systematic
risk since they can diversify their portfolio to minimize or
eliminate unsystematic risk.
5. What is the expected return on the portfolio?
c) 10.45%
Weight x
Amount Expected Expected
Security Invested Weight Return Return
Stock A $5,000 0.25 9% 2.25%
Stock B $5,000 0.25 10% 2.50%
Stock C $6,000 0.30 11% 3.30%
Stock D $4,000 0.20 12% 2.40%
Expected Return 10.45%
www.LisAri.com

CORPORATE VALUATION – RISK 6-33
v.05/13/94 v-1.1
p.01/14/00
Beta
Standard deviation is used to measure the risk of an individual stock —
the type of risk that can be reduced by diversification. What is needed
is a method for measuring an individual stock's contribution to the
systematic risk of a portfolio.
Measure of
stock's
volatility
The beta coefficient (b) is the measure of a stock's volatility
relative to that of an average stock. In other words, it reflects the
degree to which the price of a stock tends to move with movements
in the market.
An average stock is defined as a stock that tends to move up and down in
step with the market as a whole. The market is often measured by using
an index such as the New York Stock Exchange (NYSE), the Standard
and Poor's 500 (S&P 500), or the Dow Jones Industrial average. These
indices serve as good representations of
the entire United States stock market. For example, the S&P 500 is
a weighted-average portfolio of the stocks of 500 of the largest and
most stable U.S. companies. It is often selected to represent the
movements of the entire U.S. stock market. Analysts use these indices
to measure the entire market because information for the companies in
an index is easily obtained, making analysis quicker and less expensive.
Covariability of
stock with the
market
The beta coefficient measures the covariability (relative movement)
of a stock as compared to a benchmark which, in this case, is the
market portfolio. An average-risk stock has a beta coefficient of 1.0.
This means that if the market moves up by 10%, the stock will, on
average, move up by 10%. Likewise, if the market moves down by
10%, the stock will, on average, fall 10%. Less than average-risk
stocks have betas between 0.0 and 1.0, whereas higher than average-
risk stocks have betas greater than 1.0.
www.LisAri.com
6-34 CORPORATE VALUATION – RISK
v-1.1 v.05/13/94
p.01/14/00
Example
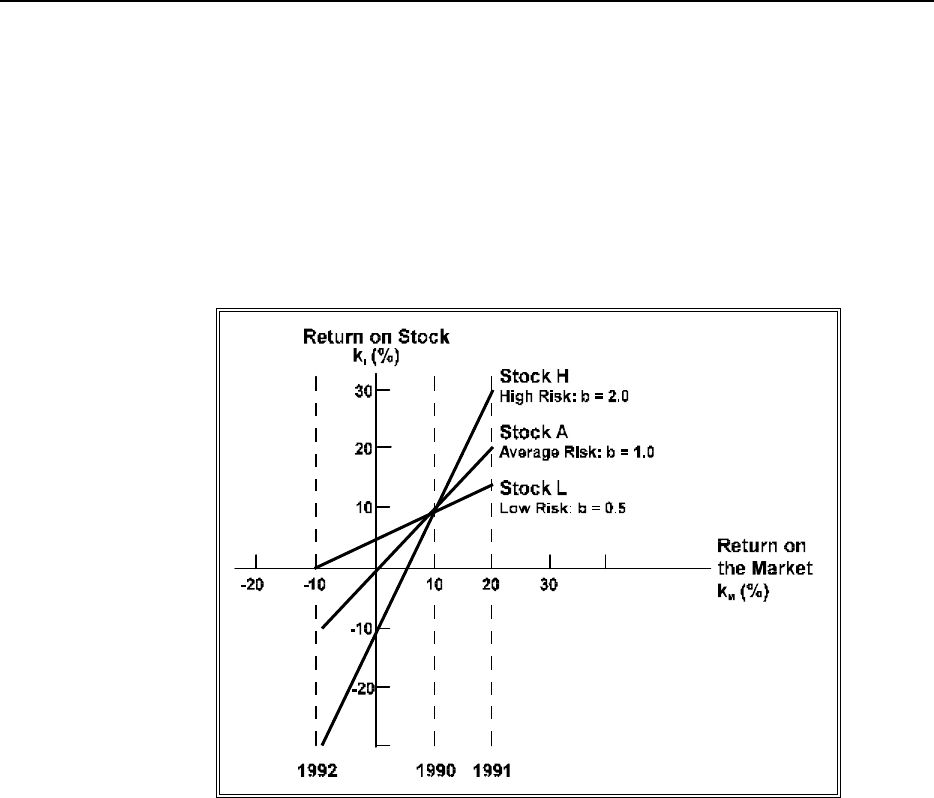
You can see the covariability of three stocks by looking at the graph
in Figure 6.17. The vertical axis represents the return on each
individual stock, and the horizontal axis represents the return on the
market. Plotted on the graph are the returns for three stocks for the
years 1990, 1991, and 1992: H (for high risk), A (for average risk),
and L (for low risk).
Figure 6.17: Covariability of Stocks H, A, and L with the Market
In 1990, all three stocks had a 10% return — the same as the market's
return. In 1991, the market return rose to 20%. Stock A also earned
20%, Stock H soared to a 30% return, and Stock L earned a 15%
return. In 1992, the market fell to a -10% return. Stock A also fell to -
10%, while Stock H fell to -30% and Stock L earned a 0% return.
Stock H was twice as volatile as the market and, therefore, it carried
twice as much risk. Stock H's beta coefficient of 2.0
represents the risk. Stock A moved the same as the market moved and
has a beta coefficient of 1.0. The low-risk security, Stock L, moved
half as much as the market and, therefore, has a beta of 0.5.
www.LisAri.com

CORPORATE VALUATION – RISK 6-35
v.05/13/94 v-1.1
p.01/14/00
Beta is equal
to the slope
The slopes of the lines show how much the return of each stock
moves in response to movement in the return on the market as a
whole. A security's beta is equal to the slope on this type of graph.
There are several different ratings companies that calculate and
publish the beta coefficients for thousands of companies.
If a company with a beta coefficient greater than 1.0 is added to an
average-risk portfolio, the overall risk of the portfolio will increase. On
the other hand, adding a stock with a beta coefficient less than 1.0 will
reduce the overall risk of an average-risk portfolio.
Example
Let's analyze a simple example to organize what we have learned.
Suppose we have the following information for stock X and stock Y.
Standard
Deviation Beta
Stock X 40% 0.50
Stock Y 20% 1.50
We know the following about stock X and stock Y:
1) Beta represents systematic risk. Stock X has less systematic risk
than stock Y.
2) Standard deviation represents total risk. Stock X has more total
risk than stock Y.
3) Total risk equals systematic plus unsystematic risk. Stock X
must have more unsystematic risk than stock Y.
4) Investors earn a return on systematic risk. Stock Y will have a
higher expected return and a higher risk premium even though
its total risk is less than the total risk of stock X.
www.LisAri.com

6-36 CORPORATE VALUATION – RISK
v-1.1 v.05/13/94
p.01/14/00
Portfolio beta
calculation
The beta of a portfolio can be calculated if the information about
the beta of each stock in the portfolio and the amount invested in
each stock is known. The formula is a weighted average of the
individual stock beta coefficients.
m
b
P
= S = W
i
b
i
i = 1
Where:
b
P
= Beta coefficient of the portfolio
m = Number of securities in the portfolio
W
i =
Relative weight invested in each security
b
i =
Beta coefficient of security i
i = Each specific security
Example
To illustrate the use of the formula, suppose that a portfolio contains
the following stocks.
Amount Beta
Security Invested Coefficient
Stock A $1,000 0.80
Stock B $2,000 0.95
Stock C $3,000 1.10
Stock D $4,000 1.40
Sum of
weighted beta
coefficients
To calculate the portfolio beta coefficient, multiply each stock's
weight in the portfolio by its beta and add up the products. Two
columns have been added to the table: "Weight" — the relative weight
in the portfolio of each stock and "Weight x Beta" — the weighted
beta coefficients. The beta coefficient of the portfolio is the sum of
these products.
Amount Beta Weight x
Security Invested Weight Coefficient Beta
Stock A $1,000 0.10 0.80 0.08
Stock B $2,000 0.20 0.95 0.19
Stock C $3,000 0.30 1.10 0.33
Stock D $4,000 0.40 1.40 0.56
Portfolio Beta b
P
= 1.16
www.LisAri.com

CORPORATE VALUATION – RISK 6-37
v.05/13/94 v-1.1
p.01/14/00
Remember, the relative weight of a security is its percentage of the
total investment. These weights must add to 1.0.
For this example, the beta coefficient of the portfolio is 1.16.
Because the beta is larger than 1.0, this portfolio has greater
systematic risk than the market portfolio.
As mentioned earlier, investors are rewarded for bearing systematic risk.
The next step will be to calculate the amount of the reward.
Summary
Beta is a measure of the systematic risk for a security or a portfolio
relative to a market portfolio. Beta does not capture unsystematic,
diversifiable risk. The beta coefficient measures the covariability of
a security's or portfolio's volatility with the volatility of the market
as a whole.
Please check your understanding of "beta" in the Practice Exercise which follows. You will
then be ready to continue to the final section of this unit.
www.LisAri.com