Catuneanu O. Principles of Sequence Stratigraphy
Подождите немного. Документ загружается.

This Page Intentionally Left Blank

CHAPTER
7
Time Attributes of Stratigraphic Surfaces
INTRODUCTION
A central and yet controversial topic in sequence
stratigraphy is the assessment of stratigraphic surfaces
in a chronostratigraphic framework. Are the bounding
surfaces of sequences and systems tracts time lines,
i.e., generated at the same time everywhere within the
basin? The answer to this question is of paramount
importance for stratigraphic correlation, and although
this problem has been debated for some time (Miall,
1991, 1994; Catuneanu et al., 1998b; Posamentier and
Allen, 1999), agreement is yet to be reached. Part of the
problem derives from the way concepts are defined,
often with contradictory meanings, as explained in
this chapter.
The assumptions made in the early days of seismic
and sequence stratigraphy, in the 1970s and 1980s,
emphasized heavily the role of eustatic changes in sea
level in the generation of the preserved stratigraphic
record, and implicitly on the formation of systems
tract and sequence boundaries. As eustatic changes in
sea level are global in nature, it was implied that
sequence stratigraphic surfaces that correspond to the
four events of the base-level cycle (Fig. 4.7) are isochro-
nous, being formed everywhere at the same time.
Subaerial unconformities, assumed to have been
formed during global stages of sea-level fall, were also
assigned global synchronicity. These early ideas led to
the construction of the global cycle chart (Vail et al.,
1977; Haq et al., 1987, 1988), whose fundamental prem-
ise was that sequence stratigraphic conformities are
world-wide correlatable time lines, while sequence-
bounding unconformities correspond to stratigraphic
hiatuses of global significance. Thus, each set of sequence
stratigraphic surfaces found in any basin around the
world was invariably traced back and correlated to the
‘global master curve,’ assuming that each stratigraphic
cycle is globally synchronous. As a result, sequence
cycles were seen as geochronologic units that provide
the means to subdivide the sedimentary rock record
into genetic chronostratigraphic intervals (Vail et al.,
1977, 1991).
The eustasy-driven stratigraphic approach provided
an easy, but oversimplified way of looking at the tempo-
ral significance of stratigraphic surfaces. In reality, no
surface can possibly be an absolute time line, and the
degree of diachroneity may vary greatly with the
mode of formation and the dependence on parameters
characterized by variable rates along dip and strike,
such as tectonism and sedimentation. While a continuum
is expected within the diachroneity range, the qualifiers
used to describe the degree of diachroneity in this book
are ‘low’ vs. ‘high’ (Fig. 4.9): a ‘low diachroneity’ refers
to a difference in age that falls below the resolution of
the current dating techniques, which therefore is unde-
tectable by biostratigraphic, magnetostratigraphic, or
radiometric means; a ‘high diachroneity’ refers to a more
significant difference in age between the different
portions of a stratigraphic surface, which can be empha-
sized using the available dating techniques.
This chapter analyzes the degrees of diachroneity
that various stratigraphic surfaces may be associated
with, by using simple numerical models. The temporal
significance of stratigraphic surfaces is arguably one
of the most difficult topics to deal with, and to quan-
tify, in sequence stratigraphy. Firstly, addressing
this topic requires computational simulations, which,
although increasingly employed in stratigraphic
analyses (e.g., Jordan and Flemings, 1991; Johnson and
Beaumont, 1995; Catuneanu et al., 1998b; Harbaugh et al.,
1999), are still not fully embraced by the majority of
geologists as part of their workflow routine. Secondly,
the methods of defining stratigraphic surfaces are
to some extent loose, from the generic nature of the
reference curve relative to which sequence stratigraphic
surfaces are defined (e.g., Fig. 4.7), to the ambiguous
291
and sometimes conflicting criteria that are used to
pinpoint surfaces in the rock record. There are histori-
cal reasons why the meaning of the reference curve for
the definition of sequence stratigraphic surfaces is not
fully constrained, and is perhaps even misunderstood,
and these reasons are fully explored in the following
section of this chapter. Conflicting criteria that persist
in the definition of some surfaces also have historical
roots, stemming from deeply entrenched ‘taboos’ in
geological thinking. Many of these deeply rooted prin-
ciples in geology have been re-evaluated in recent years
(e.g., the concept of uniformitarianism, and its impli-
cations for establishing a hierarchy of stratigraphic
cycles––more discussions in Chapter 8; the position of
sequence boundaries in fully fluvial successions relative
to coarse-grained facies––see discussions in Chapter 6;
the relationship between shoreline shifts, sediment
grading and water-depth changes––discussed in
this chapter; the ‘time-barrier’ vs. time-transgressive
character of sequence-bounding unconformities––also
discussed in this chapter, etc.), as afforded by advances
in data acquisition, laboratory techniques, or numerical
modeling.
As discussed above, considerable confusion with
respect to where some of the conformable sequence
stratigraphic surfaces are placed in the rock record is
sourced by alternative approaches to their definition,
such as, for example, the placement of a marine maxi-
mum flooding surface at the top of a ‘fining-upward’
succession or at the top of a ‘deepening-upward’
succession. While such alternative definitions overlap to
some extent, and are traditionally considered as equiva-
lent, a quantitative analysis of the interplay of the
controls on grain size and water-depth changes reveals
that different definition criteria may be satisfied by
discrete surfaces that are spatially offset, as opposed to
pointing to one single surface as intended. This chapter
addresses all these aspects involved in the definition of
sequence stratigraphic surfaces, which have a direct
impact on their temporal attributes, from the ‘master’
reference curve to the criteria employed for mapping
them in the rock record.
REFERENCE CURVE FOR THE
DEFINITION OF STRATIGRAPHIC
SURFACES
The timing of all sequence stratigraphic surfaces
and systems tracts is defined relative to one curve that
describes a full cycle of sea-level, relative sea-level, or
base-level changes, depending on the model that is
being employed (e.g., Figs. 4.7 and 6.1). For example,
the original correlative conformity of Posamentier et al.
(1988) was considered to form during early sea-level
fall (Fig. 6.1), which was later revised to the onset of
sea-level fall (Posamentier et al., 1992b) or the onset of
relative sea-level fall (Posamentier and Allen, 1999).
The correlative conformity of Hunt and Tucker (1992)
is taken at the end of relative sea-level fall (Fig. 6.1),
and so on. Irrespective of the conceptual approach, each
model shows one curve relative to which all surfaces and
systems tracts are defined.
This theoretical curve is generally presented as a
generic sinusoid, with an unspecified position within
the basin. The generic nature of this reference curve
originates from the early seismic and sequence strati-
graphic models of the late 1970s to late 1980s, which
were based on the assumption that eustasy is the
main driving force behind sequence formation at all
levels of stratigraphic cyclicity (Figs. 3.2 and 6.1). Since
eustasy is global in nature, there was no need to spec-
ify where that reference curve is positioned within the
basin under analysis. Subsequent realization in the
1990s, based on much earlier work, that tectonism is
as important as eustasy in controlling stratigraphic
cyclicity, led to the replacement of the eustatic
curve with other reference curves, of relative sea-level
(eustasy plus tectonism) or base-level (relative sea
level plus energy of the depositional environment)
292 7. TIME ATTRIBUTES OF STRATIGRAPHIC SURFACES
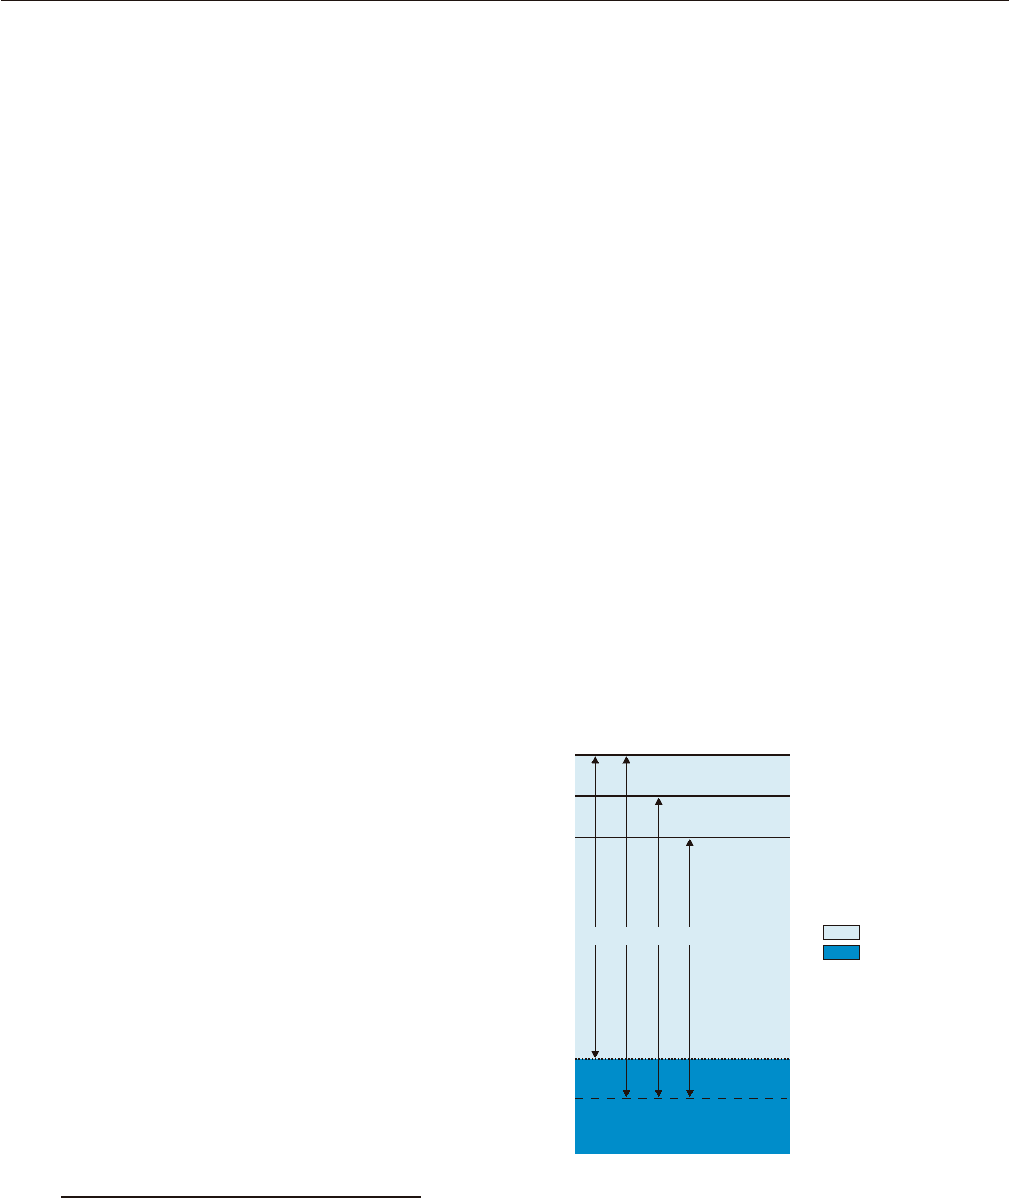
Sea level
Base level (fairweather)
Base level (storms)
Sea floor
Datum
A
B
C
D
water column
sediments
FIGURE 7.1 Concepts of water depth, sea level, relative sea level,
and base level. For the significance of the datum, refer to Chapter 3,
as well as Figs. 3.12 and 3.15. Changes in distances A, B, and C/D
reflect water-depth (bathymetric) changes, relative sea-level changes,
and base-level changes, respectively. Note that the position of the
base level is a function of environmental energy, which marks the
difference between the concepts of relative sea-level and base-level
changes (see also Fig. 3.15). Sea-level changes are independent of
datum, seafloor, and sedimentation, and are measured relative to the
center of Earth.

changes (Figs. 3.15 and 7.1). The shortcoming of these
conceptual advances was that the new reference curves
were still regarded as generic, with an unspecified
position within the basin, despite the fact that subsi-
dence is invariably differential along both dip and strike.
Figure 7.2 presents a dip-oriented cross-section
through a hypothetical basin in an extensional setting,
e.g., a divergent continental margin. In such settings,
subsidence rates vary along dip, increasing towards
the basin (Pitman, 1978; Angevine, 1989; Jordan and
Flemings, 1991). The reference locations A, B, and C are
therefore characterized by different subsidence rates,
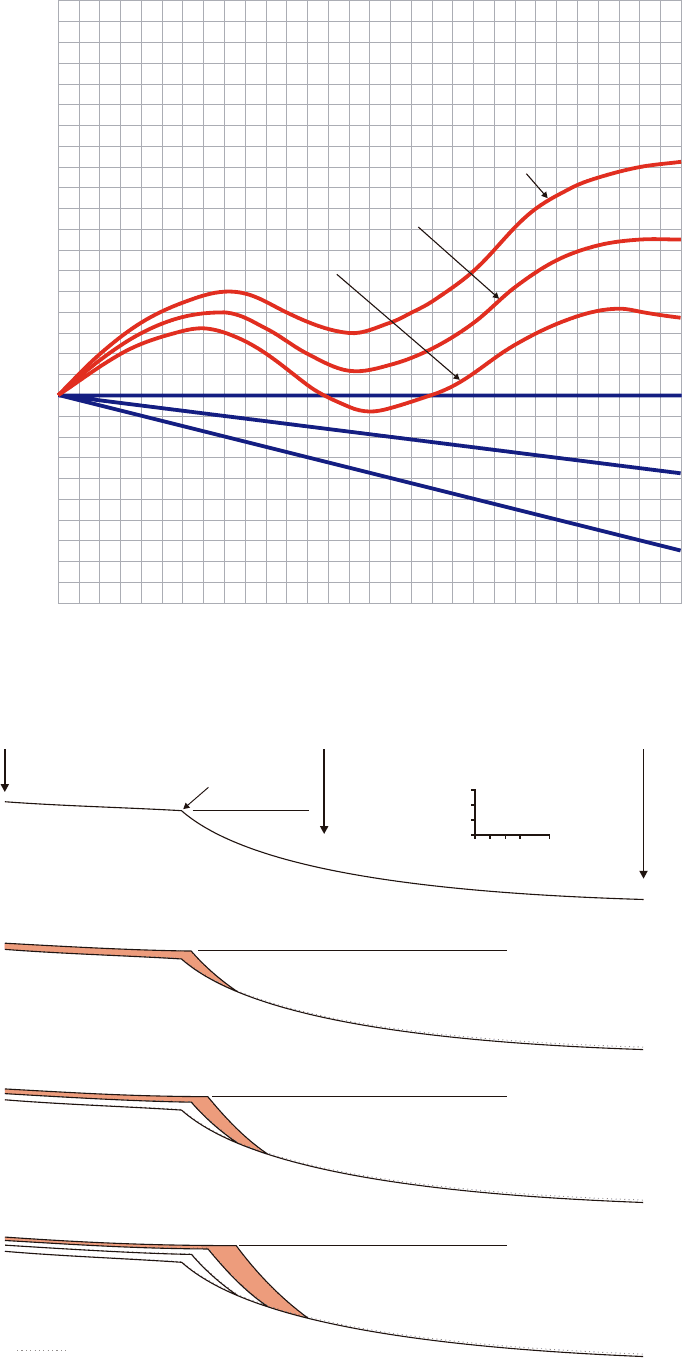
as illustrated in Fig. 7.3. Changing subsidence rates
implies that any point within the basin is characterized
by its own curve of relative sea-level/base-level fluc-
tuations (Fig. 7.4), so no one curve is representative for
the entire basin. Due to differences in subsidence rates,
the three curves of relative sea-level changes in Fig. 7.4
are offset relative to one another, not only in terms of
magnitudes but also in terms of timing of the high and
low peaks along the curves. The amount of temporal
offset would be even higher for basins undergoing a
more pronounced differential subsidence. Under these
circumstances, which one of these curves should be
chosen as a reference to define the timing of systems
tracts and bounding surfaces (Fig. 4.7)?
None of the ‘static’ curves (related to specific loca-
tions within the basin) in Fig. 7.4 is the perfect candidate
for the reference curve we need. The curve of relative
sea-level changes at location A, which may approxi-
mate the basin margin, is not suitable because it does
not describe changes in accommodation in the shore-
line region, which have a direct impact on the direction
of shoreline shift. The same applies to the curve that
characterizes location C, which may approximate
the basin center, because this location is again far from
the shoreline region so it does not have a direct control
on the direction of shoreline shift. Location B may offer
the closest approximation for the reference curve, as
being closer to an average shoreline position, but it is
not perfect because with time, the shoreline may move
closer or farther away relative to this location.
Two out of the four main events of a full base-level
cycle refer specifically to changes in the direction of
shoreline shifts, from regression to transgression and
vice versa (Figs. 1.7 and 4.7). Even the other two events,
i.e., the onset and end of base-level fall, are also taken,
irrespective of the sequence model of choice, to signify
a change in the type of shoreline shift, from normal to
forced regression and vice versa, respectively (Fig. 3.19).
Hence, all four main events of the reference curve of
base-level changes are linked to the shoreline, implying
changes in the direction and/or the type of shoreline
shift. What is commonly overlooked is the fact that, as
we move away from the shoreline, changes in base level
recorded in other locations may differ significantly
from the reference curve that describes changes in the
direction and/or the type of shoreline shift. For example,
a forced regression (base-level fall at the shoreline)
may well be coeval with a base-level rise offshore, due
to variations in subsidence rates (the case envisaged by
Vail et al., 1984, for the formation of ‘type 2’ sequence
boundaries), and so on (Figs. 7.2–7.4). This means that
the curves of base-level changes that characterize
discrete locations within the basin are offset relative to
one another, as explained above (Fig. 7.4), which requires
us to specify where exactly along each dip-oriented
section the reference curve of base-level changes is
taken.
The shoreline is dynamic, as it continuously changes
its position within the basin as a function of the local
balance between accommodation and sedimentation.
The reference curve of base-level shifts should therefore
describe the changes in accommodation at the shoreline,
wherever the shoreline is within the basin at each time
step. This means that the actual shifts in base level
along the reference curve, in terms of magnitude and
timing, can be quantified by interpolating between the
‘static’ A, B, and C curves, according to the location of
the shoreline at every time step.
REFERENCE CURVE FOR THE DEFINITION OF STRATIGRAPHIC SURFACES 293
50
300
30
0
0
(m)
(Km)
ABC
Sea level
Fluvial environment Marine environment
Shoreline
Pre-existing
stratigraphic succession
FIGURE 7.2 Dip-oriented cross-
section through a hypothetical exten-
sional basin. Locations A, B, and C
are characterized by different subsi-
dence rates, as illustrated in Fig. 7.3.

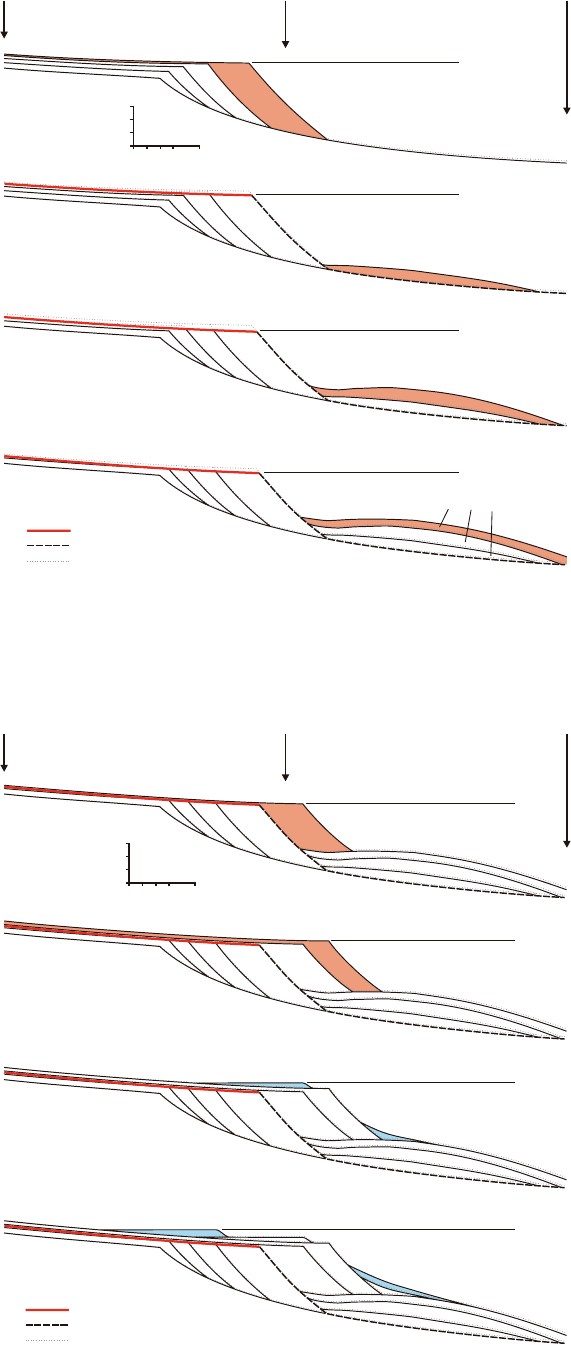
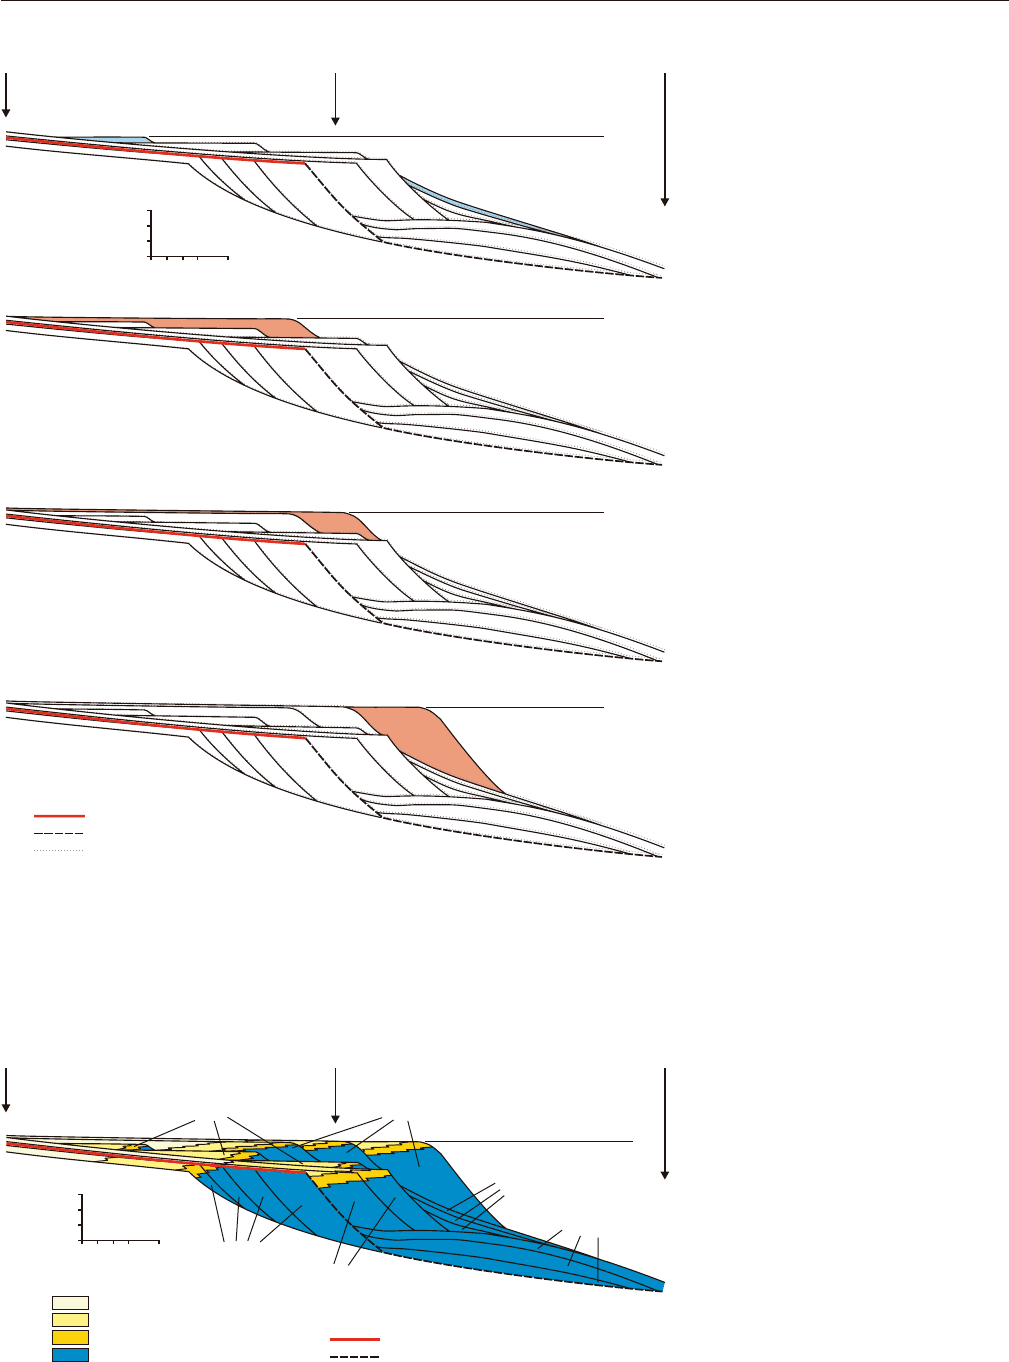
A forward modeling simulation, based on the data
shown in Figs. 7.2–7.4 helps to illustrate these points.
Starting from the initial reference profile in Fig. 7.2, and
based on the sea level and subsidence data in Fig. 7.3,
the stratigraphic architecture is gradually built for the
15 time steps, as illustrated in Figs. 7.5–7.8. The sediment
supply is not quantified in this forward simulation, but
is maintained constant through time by assigning the
same volume of sediment to all depositional wedges
that form at different time steps. The newly accumulated
sedimentary wedge of each time slice is marked with
grey on the forward modeling diagrams (Figs. 7.5–7.8),
and includes fluvial, coastal, and undifferentiated
shallow- to deep-water facies. The amount of accom-
modation created or destroyed at the shoreline during
each time slice was calculated by interpolation
between profiles A and B, or B and C, depending on
the location of the shoreline during that particular
time interval. This amount of available accommodation
is critical to establish how much aggradation or erosion
takes place at the shoreline during each time step,
which also has a direct influence on the rates of progra-
dation or retrogradation. The types of shoreline shifts
are marked on the cross-sections, and the differential
subsidence was taken into account by gradually tilting
the profile from one time step to another accordingly.
The final stratigraphic architecture and facies relation-
ships are shown in Fig. 7.9.
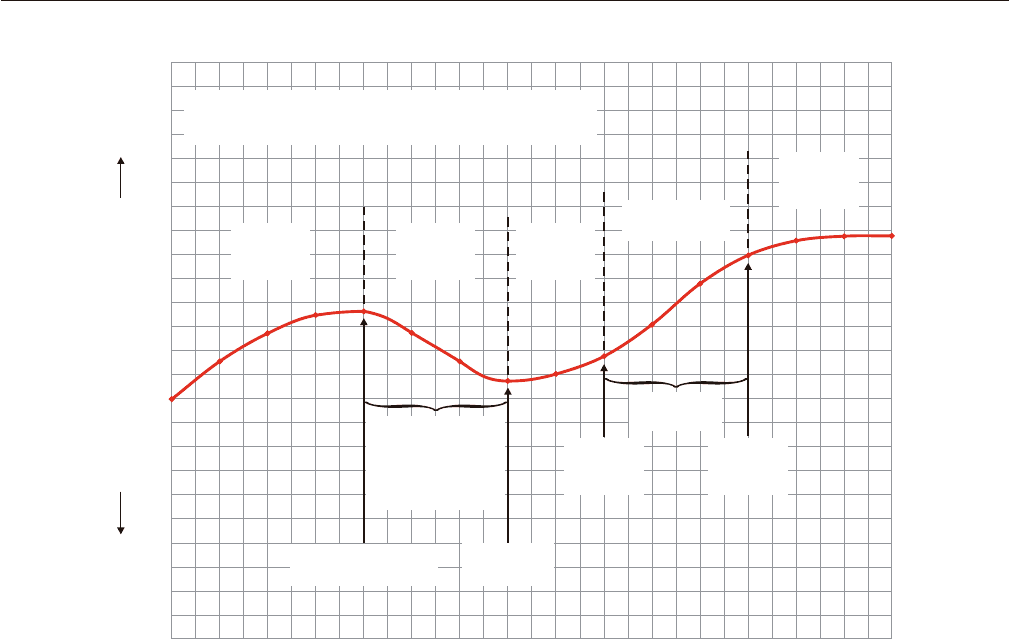
Figure 7.10 illustrates the curve of relative sea-level
changes at the shoreline, which was obtained by inter-
polation between the curves that characterize locations
A, B, and C (Figs. 7.2–7.4), according to the shoreline
position at every time step. This is the reference curve
that sequence stratigraphic models are centered around,
which describes changes in accommodation at the
shoreline. The interplay between sedimentation and this
curve of base-level changes controls the transgressive
and regressive shifts of the shoreline, as marked in the
diagram, and implicitly the timing of all systems
tracts and bounding surfaces. This reference curve is
‘dynamic,’ as it follows the shoreline in its shifts
back and forth along the dip-oriented cross-section, as
opposed to the ‘static’ curves of specific locations
(e.g., A, B, and C in Fig. 7.2).
SHORELINE SHIFTS, GRADING,
AND BATHYMETRY
Controls on Sediment Grading
and Water-depth Changes
In addition to understanding the meaning of the
reference curve of relative sea-level changes (Fig. 7.10), it
is also important to observe the bathymetric trends in
different locations within the basin during the transgres-
sive and regressive shifts of the shoreline. As discussed
in more detail in Chapter 3, water depth at any loca-
tion within the marine basin depends on the interplay
294 7. TIME ATTRIBUTES OF STRATIGRAPHIC SURFACES
0 to 1
1 to 2
2 to 3
3 to 4
4 to 5
5 to 6
6 to 7
7 to 8
8 to 9
9 to 10
10 to 11
11 to 12
12 to 13
13 to 14
14 to 15
0 to 1
1 to 2
2 to 3
3 to 4
4 to 5
5 to 6
6 to 7
7 to 8
8 to 9
9 to 10
10 to 11
11 to 12
12 to 13
13 to 14
14 to 15
0 to 1
1 to 2
2 to 3
3 to 4
4 to 5
5 to 6
6 to 7
7 to 8
8 to 9
9 to 10
10 to 11
11 to 12
12 to 13
13 to 14
14 to 15
30
20
10
0
−20
−30
−20
0
10
20
30
20
10
0
−5
30
20
10
0
−20
−30
−20
0
10
20
30
20
10
0
−5
30
20
10
0
−20
−30
−20
0
10
20
30
20
10
0
−5
35
25
15
5
−15
−25
−15
5
15
25
35
25
15
5
0
30
20
10
0
−20
−30
−20
0
10
20
30
20
10
0
−5
0
0
0
0
0
0
0
0
0
0
0
0
0
0
0
30
50
60
60
40
10
−10
−10
0
20
50
70
80
80
75
Time* - ∆ Subsidence
#
= Σ RSL
+
∆ Eustasy
#
∆ RSL
#
−5
−5
−5
−5
−5
−5
−5
−5
−5
−5
−5
−5
−5
−5
−5
35
60
75
80
65
40
25
30
45
70
105
130
145
150
150
−10
−10
−10
−10
−10
−10
−10
−10
−10
−10
−10
−10
−10
−10
−10
40
30
20
10
−10
−20
−10
10
20
30
40
30
20
10
5
40
70
90
100
90
70
60
70
90
120
160
190
210
220
225
Location A in Figure 7.2Location B in Figure 7.2Location C in Figure 7.2
FIGURE 7.3 Changes in sea level, subsidence, and relative sea
level along the profile in Fig. 7.2, during a period of time of 1.5 Ma
(modified from data provided by H. W. Posamentier). Incremental
changes in sea level, subsidence, relative sea level, and cumulative
relative sea level are shown for time steps of 100.000 years. The
curve of sea-level changes is the same for the three reference loca-
tions in Fig. 7.2. Subsidence rates increase towards the basin, and are
considered to be stable during the 1.5 Ma time interval: 0 m/10
5
years for location A, 5 m/10
5
years for location B, and 10 m/10
5
years for location C. Eustasy combined with subsidence allows for
the calculation of the relative sea-level change (∆ RSL) for each time
step. The cumulative relative sea level (Σ RSL) is calculated in the
last column of the table. Key: * (x 10
5
years),
#
m/10
5
years,
+
m.
0123456789101112131415
380
360
340
320
300
280
260
240
220
200
180
160
140
120
100
80
60
40
20
0
−20
−40
−60
−80
−100
−120
−140
−160
−180
Time (× 10
5
years)
Meters Above and Below Reference Position at Time 0
RSL (Subsidence = −10 m/10
5
years)
RSL (Subsidence = −5 m/10
5
years)
RSL=Eustasy (zero subsidence)
Subsidence=0 m/10
5
years
Subsidence=−5 m/10
5
years
Subsidence=−10 m/10
5
years
FIGURE 7.4 Subsidence, eustatic, and
relative sea-level curves plotted based
on the data provided in Fig. 7.3, for the
1.5 Ma time interval (modified from
data provided by H. W. Posamentier).
Note that for location A (Figs. 7.2 and 7.3),
where subsidence is zero, the sea-level
curve coincides with the relative sea-level
curve. For locations B and C (Figs. 7.2 and
7.3), the relative sea-level curves account
for the combined effects of eustasy and
subsidence.
50
300
30
0
0
Shoreline at time 0
(m)
(Km)
ABC
Time step 1
Time step 2
Time step 3
Time step 0
Sea level (1)
(normal regression)
(normal regression)
(normal regression)
Sea level (2)
Sea level (3)
previous profile, subject to differential subsidence
FIGURE 7.5 Forward modeling simulation
(time steps 1–3) based on the data provided in
Figs. 7.2–7.4. See text for additional explana-
tions. Note that the amount of accommodation
that is being created at the shoreline decreases
with time, which triggers an increase in the
progradation rates. This amount of accommo-
dation is calculated by interpolation between
the relative sea-level curves at locations A and
B (Fig. 7.4), according to the position of the
shoreline during each time slice. Each cross-
section is tilted relative to the previous one
according to the rates of differential subsi-
dence. All facies prograde in relation to the
basinward shift of the shoreline.
50
300
30
0
0
(m)
(Km)
ABC
Time step 4
Time step 5
Time step 6
Time step 7
Sea level (4)
(normal regression)
Sea level (5)
(forced regression)
Sea level (6)
(forced regression)
Sea level (7)
(forced regression)
subaerial unconformity
basal surface of forced regression
previous profile, subject to tilt and erosion
Submarine fan complex
FIGURE 7.6 Forward modeling simulation (time steps
4–7) based on the data provided in Figs. 7.2–7.4. See text
for additional explanations. Note that the top of the
normal regressive deposits is subject to erosion during the
forced regression of the shoreline. As a result, the subaer-
ial unconformity forms. The amount of erosion at the
shoreline is calculated by interpolation between the rela-
tive sea-level curves at locations A and B (Fig. 7.4),
according to the position of the shoreline during each
time slice. Each cross-section is tilted relative to the previ-
ous one according to the rates of differential subsidence.
No offlapping shallow-marine facies are represented, for
simplicity.
50
300
30
0
0
(m)
(Km)
ABC
Sea level (8)
(normal regression)
Sea level (9)
Sea level (10)
(normal regression)
(transgression)
Sea level (11)
(transgression)
Time step 8
Time step 9
Time step 10
Time step 11
subaerial unconformity
basal surface of forced regression
previous profile, subject to differential subsidence
FIGURE 7.7 Forward modeling simulation (time
steps 8–11) based on the data provided in Figs. 7.2–7.4.
See text for additional explanations. Note that the change
from normal regression (time steps 8 and 9) to transgres-
sion (time steps 10 and 11) depends on the interplay of
sedimentation and accommodation at the shoreline. Since
sediment supply is not quantified in this exercise, the
transgression was arbitrarily selected to start with time
step 10, because of the accelerated rates of base-level rise
noted in Fig. 7.4. The amount of available accommodation
at the shoreline is calculated by interpolation between the
relative sea-level curves at locations A, B, and C (Fig. 7.4),
according to the position of the shoreline during each
time slice. Each cross-section is tilted relative to the previ-
ous one according to the rates of differential subsidence.
The rates of progradation and retrogradation change
with time, and are linked to the rates of creation of accom-
modation at the shoreline: the lower the accommodation
at the shoreline, the higher the progradation rates; the
higher the accommodation at the shoreline, the higher the
retrogradation rates.
of subsidence, sea-level change, and sedimentation.
Subsidence and sea-level rise contribute towards water
deepening, whereas sea-level fall and sedimentation
promote water shallowing. In contrast, sediment grad-
ing trends that develop during the same transgressive
and regressive shifts of the shoreline are controlled by
a different set of parameters, which may be independ-
ent of water depth, namely sediment supply and depo-
sitional energy. This section examines the intricate
relationship between shoreline shifts, grading, and
SHORELINE SHIFTS, GRADING, AND BATHYMETRY 297
50
300
30
0
0
(m)
(Km)
A C
Sea level (12)
Sea level (13)
(transgression)
(normal regression)
(normal regression)
Sea level (14)
(normal regression)
Sea level (15)
Time step 12
Time step 13
Time step 14
Time step 15
subaerial unconformity
basal surface of forced regression
previous profile, subject to differential subsidence
B
FIGURE 7.8 Forward modeling simula-
tion (time steps 12–15) based on the data
provided in Figs. 7.2–7.4. See text for addi-
tional explanations. Note that the change
from transgression (time step 12) to normal
regression (time steps 13 to 15) depends on
the interplay of sedimentation and accom-
modation at the shoreline. Since sediment
supply is not quantified in this exercise, the
normal regression was arbitrarily selected
to start with time step 13, because of the
lower rates of base-level rise noted in Fig. 7.4.
The amount of available accommodation at
the shoreline is calculated by interpolation
between the relative sea-level curves at
locations A, B, and C (Fig. 7.4), according to
the position of the shoreline during each
time slice. Each cross-section is tilted rela-
tive to the previous one according to the
rates of differential subsidence. The rates of
progradation and retrogradation change
with time, and are linked to the rates of
creation of accommodation at the shoreline:
the lower the accommodation at the shore-
line, the higher the progradation rates; the
higher the accommodation at the shoreline,
the higher the retrogradation rates.
50
300
30
0
0
(m)
(Km)
ABC
Sea level
subaerial unconformity
basal surface of forced regression
Submarine fan complex
(FSST)
Transgressive wedges
(“marine onlap”)
HST 1
LST
TST
HST 2
fluvial (proximal)
fluvial (distal)/delta plain
coastal
shallow to deep marine
FIGURE 7.9 Stratigraphic architecture of
the succession modeled in Figs. 7.5–7.8
(modified from data provided by
H. W. Posamentier). Abbreviations: LST––
lowstand systems tract; TST––transgressive
systems tract; HST––highstand systems
tract; FSST––falling-stage systems tract.
298 7. TIME ATTRIBUTES OF STRATIGRAPHIC SURFACES
Relative Sea Level at the Shoreline (m)
Rise (+)
280
260
240
220
200
180
160
140
120
100
80
60
40
20
0
−20
−40
−60
−80
−100
−120
−140
−160
−180
Time (× 10
5
years)
0123456789101112131415
Fall (−)
** =correlative conformity sensu Posamentier et al. (1988)
*
sensu Hunt and Tucker (1992)
Normal
regression
(LST)
Forced
regression
(FSST)
Normal
regression
(HST)
Transgression
(TST)
Normal
regression
(HST)
Subaerial
unconformity
and
Regressive surface
of marine erosion
Maximum
regressive
surface
Maximum
flooding
surface
Ravinement
surface
Basal surface of
forced regression
**
Correlative
conformity
*
FIGURE 7.10 Reference curve of relative sea-level changes for the stratigraphic succession in Fig. 7.9.
This curve indicates changes in accommodation at the shoreline, as the shoreline transgresses and regresses
with time. It is therefore a ‘dynamic’ curve, depicting the accommodation budget at different locations
through time. It is the interplay of this reference curve and sedimentation that dictates the timing of all
systems tracts and bounding surfaces.
bathymetry, and the extent of the correlation between
the latter two variables during stages of shoreline
transgression or regression.
Figure 7.11 shows two curves of water-depth
changes in two specified locations, for the 15 time steps
of the forward model run. Water depth is calculated as
the vertical distance between the sea level and the
seafloor at each time step. Note that the transgression
of the shoreline can be safely associated with water
deepening in the basin, assuming that subsidence rates
increase, and sedimentation rates decrease, in a basin-
ward direction. This is usually the norm in divergent-
type settings, as considered in this forward modeling
simulation. The normal regression of the shoreline is
coeval with water shallowing in the vicinity of the shore-
line, and with water deepening offshore, based on the
same assumptions as above. The forced regression
of the shoreline corresponds to water shallowing in
Fig. 7.11, but it may also be coeval with water deepen-
ing beyond the submarine fan or in the absence of a
well-developed submarine fan, depending on the subsi-
dence rates offshore. Under differential subsidence
conditions, it is conceivable that low subsidence rates
may be outpaced by eustatic fall at the shoreline (base-
level fall, and forced regression of the shoreline, result-
ing in water shallowing in the vicinity of the shoreline),
whereas higher subsidence rates may outpace the sum
of eustatic fall and sedimentation offshore (hence water
deepening beyond a point of balance between subsi-
dence, sea-level fall and sedimentation).
So what is the relationship between shoreline shifts,
grading of marine deposits, and water-depth changes?
We can take as an example the normal regressive delta
that progrades into the basin between time steps 1
and 4 (Fig. 7.11). Sediment entry points shift towards
the basin during this time interval, so the succession is
coarsening upward, from offshore pelagic (time step 1)
to prodelta (time step 2) to delta front deposits (time
steps 3 and 4) (reference location 1 in Fig. 7.11). Prodelta
facies (thin bottomset, not represented in Fig. 7.11 for
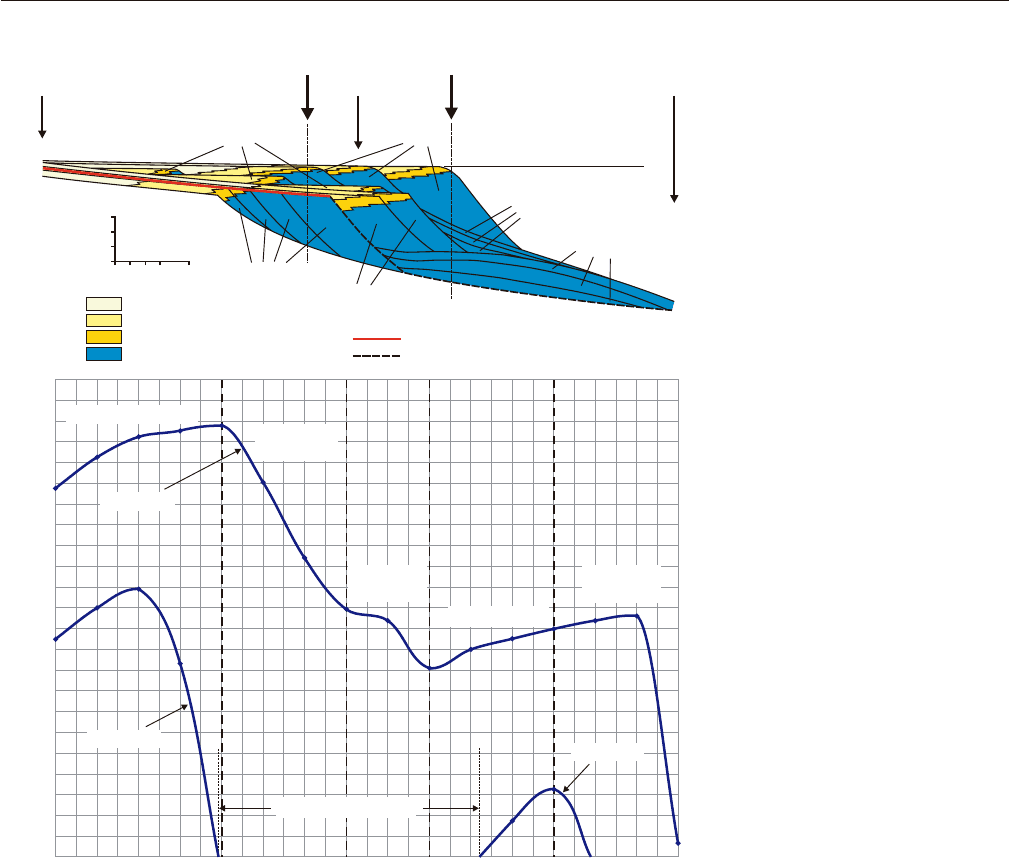
simplicity) are characterized by the presence of silt-size
riverborn sediments, which gradually prograde over
the finer pelagic basinal facies. In turn, the silty prodelta
sediments are prograded by the sand-dominated delta
front facies, which generates the overall coarsening-
upward trend. At the same time, the bathymetric profile
shows a deepening of the water during time steps 1
and 2, followed by shallowing as soon as the point of
observation (location 1 in Fig. 7.11) becomes part of the
subtidal (delta front) environment. The deepening of
the water during the deposition of shelf and overlying
prodelta facies (time steps 1 and 2) is due to the fact
that sedimentation rates are too low to keep up with the
rates of creation of accommodation. For time steps 3
and 4, the shallowing of the water is driven by the much
higher sedimentation rates in the delta front environ-
ment, which outpace the rates of base-level rise. This
example shows that the water-depth/grain-size rela-
tionship is not necessarily linear, as commonly assumed,
meaning that an increase in water depth does not have
to be accompanied by a decrease in size of the sediment
delivered to that particular location.
The generally assumed linear relationship between
water depth, depositional energy, and grain size is
modified by other parameters such as slope (gradient
of seafloor) and the associated gravity-driven
subaqueous flows (Figs. 6.15, 7.12, and 7.13), and, most
importantly, by changes in sediment supply associated
SHORELINE SHIFTS, GRADING, AND BATHYMETRY 299
50
300
30
0
0
(m)
(Km)
ABC
Sea level
subaerial unconformity
basal surface of forced regression
Submarine fan complex
(FSST)
Transgressive wedges
("marine onlap")
HST 1
LST
TST
HST 2
fluvial (proximal)
fluvial (distal)/delta plain
coastal
shallow to deep marine
Water Depth (m)
0123456789101112131415
460
440
420
400
380
360
340
320
300
280
260
240
220
200
180
160
140
120
100
80
60
40
20
0
Time (× 10
5
years)
Location 1
Location 1
Location 2
Location 1
Forced
Regression
Normal
Regression
Normal
Regression
Transgression
Subaerial Exposure
Normal Regression
Location 2
FIGURE 7.11 Water-depth changes
through time, at locations 1 and 2 indi-
cated on the cross-section. See text for
explanations. Abbreviations: LST––
lowstand systems tract; TST––transgressive
systems tract; HST––highstand systems
tract; FSST––falling-stage systems tract.
