Awange J.,Grafarend E., Palancz B., Zaletnyik P. Algebraic Geodesy and Geoinformatics
Подождите немного. Документ загружается.

10-5 Three-dimensional orientation problem 149
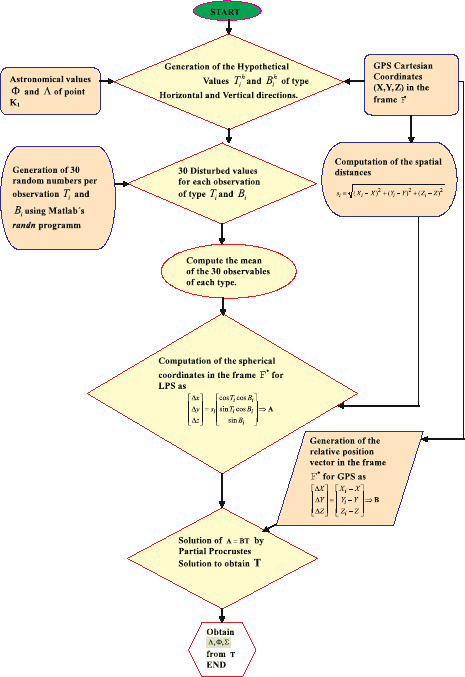
Figure 10.1. Flow chart for computing three-dimensional orientation parameters
10-52 Determination of vertical deflection
As soon as we have determined the astronomical longitude Λ
Γ
and astronomi-
cal latitude Φ
Γ
, the deflection of the vertical can be computed with respect to
a well chosen reference frame, e.g., the ellipsoidal normal vector field. Tradition-
ally, orientation parameters {Λ
Γ
, Φ
Γ
} have been obtained from stellar observations
and related to geodetic coordinates {λ, φ} to obtain the deflection of the vertical.
Through the integration of GPS and LPS systems however, the astronomical ob-
servations of type {Λ
Γ
, Φ
Γ
} are obtained from the three-dimensional orientation
solutions as discussed in Sect. 10-5. Such pioneering approach in geodesy can be
traced to the works of [16, 52, 168, 187].
To determine the vertical deflection, the reference direction is parameterized in
terms of “surface normal”; ellipsoidal longitude λ and ellipsoidal latitude φ. These
are then subtracted from the local vertical parameterized in terms of astronomical
longitude Λ
Γ
and astronomical latitude Φ
Γ
as
150 10 LPS-GNSS orientations and vertical deflections
Λ
Γ
− λ
Φ
Γ
− φ,
(10.24)
to access the vertical deflections. In such a procedure, the topographical surface
which is embedded into a three-dimensional Euclidean space R
3
is mapped point-
wise into a reference ellipsoid of revolution through the procedure discussed in
Chap. 11. Indeed as outlined in Solution 11.5 on p. 165 for instance, those di-
rection parameters {Λ, Φ} are conveniently computed from GPS Cartesian coor-
dinates {X, Y, Z} of the station point with respect to the global reference frame
{F
1
•
, F
2
•
, F
3
•
}. The deflection of the vertical is then computed from (10.24) as
δΛ
Γ
:= Λ
Γ
− λ, δΦ
Γ
:= Φ
Γ
− φ
η := δΛ
Γ
cos Φ, ξ := δΦ
Γ
.
(10.25)
Equation (10.25) are simple representation of the east vertical deflection η and
the north vertical deflection ξ. The results in Table (3.1) of [168] document the
precise determination of the orientation parameters of type astronomic longitude
Λ
Γ
, astronomic latitude Φ
Γ
, horizontal orientation unknown Σ
Γ
in the range of
fraction of seconds of arc as well as vertical deflection {ξ, η} in the same range
exclusively from GPS-LPS observations.
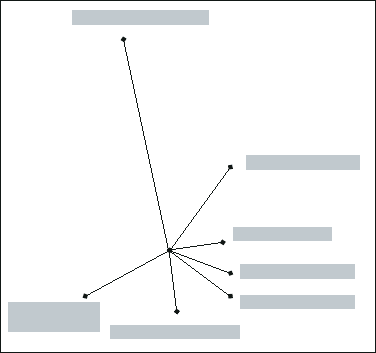
10-6 Example: Test network Stuttgart Central
Haußmannstr. (1324.238 m)
Schloßplatz (566.864 m)
Dach FH (269.231 m)
Dach LVM (400.584 m)
Liederhalle (430.529 m)
Lindenmuseum (364.980 m)
Eduardpfeiffer
(542.261 m)
K1
Figure 10.2. Graph of the Test network “Stuttgart Central”
10-6 Example: Test network Stuttgart Central 151
Observations and experiment
The following experiment was performed at the center of Stuttgart on one of the
pillars of Stuttgart University’s building along Kepler Strasse 11 as depicted by
Fig. 10.2. The test network “Stuttgart Central” consisted of 8 GPS points listed in
Table 10.1. A theodolite was stationed at pillar K1 whose astronomical longitude
Λ
Γ
as well as astronomic latitude Φ
Γ
were known from previous astrogeodetic
observations made by the Department of Geodesy and Geoinformatics, Stuttgart
University. Since theodolite observations of type horizontal directions T
i
as well as
vertical directions B
i
from the pillar K1 to the target points i, i = 1, 2, . . . , 6, 7,
were only partially available, the horizontal and vertical directions were simulated
from the given values of {Λ
Γ
, Φ
Γ
} as well as the Cartesian coordinates of the sta-
tion point {X, Y, Z} and target points {X
i
, Y
i
, Z
i
} using (10.18) and (10.19). The
relationship between the observations of type horizontal directions T
i
, vertical di-
rections B
i
, values of {Λ
Γ
, Φ
Γ
} and the Cartesian coordinates of the station point
{X, Y, Z} and target points {X
i
, Y
i
, Z
i
} enabled generation of the observation data
sets in Table 10.3. Such a procedure had also an advantage in that we had full con-
trol of the algorithms that will be tested later in the book. In detail, the directional
parameters {Λ
Γ
, Φ
Γ
} of the local gravity vector were adopted from the astrogeode-
tic observations φ
Γ
= 48
◦
46
0
54
00
.9 and Λ
Γ
= 9
◦
10
0
29
00
.8 reported by [257, p. 46]
with a root-mean-square error σ
Λ
= σ
Φ
= 10
00
. Table 10.1 contains the {X, Y, Z}
coordinates obtained from a GPS survey of the test network Stuttgart Central,
in particular with root-mean-square errors (σ
X
, σ
Y
, σ
Z
) neglecting the covariances
(σ
XY
, σ
Y Z
, σ
ZX
). The spherical coordinates of the relative position vector, namely
of the coordinate differences {x
i
−x, y
i
−y, z
i
−z}, are called horizontal directions
T
i
, vertical directions B
i
and spatial distances S
i
and are given in Table 10.2. The
standard deviations/root-mean-square errors were fixed to σ
T
= 6“, σ
B
= 6
00
. Such
root mean square errors can be obtained on the basis of a proper refraction model.
Since the horizontal and vertical directions of Table 10.2 were simulated, with zero
noise level, we used a random generator randn in Matlab e.g., [207, p. 84, p. 144]
to produce additional observational data sets within the framework of the given
root-mean-square errors. For each observable of type T
i
and B
i
, 30 randomly sim-
ulated data were obtained and the mean taken. Let us refer to the observational
data sets {T
i
, B
i
}, i = 1, 2, . . . , 6, 7, of Table 10.3 which were enriched by the root-
mean-square errors of the individual randomly generated observations as well as
by the differences ∆T
i
:= T
i
− T
i
(generated), ∆B
i
:= B
i
− B
i
(generated). Such
differences (∆T
i
, ∆B
i
) indicate the difference between the ideal values of Table
10.2 and those randomly generated.
Observations are thus designed such that by observing the other seven GPS
stations, the orientation of the local level reference frame F
∗
whose origin is station
K1, to the global reference frame F
•
is obtained. The direction of Schlossplatz was
chosen as the zero direction of the theodolite leading to the determination of the
third component Σ
Γ
of the three-dimensional orientation parameters. To each of
the GPS target points i, the observations of type horizontal directions T
i
and the
vertical directions B
i
are measured. The spatial distances S
2
i
(X, X
i
) = kX
i
− Xk
are readily obtained from the observation of type horizontal directions T
i
and

152 10 LPS-GNSS orientations and vertical deflections
vertical directions B
i
. The following symbols have been used: σ
X
, σ
Y
, σ
Z
are the
standard errors of the GPS Cartesian coordinates. Covariances σ
XY
, σ
Y Z
, σ
ZX
are
neglected. σ
T
, σ
B
are the standard deviation of horizontal and vertical directions
respectively after an adjustment, ∆
T
, ∆
B
are the magnitude of the noise on the
horizontal and vertical directions, respectively.
Table 10.1. GPS Coordinates in the global reference frame F
•
(X, Y, Z), (X
i
, Y
i
, Z
i
),
i = 1, 2, . . . , 7
Station
1
X(m) Y (m) Z(m)
σ
X
mm
σ
X
mm
σ
X
mm
Dach K1 4157066.1116 671429.6655 4774879.3704 1.07 1.06 1.09
1 4157246.5346 671877.0281 4774581.6314 0.76 0.76 0.76
2 4156749.5977 672711.4554 4774981.5459 1.77 1.59 1.61
3 4156748.6829 671171.9385 4775235.5483 1.93 1.84 1.87
4 4157066.8851 671064.9381 4774865.8238 1.38 1.29 1.38
5 4157266.6181 671099.1577 4774689.8536 1.29 1.28 1.34
6 4157307.5147 671171.7006 4774690.5691 0.20 0.10 0.30
7 4157244.9515 671338.5915 4774699.9070 2.80 1.50 3.10
Table 10.2. Ideal spherical coordinates of the relative position vector in the lo cal level
reference frame F
∗
: Spatial distances, horizontal directions, vertical directions
Station Observed Distances Horizontal Vertical
from K1 (m) directions(gon) directions(gon)
Schlossplatz (1) 566.8635 52.320062 -6.705164
Haussmanstr. (2) 1324.2380 107.160333 0.271038
Eduardpfeiffer (3) 542.2609 224.582723 4.036011
Lindenmuseum (4) 364.9797 293.965493 -8.398004
Liederhalle (5) 430.5286 336.851237 -6.941728
Dach LVM (6) 400.5837 347.702846 -1.921509
Dach FH (7) 269.2309 370.832476 -6.686951
Table 10.3. Randomly generated spherical coordinates of the relative position vector:
horizontal directions T
i
and vertical directions B
i
, i = 1, 2, . . . , 6, 7, root-mean-square
errors of individual observations, differences ∆T
i
:= T
i
− T
i
(generated), ∆B
i
:= B
i
−
B
i
(generated) with respect to (T
i
, B
i
) ideal data of Table 10.2
St. H/dir.(gon) V/dir.(gon) σ
T
(gon) σ
B
(gon) ∆
T
(gon) ∆
B
(gon)
1 0.000000 -6.705138 0.0025794 0.0024898 -0.000228 -0.000039
2 54.840342 0.271005 0.0028756 0.0027171 -0.000298 0.000033
3 172.262141 4.035491 0.0023303 0.0022050 0.000293 0.000520
4 241.644854 -8.398175 0.0025255 0.0024874 0.000350 0.000171
5 284.531189 -6.942558 0.0020781 0.0022399 -0.000024 0.000830
6 295.382909 -1.921008 0.0029555 0.0024234 0.000278 -0.000275
7 318.512158 -6.687226 0.0026747 0.0024193 -0.000352 0.000500
10-7 Concluding remarks 153
10-7 Concluding remarks
What is presente d here is just a nutshell of GNSS. For more exposition of its
operations and techniques, we refer to related publications, e.g., [124, 192, 227, 228,
264, 296, 361, 372, 419, 43]. For LPS systems, more insight c an be found in [170,
175] and [345, p. 28]. In particular, for cases where the theodolite moves from
point to point, i.e., moving horizontal triad, [158, 161, 164] presents interesting
materials.
We point out that there are other methods capable of providing vertical de-
flections e.g.,GPS and levelling [398], gravimetric geoid models [132] and modern
CCD-Zenith cameras [222, 223, 224, 225, 226]. References to non-astronomical
methods capable of determining deflections are presented in Hirt [226]. Further
tests are required to assess the real efforts and the accuracy level related to the
application of the GPS and LPS method for determination of vertical deflections.

11 Cartesian to ellipsoidal mapping
11-1 Introductory remarks
In establishing a proper reference frame of geodetic point positioning, namely by
the Global Positioning System (GPS) - the Global Problem Solver - we are in need
to establish a proper model for the Topography of the Earth, the Moon, the Sun
or planets.By the theory of equilibrium figures, we are informed that an ellipsoid,
two-axes or three-axes is an excellent approximation of the Topography. For planets
similar to the Earth the biaxial ellipsoid, also called “ellipsoid-of-revolution” is the
best approximation.
It was C.F. Gauss in his work on “Gauss-Krulger Maps” or “Universal Marca-
tor Projection” relating to the “ellipsoid-of-revolution” who designed the elegant
method of mapping a reference ellipsoid onto a topographic surface. He used the
orthogonal projection of a topographic point onto the reference ellipsoid. Million
times per day in any GPS receiver the Gauss projection onto the reference ellipsoid
of type formula (11.1), (11.2) is used to compact Cartesian coordinates (X, Y, Z)
from determined (geodetic longitude, geodetic latitude, surface height) and its
inverse.
Here we meet the problem of solving a biquadratic equation in closed form.
Various solutions exist which we present in Table 11.1 in short. Of course there are
many more and other approaches. The minimum distance mapping of a star-shaped
surface onto the reference ellipsoid is given by Solution 11.3. The constrained
minimum distance mapping is analyzed by Lemma 11.1, its solution is presented
by (i) the Grafarend-Lohse mapping and (ii) the Groebner Basis mapping, and (iii)
the Extended Newton-Raphson mapping enriched by numerical examples.
11-2 Mapping topographical points onto reference ellipsoid
The projection of points from the topographical surface to their equivalent on the
reference ellipsoid remains one of the fundamental tasks undertaken in geodesy
and geoinformatics. This is because the reference ellipsoid of revolution is the
mathematical representation of the geoid. Geoid is the surface that approximates
mean sea level, and provides vertical datum for heights. It is of prime importance in
engineering and geosciences in general. From it, geophysicists can infer on processes
taking place below and above the Earth such as earthquakes and rise in sea level.
Hydrologists need it to infer on water table, while engineers need it for height
determination during roads and structural constructions.
Measurements are normally related to the geoid for computation via its mathe-
matical form, the reference ellipsoid of revolution. There exist two ways of project-
ing points from a topographical surface onto the reference ellipsoid of revolution.
One approach projects a point P onto the geoid p
g
and then finally onto the
reference ellipsoid of revolution p. This type of projection is c alled the Pizetti’s
J.L. Awange et al., Algebraic Geodesy and Geoinformatics, 2nd ed.,
DOI 10.1007/978-3-642-12124-1 11,
c
Springer-Verlag Berlin Heidelberg 2010
156 11 Cartesian to ellipsoidal mapping
projection. The other approach directly projects a topographical point P through
the ellipsoidal normal onto a point p on the reference ellipsoid of revolution. The
distance between the topographical point P and the ellipsoidal point p gives the
geometrical height H above the ellipsoid. The topographical position of point P
would therefore be referred by the ellipsoidal height H and the geographical coor-
dinates L, B. In this case, the geographical coordinate L is the longitude and B the
latitude. The set of coordinates {L, B, H} defining the point P are called geodetic
or ellipsoidal coordinates. This second projection is called the Helmert’s projec-
tion which will be considered in this chapter. The two projections are discussed in
detail in [220, pp. 178–184].
The forward transformation from ellipsoid to Cartesian coordinates, i.e., {L, B, H}
→ {X, Y, Z}, is demonstrated by Solutions 11.1 and 11.2. The challenge is the in-
verse transformation which projects topographical points to the ellipsoid. One
way of achieving this projection is by first converting topographical Cartesian co-
ordinates into ellipsoidal cartesian coordinates. Once this is done, the ellipsoidal
Cartesian coordinates are then converted to their equivalent geodetic coordinates.
The problem is formulated as follows: Given topographical coordinates {X, Y, Z}
of a point P , obtain the geodetic coordinates {L, B, H}. This problem is a one-to-
one mapping of
{X, Y, Z} −→ {L, B, H}
T opography Ellipsoid
(11.1)
Table 11.1 outlines the existing methods by other authors to convert Cartesian
coordinates {X, Y, Z} to Gauss ellipsoidal coordinates {L, B, H} in (11.1). The
target of this chapter is to invert algebraically {X, Y, Z} → {L, B, H} by means
of minimum distance mapping through the map in (11.2) as
{X, Y, Z} −→ {x
1
, x
2
, x
3
} −→ {L, B, H}
T opography Ellipsoid Ellipsoid.
(11.2)
Grafarend [165] already constructed surface normal coordinates with respect
to the international reference ellipsoid. In this chapter, we will be interested with
setting up an algebraic minimum distance mapping to relate a point on the Earth’s
topographical surface uniquely (one-to-one) to a point on the international refer-
ence ellipsoid. The solution to such an optimization problem generates projective
ellipsoidal heights and the standard transformation of the Gauss ellipsoidal co-
ordinates {L, B, H} to geocentric Cartesian coordinates {X, Y, Z}. The inverse
transformation of geocentric Cartesian coordinates {X, Y, Z} to Gauss ellipsoidal
coordinates {L, B, H} is here solved algebraically and examples presented.

11-2 Mapping topographical points onto reference ellipsoid 157
Table 11.1. Characteristics of inverse transformation Cartesian coordinates to Gauss
ellipsoidal coordinates
Author Publication Characteristic
year
Awange et al. [39] in press closed (similar to [14])
Bartelme N, Meissl P [58] 1975 iterative
Benning W [70] 1974 closed
Benning W [71] 1987 iterative first point curve
Borkowski KM [88] 1987 iterative
Borkowski KM [89] 1989 iterative
Bowring BR [90] 1976 approximate “closed”
Bowring BR [91] 1985 approximate
Croceto N [119] 1993 iterative
Fitzgibbon A et al. [136] 1999 iterative
Fotiou A [139] 1998 approximate “closed”
Fr¨ohlich H, Hansen HH [142] 1976 closed
Fukushima T [144] 1999 “fast” iterative
Gander W et al. [145] 1994 iterative
Grafarend EW [166] 2001 closed
Grafarend EW, Lohse P [172] 1991 closed form 4th order equation
reduced to 3rd order
Grafarend EW et al. [190] 1995 closed form
Heck B [217] 1987 iterative
Heikkinen M [218] 1982 closed
Heiskannen WA, Moritz H [220] 1976 iterative
Hirvonen R, Moritz H [221] 1963 iterative
Hofman-Wellenhof B et al. [227] 2001 Identical to Bowring [90]
Lapaine M [260] 1990 algebraic equations of higher order
Lin KC, Wang J [274] 1995 iterative
Loskowski P [278] 1991 “simply iterative”
Ozone MI [316] 1985 3rd order equation
Paul MK [327] 1973 iterative
Penev P [328] 1978 Angular variable 3rd order equation
Pick M [330] 1985 approximate “closed”
Sj¨oberg LE [364] 1999 iterative
Soler T, Hothem LD [365] 1989 iterative “closed” Jacobi
ellipsoidal coordinates
S¨unkel H [376] 1976 series expansion
Torge W [384] 1991 iterative
Vaniceck P, Krakiwski E [390] 1982 higher order algebraic equation
Vincenty T [395] 1978 Iterative
Vincenty T [396] 1980 approximate “closed”
You RJ [427] 2000 iterative

158 11 Cartesian to ellipsoidal mapping
Solution 11.1 (Forward transformation of Gauss ellipsoidal coordinates).
X(L, B, H) = e
1
"
a
p
1 −e
2
sin
2
B
+ H(L, B)
#
cos B cos L +
e
2
"
a
p
1 −e
2
sin
2
B
+ H(L, B)
#
cos B sin L +
e
2
"
a(1 −e
2
)
p
1 −e
2
sin
2
B
+ H(L, B)
#
sin B, (11.3)
X
Y
Z
=
a
√
1−e
2
sin
2
B
+ H(L, B)
cos B cos L
a
√
1−e
2
sin
2
B
+ H(L, B)
cos B sin L
a(1−e
2
)
√
1−e
2
sin
2
B
+ H(L, B)
sin B
, (11.4)
with {(L(X, Y, Z), B(X, Y, Z), H(X, Y, Z)} as unknowns.
Solution 11.2 (Forward transformation of Gauss complex ellipsoidal co-
ordinates). Consider
X + iY =
"
a
p
1 −e
2
sin
2
B
+ H(L, B)
#
cos B(cos L + i sin L), (11.5)
and
Z =
"
a(1 −e
2
)
p
1 −e
2
sin
2
B
+ H(L, B)
#
sin B, (11.6)
then
X =
X + iY Z
−Z X − iY
∈ C
2×2
(11.7)
11-3 Mapping geometry
In [165], Gauss surface normal coordinates with respect to the international ref-
erence ellipsoid E
2
a,a,b
are introduced and called {l, b}. The Gauss surface normal
longitude is represented by l (geodetic longitude) and the Gauss surface normal
latitude by b (geodetic latitude). Such a coordinate system build up the proper
platform for introducing surface normal coordinates {L, B, H} for mapping the
Earth’s topographical surface T
2
with respect to the international reference el-
lipsoid. In particular, the minimum distance mapping which maps a topographic
point P ∈ T
2
onto a nearest point p ∈ E
2
a,a,b
on the international reference el-
lipsoid is implemented. Such mapping, initiated by C. F. Gauss, is isozenithal
since {l = L, b = B} : The orthogonal projection of P ∈ T
2
onto p ∈ E
2
a,a,b
as
11-3 Mapping geometry 159
the nearest point is along the surface normal of E
2
a,a,b
. The minimum distance
from point p to P , i.e., pP is called accordingly ellipsoidal height H (“geodetic
height”) complemented by surface normal longitude l = L and surface normal
latitude b = B.
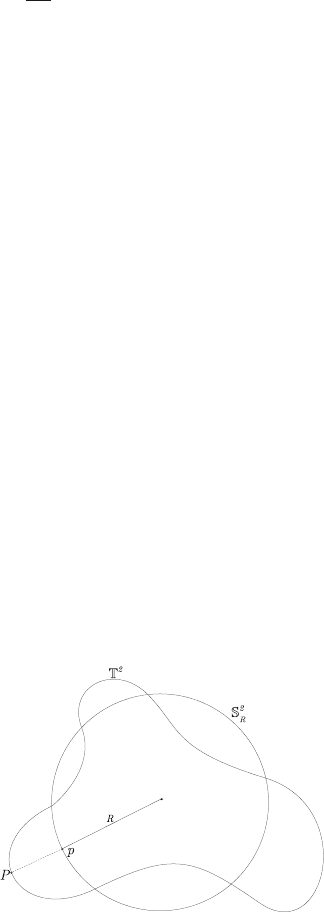
In-order to gain a unique solution of minimum distance mapping, the as sump-
tion that the Earth’s topographical surface is starshaped has to be made. Figure
11.1 illustrates a topographical surface which is starshaped, while Fig. 11.2 illus-
trates that which is not. With respect to these figures, the notion of a starshaped
compact (closed and bounded) topographical surface may be obvious.
Definition 11.1 (Starshaped surface). A region M ∈ R
3
is starshaped with
respect to a point P ∈ R
3
, if the straight line which connects an arbitrary point
Q ∈ M with P lies in M . We call a surface starshaped, if it forms the boundary
of a starshaped region.
It is understood that the shape of a star guarantees that the minimum distance
mapping of topographical surfaces in R
3
onto the average sphere S
2
R
(“Bjerhammer
sphere”) is one-to-one. If the minimum distance mapping would not be one-to-one,
it might happen that a point on the average sphere S
2
R
has more than one image
on the topographical surface. Here the condition of starshaped has to be relaxed
if the topographic surface T
2
⊂ R
3
is mapped onto the international reference
ellipsoid E
2
a,a,b
, an ellipsoid of revolution of semi-major axis a and semi-minor
axis b. If any surface normal to the ellipsoid of revolution E
2
a,a,b
intersects the
topographical surface only once, the top ographical surface is ellipsoidal starshaped.
Indeed this condition is not met by any arbitrary topographical surface like the
Earth’s. Instead we shall assume that we have properly regularized the Earth’s
topographical surface to meet our requirement. Otherwise the Gauss ellipsoidal
coordinates {L, B, H} would break down! Figures 11.3 and 11.4 gives a better
insight into the notion of ellipsoidal starshaped and anti-ellipsoidal starshaped.
Figure 11.1. Minimum distance mapping, starshaped topographic surface (orthogonal
projection of P ∈ T
2
onto p ∈ S
2
R
)
