Austin E W., Pinkleton B.E. Strategic Public Relations Management. Planning and Managing Effective Communication Programs
Подождите немного. Документ загружается.

114 CHAPTER 6
As we planned our campaign, we could make inferences about the popu-
lation (all students at our university) based on the responses of our sample.
Error occurs when researchers take measurements from a sample and use
them to make inferences about a population because there are differences
between a sample distribution and a population distribution. We could
not determine the exact average number of cigarettes smoked weekly by
students at our university, for example, unless we conducted a census by
interviewing every student. We did not conduct a census in this exam-
ple and because of this, the responses of our sample would not exactly
represent the true responses of the population. In our smoking survey, our
sample mean for cigarettes smoked in the past 7 days might be 3.5, whereas
the true value for the population might be 3.8. The difference between the
opinions and behaviors of the sample and the opinions and behaviors of
the population is error.
As researchers, we must understand this error, so we use a tool to mea-
sure it called standard deviation. Standard deviation is a standardized mea-
sure of dispersion (or variation) around a mean. Basically, a standard devia-
tion is a standardized unit of measurement that researchers use to measure
distances from a sampling distribution’s midpoint to its outer limits (don’t
get lost here). Think of standard deviation as a simple unit of measurement.
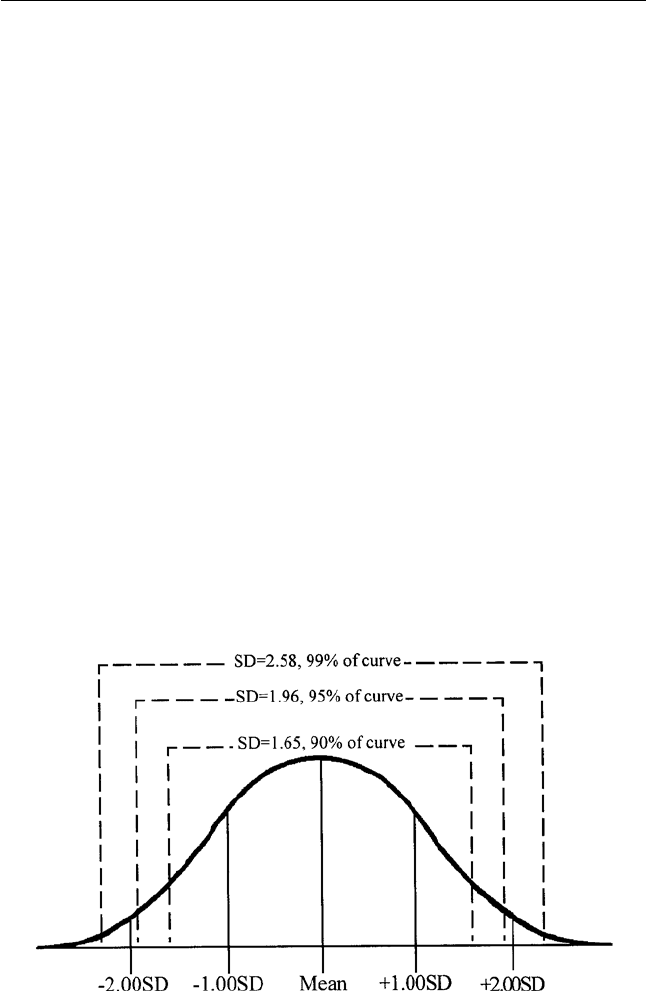
Researchers use standard deviation to measure distance from the mean in
a bell-shaped curve in the same way a carpenter uses inches to measure
the length of a board, as Figure 6.3 shows.
Researchers use standard deviation for various purposes. If the publish-
ers of a book survey 10 people and ask them to read and rate it using a
FIG. 6.3. Normally distributed bell-shaped curve. Along the normal distribution, 1.65 standard
deviations (SD) measure 90% of the curve; 1.96 standard deviations measure 95% of the curve;
and 2.58 standard deviations measure 99% of the curve.

SAMPLING 115
scale of 0 to 10, for example, the text might receive an average rating of 5.
If all 10 people who read the book actually rated the text as a 5, the average
rating is highly accurate and there is no standard deviation. If 5 people rate
the text as a 10, however, and 5 people rate the text as a 0, the mean rating
still is 5. This time, however, the average rating is not very accurate. No
one, in fact, actually gave the text a 5 rating. The standard deviation would
be relatively large because there is a lot of dispersion among the scores.
Although the means are the same in each case, they actually are different,
and standard deviation helps us measure and understand this. Using our
smoking survey example, if every participant in our smoking survey said
they smoked 3.5 cigarettes in the past 7 days, our mean would be highly
accurate and we would have no deviation from the mean. When we ask
sample members about their smoking habits, however, we will undoubt-
edly receive different responses, and we can use the mean and standard
deviation to understand these responses.
How do standard deviation and sample distribution help us when
we calculate sample size? A standard deviation gives researchers a ba-
sis for estimating the probability of correspondence between the normally
distributed, bell-shaped curve of a perfect population distribution and a
probability-based sample distribution that always contains some error. Re-
searchers call standard deviation measurements standard because they as-
sociate with, or measure, specific areas under a normal curve. One standard
deviation measures about 68% of a normally distributed curve; two stan-
dard deviations measure a little more than 95% of a normally distributed
curve; and three standard deviations measure more than 99% of a normally
distributed curve. Research professionals use standard deviations to de-
termine the confidence level associated with a sample, as we demonstrate
later in this chapter.
Confidence Level
A confidence level is the degree of certainty researchers can have when they
draw inferences about a population based on data from a sample. Basically,
it is the level of probability researchers have that they can accurately gen-
eralize a characteristic they find in a sample to a population. In essence,
the confidence level answers the question, “How confident are we that
our sample is representative of the population?” A confidence level of
90% means researchers are 90% confident that the sample accurately rep-
resents the population. In the same way, a confidence level of 95% means
researchers are 95% confident that the inferences they draw about the pop-
ulation from the sample are accurate.
This raises an important question: Are researchers really 90% or 95%
confident about the representativeness of the sample, or are they simply
guessing, perhaps based on their experience? In fact, researchers’ claims

116 CHAPTER 6
of a confidence level are accurate because the confidence level is based on
standard deviations. Remember, a standard deviation allows researchers
to estimate probability between a normally distributed population curve
and a less-than-perfect sampling distribution because standard deviation
measurements associate with specific areas under the curve. A standard
deviation of 1.65 measures 90% of a normally distributed curve, a standard
deviation of 1.96 measures 95% of a normally distributed curve, and a
standard deviation of 2.58 measures 99% of a normally distributed curve
(remember these numbers because we will use them again shortly).
This means that when researchers calculate sample size, they select stan-
dard deviations associated with specific areas under a normally distributed
curve to provide the desired confidence level. When investigators use 1.65
in the sample-size formula, they calculate a sample size that provides a
90% confidence level; when they use 1.96 in the formula, they calculate a
sample size that provides a 95% confidence level; when they use 2.58 in
the formula, they calculate a sample size that provides a 99% confidence
level.
Most often, researchers use 1.96 standard deviations to calculate sample
size, resulting in a 95% confidence level. A confidence level of 95% means
our sample statistics will more-or-less accurately represent the true param-
eter of a population 95% of the time. Here is another way to think about
this: If we conducted a survey of the same population 100 times, our sam-
ple responses would be accurate in 95 of the 100 surveys we conducted.
The 95% confidence level is a standard convention of social science, but
researchers can use other confidence levels. In particular, if researchers de-
sire an exceptionally high degree of confidence when making inferences
about a population based on data from a sample, they may choose a higher
confidence level. Rarely do researchers use a lower confidence level.
Confidence Interval
A confidence interval is a range or margin of error that researchers permit
when making inferences from a sample to a population. As noted, the in-
ferences researchers make about a population based on sample data are not
completely accurate. Unless investigators conduct a census, the observed
values they collect from a sample (statistics) will not provide completely
accurate information concerning a population’s true values (parameters).
The population parameter falls somewhere within the range of the con-
fidence interval, although researchers never are exactly sure where the
parameter is located unless they conduct a census. The confidence interval
usually is stated as a positive-to-negative range, such as ±3% error or ±5%
error. A confidence interval of ±3% has a total error margin of 6%, whereas
a confidence interval of ±5% has a total error margin of 10%. If 57% of
registered voters in California express support for a citizens’ initiative in a

SAMPLING 117
survey with a ±5% confidence interval, for example, the true population
value may be as high as 62% (+5%) or as low as 52% (−5%).
What is an acceptable confidence interval for survey results? As is of-
ten the case in survey research, the answer depends on various factors.
Many applied communication and market research surveys have a ±5%
confidence interval, but there is nothing critical about this range of error.
Researchers commonly choose smaller confidence levels when they want
to reduce the margin of error and increase the precision of the inferences
they draw concerning a population. When media organizations poll the
public to predict election outcomes, for example, they often use a smaller
confidence interval, such as ±3%. Ultimately, researchers should make de-
cisions about confidence intervals based on the necessities and challenges
of individual research projects.
It may surprise you to learn that the confidence level and the confidence
interval do not have to add to 100%. Those new to research often assume
the confidence level and confidence interval must add to 100% because
researchers often conduct surveys with a ±5% error at a 95% confidence
level. It is incidental that these numbers add up to 100. It is legitimate to
conduct a survey with a ±3% margin of error at a 95% confidence level,
for example, or a survey with a ±2.5% margin of error at a 99% confi-
dence level. In addition, many researchers use a 95% confidence level as
a standard and only make adjustments to the confidence interval when
calculating sample size. As we noted previously, researchers should make
decisions concerning confidence levels and confidence intervals based on
the requirements of individual research projects.
Variance
Simply put, variance is dispersion. When researchers calculate sample size,
it helps them to understand how the characteristic or variable they are
examining is dispersed throughout a population. If we want to understand
the use of public transportation in our community as a way to reduce traffic
and pollution, for example, it would be useful to know the percentage of
community members who actually use public transportation. In short, we
want to know how public transportation use is dispersed throughout our
community as a characteristic of the population.
For research purposes, it is useful to consider variance as a simple per-
centage. Community members who use public transportation, for example,
fit into one category that makes up a certain percentage of the population.
Community members who do not use public transportation do not belong
in this category and make up the remaining percentage of the popula-
tion. Together, the percentages add up to 100%. Researchers can examine
the dispersion of most variables this way because a population can be di-
vided into two categories on the basis of almost any characteristic. This

118 CHAPTER 6
includes, for example, students who smoke cigarettes and students who
do not smoke cigarettes, community residents who live in a certain neigh-
borhood and residents who live in other neighborhoods, workers who are
employed and workers who are unemployed, and people who drink coffee
and people who do not.
Any time researchers examine a variable or characteristic, they want to
know its dispersion within a population because they can use this infor-
mation to help them calculate sample size. Population members who have
a characteristic or variable fit into a single category, and researchers use
this to distinguish them from the rest of the population. In the formula we
examine shortly, the percentage of a population that belongs to a category
is expressed as a decimal. The remaining percentage of the population
(that does not belong to the category) also is expressed as a decimal and
subtracted from 1. Together, these two numbers add to 1.0 or 100% of the
population.
Despite the importance of variance, researchers often set aside variance
percentages when they calculate sample size because percentages only re-
flect the dispersion of a single characteristic or variable in a population.
Researchers commonly examine multiple variables in a single survey, each
with a different percentage of dispersion. Each variable would require a
different sample size, which is impractical and unnecessary. Researchers
address this problem by using the largest measure of variance available
to calculate sample size because, at a minimum, it provides an acceptable
measure of dispersion for all variables. To use the largest measure of vari-
ance, researchers use .5 (or 50%) as the percentage of a population that
belongs to a category. Researchers also use .5 as the percentage for the rest
of the population because 1 − .5 = .5 and these percentages add up to 1.0,
or 100%, of the population. Although it is not necessary for researchers to
use .5 and 1 − .5 in every sample-size calculation, this practice is regularly
required by the necessities of a multifaceted research project, and so we
use it in all of our sample-size calculations.
SAMPLE-SIZE FORMULA
Now that you understand standard deviation, confidence level, confidence
interval, and variance, you are ready to calculate sample size. Researchers
commonly use the following formula—or formulas that are similar but
more complicated—to calculate sample size:
n =
cl
ci
2
(v)(1 − v)
where

SAMPLING 119
n (number) = the number of completed interviews or what we call the
final sample size
cl (confidence level) = the standard deviation associated with a specific
area under a normal curve and corresponding to the desired confi-
dence level (by definition, 90% confidence level = 1.65; 95% confi-
dence level = 1.96; and 99% confidence level = 2.58)
ci (confidence interval) = the margin of error expressed as a decimal
(±3% error would be expressed as .03; ±5% error would be expressed
as .05; ±10% error would be expressed as .10)
v (variance) = the variance or distribution of a variable in a population,
expressed as a percentage in decimal form. For our purposes, variance
is always .5. Note also that 1 − v is the percentage of a population that
has no variable distribution; 1 − v always is .5 when v is .5, as we have
recommended.
Here is a basic sample-size calculation using this formula. We calculate
the sample size at a 95% confidence level and a ±5% margin of error, or
confidence interval:
n =
1.96
.05
2
(
.5
)(
.5
)
= 384
Based on this formula, we need a final sample size of 384 people—or 384
completed interviews—to produce findings with a ±5% margin of error at
a 95% confidence level.
What if we want less error (a smaller confidence interval), meaning more
trust in the precision of our survey results? It is easy to adjust the formula to
fit the demands of any research situation. In the following calculations, for
example, we determine sample sizes based on different confidence levels.
We calculate each sample size with a ±5% confidence interval, but with
different confidence levels to show how different confidence levels affect
sample size. To change confidence levels, we use standard deviations that
correspond to different areas under a normally distributed, bell-shaped
curve. Recall that the standard deviation for a 90% confidence level is 1.65;
the standard deviation for a 95% confidence level is 1.96, and the standard
deviation for a 99% confidence level is 2.58. Notice that we increase sample
size as we increase the confidence level. The only difference in each calcula-
tion is the level of confidence researchers have when they make inferences
from a sample to a population. Here is the final sample size—or number of
completed interviews—needed for a survey with a 90% confidence level
and a ±5% margin of error:
n =
1.65
.05
2
(
.5
)(
.5
)
= 272

120 CHAPTER 6
Here is the final sample size (number of completed interviews) for a survey
with a 95% confidence level and a ±5% margin of error:
n =
1.96
.05
2
(
.5
)(
.5
)
= 384
Finally, here is the sample size (number of completed interviews) for a
survey with a 99% confidence level with a ±5% margin of error:
n =
2.58
.05
2
(
.5
)(
.5
)
= 666
How do changes in the margin of error, or confidence interval, affect final
sample size (the completed number of interviews) researchers need? In the
following calculations, we determine sample sizes with the same level of
confidence but differing margins of error. Each sample size is calculated
at a 95% confidence level. Here is the final sample size for a survey with a
±10% margin of error at a 95% confidence level:
n =
1.96
.10
2
(
.5
)(
.5
)
= 96
Here is the final sample size for a survey with a ±5% margin of error at a
95% confidence level:
n =
1.96
.05
2
(
.5
)(
.5
)
= 384
Finally, here is the final sample size for a survey with a ±3% margin of
error at a 95% confidence level:
n =
1.96
.03
2
(
.5
)(
.5
)
= 1, 067
In each case, we reduced the margin of error while maintaining a consistent
level of confidence.
ERROR CALCULATIONS
The same information you learned to calculate sample size also will help
you calculate the margin of error for a survey, once you have collected
data. In most cases, the number of completed interviews—or what we
call the final sample size—is not 384 or 1,060 completed interviews, even if
this is researchers’ targeted sample size. Researchers aiming for a specific

SAMPLING 121
sample size typically collect additional interviews for various reasons. Re-
search staff may have to throw out some interviews, for example, because
of problems with data collection, such as a survey that is only partially
complete. At other times, researchers may collect a larger sample size so
they have a stronger basis from which to make sample subgroup compar-
isons. Regardless of the reason, researchers can use standard deviation,
confidence level, and variance to calculate the margin of error that exists
in a survey’s results based on its final sample size. Here is the formula:
e = cl
(v)(1 − v)
n
(100)
where
e (error) = the final margin of error for the completed survey based on
sample size
cl (confidence level) = the standard deviation associated with a specific
area under a normal curve and corresponding to the desired confi-
dence level (as before, 90% confidence level = 1.65; 95% confidence
level = 1.96; and 99% confidence level = 2.58)
v (variance) = the variance or distribution of a variable in a population,
expressed as a percentage in decimal form. As before, variance always
is .5, and 1 − v is the percentage of a population that has no variable
distribution; 1 − v always is .5, when v is .5 as we have recommended;
n (number) = the number of completed interviews or what we call the
final sample size.
Here is the margin of error for a survey in which the final sample size, or
number of completed interviews, is 485. The calculation is made based on
a 95% confidence level:
1.96
(.5)(.5)
485
(100) = 4.45
In this example, the margin of error for this survey is ±4.45% based on 485
completed interviews.
How do changes in the confidence level affect the margin of error, or
sampling interval, for survey results? In the following calculations, we
determine margins of error for survey results using the same final sample
size, or completed number of interviews, at different levels of confidence.
We calculate each margin of error using a final sample size of 575. Here is
the margin of error at a 90% confidence level:
1.65
(.5)(.5)
575
(100) = 3.44

122 CHAPTER 6
Here is the margin of error at a 95% confidence level:
1.96
(.5)(.5)
575
(100) = 4.09
Here is the margin of error at a 99% confidence level:
2.58
(.5)(.5)
575
(100) = 5.38
These calculations reveal the trade-off between confidence level and the
margin of error, or confidence interval, for a survey. If researchers want to
increase their level of confidence or certainty as they make inferences from
sample data to a population, they must be willing to accept a larger range
of error in their survey’s results. If researchers desire a smaller range of
error, they must be willing to accept a lower confidence level when they
make inferences.
ISSUES AND ASSUMPTIONS
The formulas we have presented require various assumptions and raise
some important issues. We have addressed many of these issues and as-
sumptions in the preceding sections, but note that you may need to alter
these formulas or disregard them completely, as the assumptions on which
we have based these formulas change. One of the primary assumptions of
all sample-size formulas, for example, concerns researchers’ use of proba-
bility sampling methods. When researchers use nonprobability sampling
methods, no sample-size formula will produce an accurate result because
it is impossible for researchers to determine the representativeness of the
sample.
One issue we have not addressed concerns the need to correct the for-
mula according to a population’s size. Researchers sometimes use sample-
size formulas that contain something called finite population correction. Fi-
nite population correction is an adjustment factor that is part of a sample-
size formula. Table 6.1 contains population-corrected final sample sizes
for probability-based survey results with a ±5% margin of error at a 95%
confidence level. The appropriate sample size for a population of 1 million
people is 384, the same sample size we calculated for a survey with a 95%
confidence level and a ±5% margin of error.
Is it necessary for researchers to correct for population size? Generally,
most researchers have little need for population correction unless the size
of the population is small and the sample is more than 5% of the total popu-
lation (Czaja & Blair, 1996). In most sample surveys, population correction
makes little difference in sample-size calculations and researchers simply

SAMPLING 123
TABLE 6.1
Population-Corrected Sample Sizes
Population Population Population
Size (N) Sample Size (n) Size (N) Sample Size (n) Size (N) Sample Size (n)
5 5 650 242 2,500 333
10 10 700 248 3,000 341
15 15 750 254 3,500 346
20 19 800 260 4,000 351
25 24 850 265 4,500 354
50 44 900 269 5,000 357
75 63 950 274 6,000 361
100 80 1,000 278 7,000 364
150 108 1,100 285 8,000 367
200 132 1,200 291 9,000 368
250 152 1,300 297 10,000 370
300 169 1,400 302 15,000 375
350 183 1,500 306 20,000 377
400 196 1,600 310 25,000 378
450 207 1,700 313 50,000 381
500 217 1,800 317 75,000 382
550 226 1,900 320 100,000 383
600 234 2,000 322 275,000+ 384
Note: Figures reported are for probability-based survey results with a ±5% margin of error at a 95%
confidence level. Calculations are based on Cochran’s (1977) formula for finite population correction. Further
information is available in Kish (1965). According to this formula, even populations more than 1 million
require a sample size of 384.
exclude a population correction factor because it is unnecessary. In fact,
researchers would generally use the same sample size for a survey of regis-
tered voters in Chicago, a survey of registered voters in Illinois, or a survey
of all registered voters in the entire United States! Although there are im-
portant exceptions, once a population reaches a certain size, sample sizes
generally remain consistent. For this reason, and to keep our sample cal-
culations simple, the sample size formula we presented does not include
population correction.
FINAL THOUGHTS
Sampling is a powerful tool that helps practitioners obtain accurate infor-
mation at a reasonable cost. Researchers’ selection of a proper sampling
method is as important as their selection of a proper research method to the
success of a study. Even the most carefully planned and executed study will
produce untrustworthy results if research managers use an improper sam-
pling method. Although sampling can be complex, it is in readers’ own best
interest to learn all they can about the sample-selection procedures used