Austin E W., Pinkleton B.E. Strategic Public Relations Management. Planning and Managing Effective Communication Programs
Подождите немного. Документ загружается.


104 CHAPTER 6
representative and no scientific evidence to suggest quota sampling is more
representative than other nonprobability sampling methods. Researchers
correct the nonprobability selection weakness of quota sampling and di-
mensional sampling when they use stratified sampling, which we address
shortly.
Purposive Sampling
In purposive, or judgmental, sampling, researchers select sample members
because they meet the special needs of the study based on the interviewer’s
judgment. A researcher’s goal when using purposive sampling typically is
to examine a specially selected population that is unusually diverse or par-
ticularly limited in some way, rather than to study a larger, more uniform
population (Johnson & Reynolds, 2005). If a product manufacturer wants
to open a new plant in another country, for example, company manage-
ment needs to learn the concerns of local business, government, and labor
leaders. In this case, the sample is relatively small and diverse, and inter-
viewers may simply select sample members using their own discretion to
determine which respondents fit into the sample and are “typical” or “rep-
resentative.” This creates situations in which sample-selection decisions
may vary widely among interviewers. Even if the definition of the popu-
lation is reasonably clear, the procedures researchers use when drawing a
sample may vary greatly among interviewers, limiting the comparability of
sample members (Warwick & Lininger, 1975). These nonrandom selection
procedures limit the generalizability of research results based on purposive
samples, as is the case with all nonprobability sampling methods.
Volunteer Sampling
When media organizations ask viewers to call in or e-mail their opinions,
they are using a volunteer, or self-selected, sample. Instant phone-in polls
have become a common way for the media to determine and report so-
called public opinion, for example, in an attempt to attract and keep the
interests of viewers and listeners. There are numerous potential sources
of bias when research is based on a volunteer sample. First, sample rep-
resentation is hindered because only the people who are exposed to the
survey have an opportunity to participate. All other potential respondents
are unaware of the poll. Second, those who feel strongly about the topic
of a poll may view the survey as an opportunity to vote for their view-
point. Such individuals may respond more than once and/or encourage
other like-minded individuals to respond in the same way. The result is
that volunteer samples are not representative, and research results based
on volunteer samples are highly untrustworthy. Organizations that use

SAMPLING 105
volunteer samples should use them strictly for their entertainment value,
not their scientific value.
Snowball Sampling
When researchers use snowball sampling, they collect data from a limited
number of population members and then ask these individuals to identify
other members of the population who might be willing to participate in
the study. The sample continues to grow as new research participants di-
rect interviewers to additional sample prospects. The sample snowballs,
starting from a small number of people and growing larger as each new
participant suggests other potential participants.
Researchers may have no choice but to have to rely on snowball sam-
pling when they can locate only a few members of a population. If a social
welfare organization wanted to learn about the particular difficulties of mi-
grant workers, for example, it might start by interviewing those migrant
workers it could locate. After each interview was concluded, interviewers
could ask participants to identify other workers who might be willing to
participate in the study. Interviewers hope the sample would grow to a de-
sirable size through this process. Research results based on such a sample,
however, have little or no generalizability, no matter how large the sample
grows. A snowball sample relies on nonrandom methods of selection, and
there is no way to scientifically determine the degree to which it repre-
sents the population from which it is drawn because of this. As with all
projects based on nonprobability samples, managers need to interpret and
generalize research findings resulting from snowball samples carefully.
PROBABILITY SAMPLING METHODS
Researchers generate probability samples using a random selection process
so that each member of a population has an equal chance, or probability,
of being included in a sample. The use of probability sampling normally
allows investigators to make accurate inferences about a population based
on information collected from a sample. Investigators’ inferences, or con-
clusions, about the population are not perfectly accurate even when they
use probability sampling. Researchers calculate estimates of the popula-
tion parameter within a given range of possible values at a specific level
of probability. The result of this process is that research findings based
on probability samples normally are highly representative. That is, they
possess a high degree of generalizability, or external validity. The most
common type of probability sample is simple random sampling. Common
variations of simple random sampling include systematic sampling, strat-
ified sampling, and cluster sampling.

106 CHAPTER 6
Simple Random Sampling
Researchers must ensure that each member of a population has an equal
chance of being included in a sample and select each sample element in-
dependently to produce a random sample. Simple random sampling is the
most basic method of random sampling, and investigators use it to ensure
that the sample they produce is representative of the population. Although
true representation never is guaranteed unless a census is taken, the use of
a random-selection process significantly reduces the chances of subgroup
overrepresentation or underrepresentation, which helps eliminate sample
bias. Researchers then can estimate, or infer, population parameters based
on sample statistics. Although these inferences are not perfect—they have
some error—investigators use statistical procedures to understand this
error as noted previously.
From a practical standpoint, the primary requirement for simple ran-
dom sampling is that researchers clearly and unambiguously identify each
member of a population through the use of a comprehensive sampling
frame. This allows the direct, independent, and random selection of sam-
ple elements, typically through a list in which each element is identified
(Warwick & Lininger, 1975). The most common methods of simple random
sampling use a list of population members for a sample frame. Research
staff members might number each element on the list sequentially, for
example, and select the sample by using a table of random numbers or a
computer program that produced random numbers. Each number selected
by researchers would correspond with a member of the sampling frame.
The result is a random sample that normally is highly representative of its
population.
If the Public Relations Society of America (PRSA) wanted to survey its
members to determine their level of satisfaction with its programs and ser-
vices, a project manager could take a membership list and assign a number
to each PRSA member sequentially. The manager would create the sam-
ple by randomly generating numbers assigned to specific PRSA members.
Staff members would produce more numbers until they generated an ap-
propriate sample size. If properly conducted, this random process would
producea probability sample of PRSA members who have a high likelihood
of accurately representing the attitudes and opinions of all the members of
PRSA.
Systematic Random Sampling
Researchers use an unbiased system to select sample members from a list
when they use systematic random sampling. This system allows them to
generate a probability-based sample that normally is highly representative
of the population from which it was drawn, without some of the inconve-
niences associated with simple random sampling. Those who use simple

SAMPLING 107
random sampling often find the process long and unnecessarily tedious,
especially when a population is large. When researchers use systematic
random sampling, they develop an uncomplicated system using the total
sample size and the size of the population to help them draw a probability-
based sample relatively easily.
First, research team members determine the final number of completed
interviews they need for a study. Researchers often need to generate a total
sample that is several times larger than their targeted number of completed
interviews because of the number of sample elements who are difficult to
contact or who refuse to participate in a survey. Once researchers determine
the total sample size, they determine a sampling interval by dividing the
number of elements in the sampling frame (this is the total population) by
the desired total sample size. The result is a number (n) that researchers use
to generate a sample by selecting every n
th
element from a sampling frame.
Researchers must select the first sample element randomly from the frame
to produce a probability sample, so they randomly select the first element
from within the sampling interval. They complete the sample-selection
process by selecting every n
th
element from the sampling frame and the
result is a systematic random sample.
An example helps to clarify systematic random sampling. If corporate
personnel managers want to survey their classified staff as part of a pro-
gram to improve employee relations, their first step is to determine the final
number of completed interviews they want for the study. We discuss sam-
ple size calculations later in this chapter, but for this example, let’s say that
after some careful thinking and a little fun with math, administrators de-
termine they want a total of approximately 400 completed interviews from
the approximately 6,000 employees who work as full- or part-time classi-
fied staff. After some additional calculations (explained in chapter 12), re-
searchers determine that an original total sample size of 850 classified staff
members would produce about 400 completed surveys from participants,
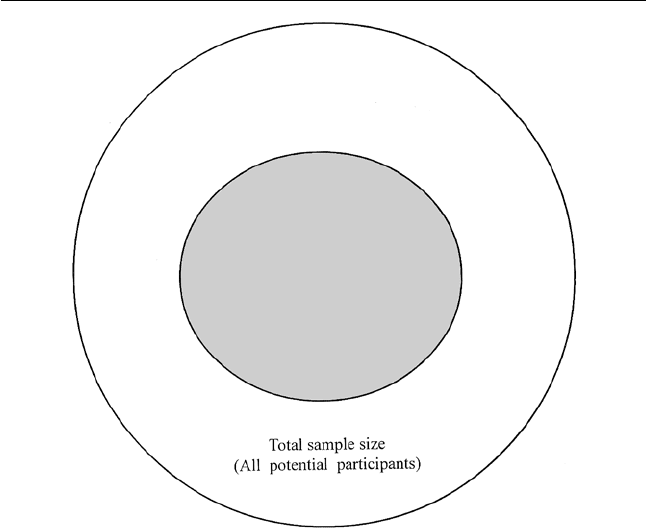
as shown in Figure 6.1. The projects’ directors decide to use a mailing list of
classified staff members as a sampling frame because it contains the names
and addresses of all classified staff members and has no duplicate listings.
They divide the sampling frame (6,000) by the original sample size (850) to
determine the sampling interval (approximately 7). Project managers must
select the first sample element randomly, so they use a table of random
numbers to produce the first number between 1 and 7. If project managers
drew the number 5, they would draw the sample by selecting the fifth name
on the list and selecting every seventh name after that. Thus, researchers
would draw name 5, name 12, name 19, name 26, and so on. By using the
sampling interval, researchers produce a systematic random sample.
Systematic random samples and simple random samples are not ex-
actly the same; however, systematic samples closely approximate simple
random samples to produce a probability sample that normally is highly
representative. In terms of bias, the greatest danger researchers face when
108 CHAPTER 6
Final sample size
(Actual participants)
FIG. 6.1. The relationship of final sample size to total sample size. Communication managers need
to generate a total original sample that is several times larger than required for their final sample
because of the number of people who cannot be contacted or refuse to participate in a survey.
they use systematic sampling is periodicity. Periodicity refers to bias that oc-
curs when a sampling list has a cyclical repetition of some population char-
acteristic that coincides with a sampling interval. If this occurs, the sample
elements selected are not generalizable to the population from which they
were drawn. Researchers should be careful to inspect population lists be-
fore sampling to make sure there are no obvious signs of periodicity. When
researchers are careful, the potential for bias in systematic sampling nor-
mally is small. Ultimately, researchers use systematic random sampling
more than simple random sampling because of its simplicity and useful-
ness in complex sampling situations (Sudman, 1976).
Stratified Sampling
Researchers divide a population into different subgroups, or strata, when
they engage in stratified sampling, similar to quota sampling. The key
difference between the methods is that investigators use a random,
probability-based method to select sample elements when they engage in
stratified sampling, whereas they use a nonrandom, nonprobability-based

SAMPLING 109
method to select sample elements when they engage in quota sampling.
Researchers have two primary reasons for stratification: to control the rep-
resentativeness of the sample and to use different probability-based selec-
tion procedures in different strata (Warwick & Lininger, 1975). Researchers
also may use stratified sampling when they are primarily interested in the
key similarities and differences among members of strata, when the prior
information they have for individual strata is different, or when they want
to improve sampling efficiency when research costs differ by strata (Sud-
man, 1976).
Researchers use two types of stratified sampling: proportional and dis-
proportional. When they use proportional sampling, project managers draw
sample members from each stratum in proportion to their existence in
the population. The resulting sample proportionally represents individ-
ual strata as they exist in a population. Researchers use disproportionate
sampling to help ensure that the overall sample accurately produces re-
sults that represent the opinions, attitudes, and behaviors of a significant
stratum within the population. Project managers may use disproportionate
sampling when strata are too small to be accurately represented in a sample
selected through other means. In this case, research staff may find it neces-
sary to weight the data to obtain unbiased estimates of the total population.
This may be necessary, for example, when researchers’ use of other prob-
ability sampling methods would underrepresent the opinions, attitudes,
and behaviors of minority members of a population. When researchers use
either proportional or disproportional stratified sampling to their advan-
tage, they can produce highly representative, probability-based samples.
Cluster Sampling
Researchers select sample elements using groups rather than individuals
when they use cluster sampling. The sample frame consists of clusters
rather than individuals, and each cluster serves as a sample element. The
clusters researchers use for sampling commonly are preexisting natural
groups or administrative groups of the population. These may include
geographical designations such as neighborhoods, cities, counties, or zip
code areas, for example, or other common groupings such as universities,
hospitals, or schools.
Researchers often use cluster sampling to make data collection more
efficient (Sudman, 1976). If a metropolitan school district wanted to learn
about the attitudes and experiences of its students, it could send interview-
ers to meet one on one with individually selected student sample members.
This process, however, would be expensive and increase the time needed
to complete the project. If researchers used schools as sample clusters and
randomly selected from among them, the project would require less time
and travel, which would increase the efficiency of data collection.

110 CHAPTER 6
Investigators also use cluster sampling when a comprehensive list of
sample elements is not available. If an organization wanted to sample
city residents as part of a community relations program, project managers
would likely have trouble locating a complete list of all community resi-
dents, and the process would be costly and time consuming. If researchers
wanted to use cluster sampling, they could create a sampling frame by us-
ing city blocks as clusters. After research staff identified and labeled each
block, they could randomly select an appropriate number of blocks. Next,
researchers would randomly sample dwelling units within each block. Fi-
nally, interviewers would randomly sample people living in each dwelling
unit and collect data. Researchers call this sampling process multistage sam-
pling because sampling takes place in different stages; they select city blocks
in stage one, followed by dwelling units in stage two and individual people
in stage three.
Researchers’ primary concern when using cluster sampling is the poten-
tial for increased error relative to other probability-based sampling meth-
ods. When investigators use cluster sampling, standard error may increase
if sample members’ attitudes, behaviors, and other characteristics gener-
ally are the same, or homogeneous, within each cluster. In this instance,
samples selected from within homogeneous clusters will not reflect the di-
versity of attitudes and behaviors that exist in the larger population. Project
managers can help counter this problem by selecting a high number of
small clusters and selecting a relatively low number of sample elements
from within each cluster (Johnson & Reynolds, 2005).
Cluster samples, along with systematic and stratified samples, are ac-
ceptable alternatives to simple random sampling. In each case, population
elements have an equal chance of being included in a sample. Ultimately,
researchers’ choice of a sampling method often depends on the time and
money available for a project, the population being sampled, the subject
under investigation, and the availability of a comprehensive list of target
population members.
HOW BIG SHOULD A SAMPLE BE?
One of the first questions clients, managers, and others involved in a re-
search project typically ask is “What is the best sample size for a project?”
Unfortunately, as is the case so often in life and particularly in survey re-
search, the answer is a firm “it depends.” In fact, the methods researchers
use to determine the appropriate sample size for a study can be relatively
complicated and even controversial. Research professionals often use dif-
ferent formulas to calculate sample size—in some cases based on different
assumptions about population characteristics—and may suggest conflict-
ing sample sizes as a result. Several common misperceptions exist concern-
ing sample size calculations including the following:

SAMPLING 111
Myth 1: Bigger samples are better. The Literary Digest case demonstrates
the fallacy concerning bigger sample sizes. When researchers use
probability sampling methods, a mathematically calculated sample
size based on an appropriate formula nearly always produces trust-
worthy results with known ranges of error. Researchers can use
simple math to verify this information. When researchers use non-
probability sampling methods, there is no scientific way to deter-
mine how well a sample represents a population or how much er-
ror survey results contain. Remember, a large unrepresentative sam-
ple is no more representative than a small unrepresentative sample.
In addition, a representative sample that is unnecessarily large is
a waste of resources. A sample’s size should be the result of a re-
searcher’s purposeful decision-making process, not a number that
researchers stumble upon as they try to generate the largest sample
possible.
Myth 2: As a rule of thumb, researchers should sample a fixed percentage of
a population to produce an acceptable sample size. It is not uncommon
for those uninitiated in survey research methods to suggest using
a fixed percentage of the population to determine sample size. If
researchers sampled 10% of a 50,000-person population, for exam-
ple, they would generate a sample of 5,000 participants. Once again,
probability-based sampling methods allow the use of mathemati-
cal formulas to calculate sample sizes that normally produce highly
trustworthy results with known ranges of error. Arbitrarily sampling
a certain percentage of the population is unnecessary and results in
an arbitrary sample size. Such a practice is as illogical as if you ate a
certain percentage of the food in your refrigerator because you were
hungry. Just as the amount of food you eat should be based on your
body’s needs (with notable exceptions for mocha almond fudge ice
cream and chocolate in any form), so should a study’s sample size
be based on the requirements of a research project instead of on an
arbitrary percentage of a population.
Myth 3: Researchers should base sample sizes on industry standards or
“typical” sample sizes used in other research projects. In reality, there
is little that is standard about a research project. Although re-
searchers may use familiar formulas to determine the sample size
for a study, they should not use these formulas without careful con-
sideration. A project’s unique needs, the individual characteristics
of a population and its resulting sample, and other issues greatly
affect sampling decisions. Researchers serve the needs of clients
and organizations best when they make thoughtful sample-size de-
cisions, based on the unique requirements of individual research
projects.

112 CHAPTER 6
Having said all of this, we must engage in a small amount of backpedal-
ing. Many communication students (and some campaign practitioners for
that matter) have varying degrees of math phobia and short attention spans
when it comes to highly technical or theoretical information. It is neces-
sary to understand a little theory and use a small amount of basic algebra
to calculate sample sizes. With this in mind, in this text we use simple
sample-size calculation formulas and avoid math when possible. We also
try to provide a basic conceptual understanding of these formulas and the
concepts they use. In short, we take some shortcuts to make these topics as
accessible as possible. The result is that we do not follow our own advice
in some instances. Please keep in mind that there is more to this some-
times complicated topic than we discuss in this text. If you find these basic
concepts and formulas easy to understand, or if you will be involved in
research on a regular basis, you should read more about additional aspects
of sampling and sample-size calculations so that you are fully informed.
For the math-challenged among us, we offer our encouragement. Read
the next section slowly, draw pictures of the concepts if it helps you un-
derstand them, and try the math out yourself. Put in a little effort and you
should emerge with a clear understanding of the topic. To explain sample-
size calculations, first we provide a conceptual understanding of sample-
calculation concepts and processes. Then, we do some basic sample-size
calculations, based on the concepts we have explained. Finally, we calcu-
late the amount of error that exists in survey data once researchers have
completed a survey.
CALCULATING THE APPROPRIATE SAMPLE SIZE
Anyone can determine with precision the optimal size for a sample, pro-
vided they understand a few key concepts based on probability theory and
a bell-shaped curve. These concepts include sample distribution and stan-
dard deviation, confidence level, confidence interval, and variance. Once
you grasp these concepts, it is easy to understand the basis for sample-size
calculations; the rest is simply a matter of applying the formulas.
Sample Distribution and Standard Deviation
Sample distribution and standard deviation are the first and, in some ways,
most complex concepts to understand. A sample distribution is a grouping
or arrangement of a characteristic that researchers measure for each sample
member, and it reflects the frequency with which researchers assign sam-
ple characteristics to each point on a measurement scale (Williams, 1992).
Almost any characteristic that researchers can measure has a sampling
distribution, but in survey research investigators typically study sample
members’ opinions, attitudes, behaviors, and related characteristics. If we
SAMPLING 113
were to chart a sampling distribution, the result would be shaped like a
bell, provided the sampling distribution was normal. It would be tall in the
middle where the average of the sampling distribution is located because
most people would be near the average. There would be fewer people to-
ward either edge, or tails, of the bell because fewer people would have
characteristics or behaviors so far above or below the average.
If we were practitioners at a university health facility, for example, we
might conduct a survey to better understand smoking behavior among stu-
dents. We could ask a randomly selected student sample to fill out a ques-
tionnaire that contained attitudinal and behavioral questions, including a
question about the number of cigarettes participants had smoked in the
previous 7 days. Participants’ responses likely would vary greatly. Many
students would have smoked no cigarettes in the previous 7 days, whereas
other students would have smoked a high number of cigarettes. When we
compute students’ responses to our smoking question, we could use the
information to generate a sample distribution. If our research revealed the
average number of cigarettes smoked in the past week by participants was
3.5, this number would be placed under the middle of the curve at its tallest
point and most participants would be near the average, or mean, in the
large part of the bell-shaped distribution. Our sample’s smoking distribu-
tion would get smaller at its tails because fewer participants would smoke
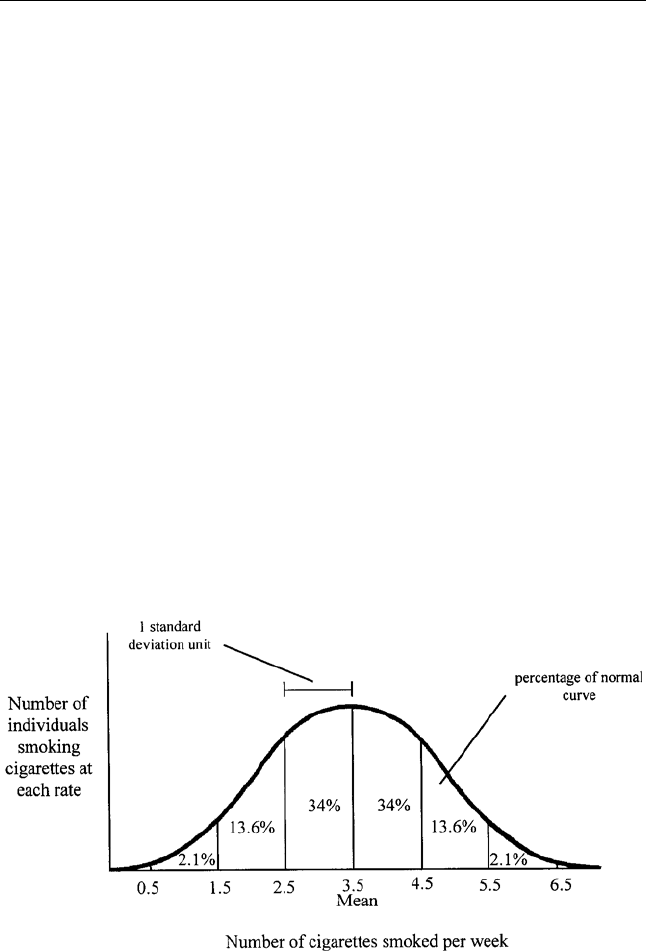
in numbers that were far above or below average. Figure 6.2 contains a
normally distributed, bell-shaped curve for the smoking example.
FIG. 6.2. Smoking distribution example. The number in each portion of the curve shows the
percentage of the sample that corresponds to each segment. For example, 34% of this sample
smokes between 2.5 and 3.5 cigarettes per week. The percentages added together equal
more than 99% of a normal distribution. The segments of the curve are divided according
to standard deviations from the mean.