Amaro A., Reed D., Soares P. (editors) Modelling Forest Systems
Подождите немного. Документ загружается.


22Amaro Forests - Chap 19 1/8/03 11:53 am Page 216
216 A. Amaro
Not only may the cross-equation correlations differ from zero, as dominant
height and basal area growth are correlated, but the endogenous variables are also
exogenous variables (DH
2
is DH
1
in another moment and BA
2
is BA
1
). Thus the sys-
tem is not recursive and some additional problems arise: the RHS variables are sto-
chastic and no preliminary information is available about the homoscedasticity of
the error components and expected zero values.
Several authors have discussed similar problems (e.g. Murphy, 1983; Borders,
1989; Huang and T
itus, 1999). The non-linearity will be responsible for the asymp-
totic behaviour of the estimators that may be consistent (but implying large data
samples). To be consistent, several restrictions must be observed, namely the errors
must be identically and independently distributed with zero mean and constant
variance and the model specification must be correct.
SOP-specific non-linearity will not allow an analytical solution to the estimators
that will be computed through a numerical method using, as convergence criteria,
the least squares loss function minimization. The Levenberg–Marquardt (Bates and
Watts, 1988) convergence algorithm was selected for its recognized efficiency: based
on the Gauss–Newton algorithm, it does overcome the estimation impossibility in
cases where the Hessian matrix is singular. On the other hand, this algorithm is very
sensitive to local minima, explaining why the initial estimates were derived with
one of these alternative algorithms: Quasi-Newton, Simplex or Rosenbrock (StatSoft,
2001). The convergence was determined by the difference between sequential para-
meter estimates to be less than 10
6
.
Due to the complexity of the econometric model (especially in respect of the
r
egionalization definition objective) and the need to ‘build knowledge’ about the
system’s behaviour, several sequential methods were used with the support of two
commercial applications:
STATISTICA (StatSoft, 2001) and SPSS (SPSS, 1996):
• Non-linear ordinary least squares (NOLS) for
ALDO initial parameterization con-
sidering the following structure for parameters A
dh
and k:
n
A
1
A
dh
= +
∑
A RA
i
(5)
i
i =2
where A
1
refers to A
dh
for region ‘Poor’ (Table 19.1) and A
i
the difference from
the corresponding parameter for
ALDO region RA
i
(binary variable); n represents
the number of regions and
n
kk
1
=+
∑
k RA
i
(6)
i
i =2
with the same correspondences to parameter k.
• Non-linear two-stage least squares (N2SLS) for submodel
ALBA in which DH
10
is
estimated through
ALDO submodel (Equation 2), and A
baI
, A
baII
, n
0
and n
1
with
the same structure considered in Equation 6 for parameter k:
A
m
baX
=A
baX1
+
∑
A
baXi
RB
i
(7)
i =2
m
n
X
=A
X1
+
∑
n
Xi
RB
i
(8)
i=2
X refers to the A
ba
parameter (I or II) and the n parameter (0 or 1), RB
i
is a
binary variable and m is the number of regions.
• Seven initial parameterization regions will be considered, based on productiv-
ity r
egions classification (Table 19.1) establishing 7-term Equations (Equations
2–4). Whenever inconsistencies were detected, through parameter estimate

22Amaro Forests - Chap 19 1/8/03 11:53 am Page 217
The SOP Model 217
values or non-convergent solutions, a re-classification based on splits through
IMUs or merges of different initial regions was performed. The final classifica-
tion was based on a step-by-step analysis using the statistical and biological
meanings of the parameter estimates criteria.
• After the number of regions was considered stable, and due to the non-recur-
sive natur
e of the system and the correlation between errors of the different
equations involved, to eliminate the simultaneous equation bias, non-linear
three-stage least squares (N3SLS) was applied.
• To evaluate the ψ + 1 parameter model significance compar
ed with a ψ parame-
ter model, the likelihood ratio test was performed.
• Some usual evaluation indicators are used to assess the model estimation qual-
ity
, comparing the two N2SLS and N3SLS methods (namely mean residuals and
residual mean sum of squares). F-Snedecor homogeneity variance tests were
also performed in order to assess the validity of the error variance homogeneity
but in particular graphical analyses were done in order to detect serious viola-
tions of the assumptions.
Results and Discussion
The preliminary NOLS estimates for the ALDO and ALBA submodels are considered in
Table 19.2 (computed individually for each region). For the
ALBA submodel, the
endogenous variable DH
10
was substituted by the value suggested by the inventory
data. Due to the non-significance of some estimates (possibly due to small samples or
high intrinsic variation) and the lack of meaning of some significant estimates for the
asymptote parameters, a step-by-step reorganization was done (using every piece of
information and especially considering the IMU climatic characteristics), crossing
over IMU by PR units, generating the
SOP regions as considered in Table 19.3.
This was done with a simultaneous estimation performed using Equations 2–8
and the NOLS method. The dominant height gr
owth pattern is simultaneously cor-
related with both parameters on the equation, which generates an objective classifi-
cation of the new regions using a productivity criterion. The same is true for basal
Table 19.2. Initial estimates for the ALDO submodel within the seven IMUs and seven PRs (italic figures
are non-significant at the 0.05 level).
IMU 1 2 3 4 5 6 7
A
dh
73.8629 42.5668 59.9684 36.4943 36.5916 35.6854 27.9614
k 0.025023 0.072635 0.010764 0.060505 0.055140 0.080311 0.091759
A
baI
56.40669 16.83116 214.5511 14.74440 24.54613 19.16068 23.59806
A
baII
0.46084 1.00848 6.5269 0.83015
0.06501 0.65952
0.19106
n
0
0.51684 0.30733 0.2758 0.65820 1.00851 0.76304 0.56774
n
1
0.00032 0.00075 0.0003 0.00028 0.00018 0.00020 0.00072
PR Poor Marginal Low Medium Good Very good Excellent
A
dh
27.0519 35.0363 40.9820 42.4488 38.4873 32.8762 60.2579
k 0.075046 0.062980 0.061284 0.049435 0.082352 0.086783 0.037605
A
baI
61.66494 19.60075 20.47559 42.26702 23.06307 5.571351 637.1737
A
baII
1.88888 0.18185 0.51062
0.14242 0.34265 1.074174 17.1955
n
0
0.64334 1.04146 0.62242 0.68841 0.37064 0.532283 0.5212
n
1
0.00038 0.00014 0.00035 0.00015 0.00081 0.000577
0.0000

22Amaro Forests - Chap 19 1/8/03 11:53 am Page 218
218 A. Amaro
Table 19.3. NOLS estimates for ALDO and ALBA (PR, productivity region and IMU, information
management unit).
Regional
characterizations SOP
(PR and IMU based) region A
dh
k A
baI
A
baII
n
0
n
1
PR = Poor OR Poor 29.51789 0.06241 72.7638 2.2746 0.6330 0.0003
PR = Medium AND
IMU ≠ 6
Marginal A 35.18502 0.06241 19.9833 0.1512 0.9910 0.0002
PR = Medium AND B 35.18502 0.08157 19.9833 0.5743 0.8072 0.0002
IMU = 6
PR = Good AND C 29.51789 0.12376 19.9833 0.1512 0.6330 0.0007
IMU = 3
Low D 40.62639 0.06241 19.9833 0.5743 0.6330 0.0003
(PR = Very good OR E 29.51789 0.10485 19.9833 0.5743 0.6330 0.0003
PR = Excellent) AND
(IMU ≠ 1 AND IMU ≠ 2)
(PR = Good AND Good 45.08593 0.06241 41.3486 0.1512 0.6330 0.0003
IMU ≠ 3) OR ((PR = Very
good OR
PR = Excellent) AND
(IMU = 1 OR IMU = 2))
area. This is why a nominal classification was adopted. Exceptions were made for
two regions that were, due to the base characteristics of the regions (supported by
the IMU climatic classification) and to the asymptote estimates, readily classified as
being Poor and Good productive quality (Table 19.3).
Using the NOLS estimates as initial values on the iterative estimation process,
the N2SLS values wer
e estimated (Table 19.4). The sample correlation between the
residuals of the two equations, 0.41, is significant. In order to overcome the simulta-
neous bias that may occur due to the correlation, N3SLS was run (Table 19.4).
The asymptotic standard error estimates of both N2SLS and N3SLS parameter
estimates ar
e similar. The error variance estimate for the N2SLS model is 1.34977,
being 1.34964 for the N3SLS model (not significantly different at P < 0.05). All the
estimates were considered significant at the 0.05 level and the mean residual was
not significantly different from zero in both cases. A graphical analysis was run is
order to detect patterns on the mean residual sum of squares, crossing this informa-
tion with the endogenous variable range, the dummy variables and age of stands.
Although not statistically tested, no relevant patterns were observed.
In order to better interpret the parameter estimates, meanings and relationships
between the stand classifications in the r
espective
SOP regions, the average values for
age stands, estimate of dominant height at 10 years of age and number of plants per
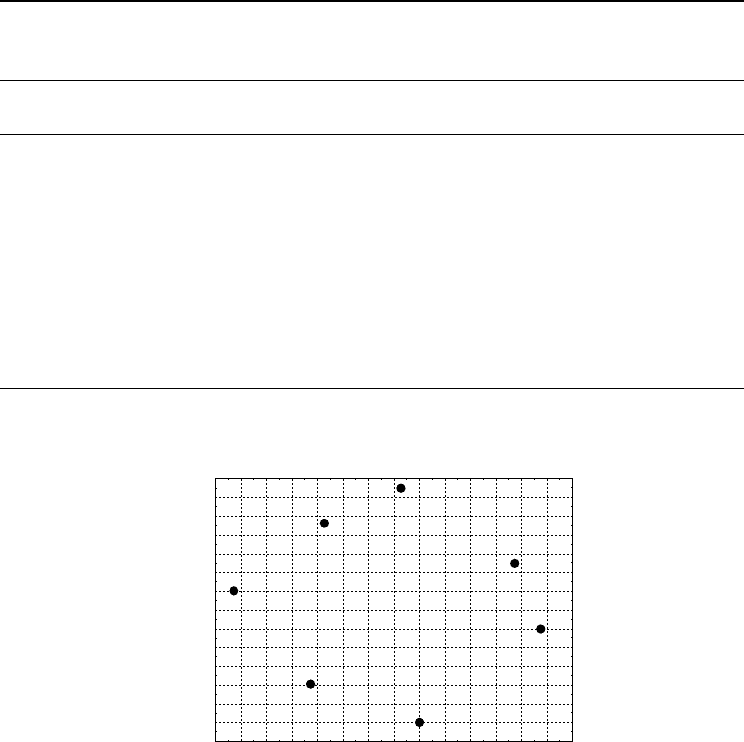
hectare were computed (Table 19.5) and a spatial distribution of
SOP regions for the
bi-dimensional IMU classification criteria is considered (Fig. 19.1).
Dominant height analysis
The Poor region stands are located in reduced water availability and medium to
very high fr
ost-risk regions. The dominant height asymptote (29.73424 m) is the

22Amaro Forests - Chap 19 4/8/03 2:31 pm Page 219
The SOP Model 219
Table 19.4. N2SLS and N3SLS estimates for ALDO and ALBA (PR, productivity region and IMU,
information management unit).
Regional
characterizations SOP
(PR and IMU based) region A
dh
k A
baI
A
baII
n
0
n
1
PR = Poor OR Poor 29.51796 0.06241 79.7839 -3.2124 0.6395 0.0003
PR = Medium AND (29.73424) (0.06325) (80.3384) (-3.2262) (0.6392) (0.0003)
IMU ≠ 6
Marginal A 35.18511 0.06241 15.8431 0.3476 1.0256 0.0002
(34.94904) (0.06325) (18.8100) (0.3490) (1.0257) (0.0002)
PR = Medium AND B 35.18511 0.08157 15.8431 0.7921 0.8053 0.0002
IMU ≠ 6 (34.94904) (0.08316) (18.8100) (0.7932) (0.8049) (0.0002)
PR = Good AND C 29.51796 0.12376 15.8431 0.3476 0.6395 0.0007
IMU ≠ 3 (29.73424) (0.12178) (18.8100) (0.3490) (0.6392) (0.0007)
Low D 40.62649 0.06241 15.8431 0.7921 0.6395 0.0003
(40.40774) (0.06325) (18.8100) (0.7932) (0.6392) (0.0003)
(PR = Very good OR E 29.51796 0.10485 15.8431 0.7921 0.6395 0.0003
PR = Excellent) AND (29.73424) (0.10319) (18.8100) (0.7932) (0.6392) (0.0003)
(IMU ≠ 1 AND IMU ≠ 2)
(PR = Good AND IMU ≠ 3) Good 45.08606 0.06241 36.1187 0.3476 0.6395 0.0003
OR ((PR = Very good OR (44.77771) (0.06325) (36.0894) (0.3490) (0.6392) (0.0003)
PR = Excellent) AND
(IMU = 1 OR IMU = 2))
N2SLS estimates (N3SLS estimates).
lowest observed (Table 19.4), also assigned to regions C (regions with medium water
availability but high frost risk) and E (very low frost risk and medium–high water
availability). The differentiation of the three regions is achieved by the k growth rate
parameter that assumes a higher value for regions C and E. Within the dominant
height scenario, and due to the climatic characteristics of both regions, the k parame-
ter is expected to be generally higher for region E: the main difference between C
and E is the frost risk, which is almost non-existent for region E. It is also true that
the stands in region C are generally younger than those in region E, and this may
bias the k estimate.
Due to the observed estimates for regions C and E, it seems that frost risk does
not r
estrict growth at the dominant height level. The highest k estimates are
assigned to these two regions, showing that, although with low final potential
(probably due to water availability level), the rate at which this potential is achieved
is high.
When comparing regions D and Good, both with high dominant height asymp-
totes (although D is lower) and the same k values, the most r
elevant climatic differ-
ence between the two regions is water availability and not frost risk.
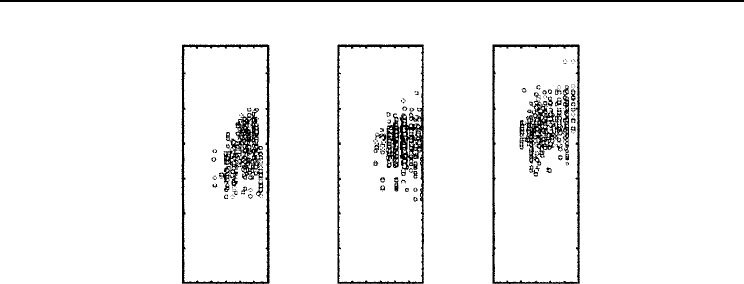
Although region D has higher potential (A = 40.40774 m) than r
egions C and E
(29.73424 m), the growth rate is very low (0.06241) when compared with both
growth rates for the other regions (k
C
= 0.12178 and k
E
= 0.10319). This may even
mean that the variation assigned to growth in region D is so high that mathemati-
cally ‘the best way to solve this problem’ was to push the asymptote up and allow a
very soft growth rate (in realistic time periods, e.g. 15 years, the potential is far from
being attained!) (see Fig. 19.2).
The productivity classification is, then, dependent on both values of the asymp-
tote and gr
owth rate, although the dominant height asymptote seems to be corre-
lated with water availability.
22Amaro Forests - Chap 19 1/8/03 11:53 am Page 220
220 A. Amaro
Table 19.5. Estimates for mean stand age (years), mean dominant height at 10 years (SOP estimate m)
and mean number of trees (per ha).
Regional characterizations SOP (Water availability; t
1
Npl
(PR and IMU based) region frost risk) (year) dh
10
(m) (per ha)
PR = Poor OR PR = Medium AND Poor (- ; +++) (--- ; +) 5.3 29 950
IMU ≠ 6
Marginal A (- ; +++) 6.8 25 1050
PR = Medium AND IMU = 6 B (--- ; ---) 7.6 35 1200
PR = Good AND IMU = 3 C (+ ; ++) 4.4 26 950
Low D (- ; +++) 7.1 34 1100
(PR = Very good OR PR = Excellent) E (0 ; ---) 7.1 36 1200
AND (IMU ≠ 1 AND IMU ≠ 2)
(PR = Good AND IMU ≠ 3) OR Good (++ ; ---) (+++; 0) 5.3 44 1200
((PR = Very good OR PR = Excellent)
AND
(IMU = 1 OR IMU = 2))
Note: qualitative classification of water availability (water) and frost risk (frost): very high (+++), average
(0), to very low (---).
Water availability
1.4
1.2
1.0
0.8
0.6
0.4
0.2
0.0
–0.2
–0.4
–0.6
–0.8
–1.0
–1.2
–1.4
Poor
B
A
C
D
E
Good
Good
Poor
D
–1.4 –1.2 –1.0–0.8–0.6–0.4–0.2 0.0 0.2 0.4 0.6 0.8 1.0 1.2 1.4
Frost risk
Fig. 19.1. SOP
2
spatial distribution using the bi-dimensional IMU classification criteria (water availability
and frost risk).
Basal area analysis
Based on the comments on both regions C and E, looking at the asymptote for basal
ar
ea it is clear that this parameter (18.8 + 0.79 DH
10
average = 47.2 m
2
/ha) is higher
for region E: the average estimate for region C is given by 18.8 + 0.35 DH
10
average
= 27.9 m
2
/ha.
Although with some variation, it may be observed that as frost risk becomes
higher
, the value for the potential basal area (asymptote) becomes lower. This varia-
tion is partly due to water availability, which, for example, may explain the differ-
ence between the basal area asymptotes in regions Good and B that are not very
exposed to frost risk but have low water availability.
The stands located in region Good are clearly the most productive stands: both
asymptotes, for dominant height and basal ar
ea, have the maximum values observed.
The growth rate parameter for dominant height is the lowest, whereas for basal area,
based on the average number of trees per hectare, the value is around average.
22Amaro Forests - Chap 19 1/8/03 11:53 am Page 221
The SOP Model 221
30
25
20
15
10
5
0
DH estimates (region E)
30
25
20
15
10
5
0
DH estimates (region D)
30
25
20
15
10
5
0
DH estimates (region Good)
0246 8 10 12 0246 8 10 12 0246 8 10 12
t
2
(years) t
2
(years) t
2
(years)
Fig. 19.2. Dominant height estimates (m) for regions D, E and Good.
Statistical analysis
All the more usual quality evaluation estimation indicators (e.g. mean residual and
r
oot mean residual sum of squares) were computed during all stages of the process,
showing that no strong violations of the zero mean error and constant error variance
assumptions were detected: the functional forms (tested previously against a rele-
vant number of different functional forms (Amaro, 1997)) are appropriate to express
the growth pattern of eucalyptus stands in Portuguese conditions. The large data set
has helped to generate estimates that are asymptotically unbiased.
However, the estimation process was performed with potential statistical
violations: the RHS component of both equations is not deterministic and is equal
to the endogenous variable at dif
ferent times. The past estimation procedures
(Amaro, 1997), similar projects and their positive outcomes (e.g. Amaro and Reed,
2001), along with the effective parameter interpretability, help to validate the pro-
cedure and to attempt the hypothesis that the statistical violations are not at all
relevant.
SOP
1
was re-estimated considering the new data set with N2SLS and N3SLS. The
same irrelevance on the quality indicators was observed. The residual error variance
estimate for
SOP
1
compared with SOP
2
shows a clear reduction in uncertainty (Table
19.6).
The observed reduction is relevant although non-significant (likelihood test).
Although the base functional form is exactly the same, the new str
ucture of the
dummy variables, especially the regions that are assigned to each of these cate-
gories, has a different spatial distribution. The aggregation of regions (from
SOP
2
to
SOP
1
) is not direct (e.g. region 0 in SOP
1
corresponds to IMU 3, 5 and 7 that are spread
out and mixed in the seven proposed new regions).
Conclusions
This work started from a eucalyptus stand growth model, SOP
1
, that considers two
spatial submodels.
SOP
1
is being used by a pulp and paper company, Soporcel, within
their decision-support process. Uncertainty has been detected within some projec-
tions and
SOP
2
was designed in order to reduce this uncertainty.

22Amaro Forests - Chap 19 1/8/03 11:53 am Page 222
222 A. Amaro
Table 19.6. Residual mean sum of squares for both SOP
1
and SOP
2
(n = 8577), considering both N2SLS
and N3SLS methods.
SOP model Number of parameters N2SLS N3SLS
SOP
1
(Amaro, 1997) 12 1.42223 1.45898
SOP
2
20 1.34977 1.34964
A new data set was obtained, filtered and validated and an estimation proce-
dure has been defined.
Due to the empirical nature of the
SOP system of equations, the step-by-step
approach, using different methods in order to estimate parameters, is probably more
appropriate. Although it is much more time-consuming, it allows, as the analyses
evolve, the addition of more knowledge to the system’s behaviour and understand-
ing.
The NOLS individual estimation allowed the initial estimate assessment and a
r
ough idea of its magnitude. The use of less heavy algorithms (Quasi-Newton and
Rosenbrock’s), although possibly not as efficient as Levenberg–Marquardt’s,
speeded up the individual estimation process.
The several possibilities for stand aggregation were used as an argument for the
simultaneous estimation with NOLS, using the r
egional dummy variables, built on
the basis of the less productive region (Poor). This procedure allowed the aggrega-
tion of regions without any concern for the verification of statistical assumptions:
seven different regions were selected as modelling units.
Due to the simultaneous nature of the equations, N2SLS was run and, further,
due to the corr
elation between errors on both equations and in order to prevent bias
and subsequently run significance tests, N3SLS was also run.
The estimates obtained during the three main steps on the seven final regions do
not dif
fer in a relevant way, although the final estimates obtained through N3SLS are
most probably the best estimates, and in particular produce the most efficient stan-
dard deviations parameter estimates that permit the significance tests.
The residual error variance estimate for
SOP
1
, actually being used by Soporcel,
was reduced when compared with
SOP
2
.
The statistical violations, namely the non-deterministic characteristic of both the
dominant height and basal ar
ea variables on the RHS of the correspondent equa-
tions, were considered non-relevant based on past analysis, parameter meaningful-
ness and impact of violation.
The non-significance of the parameter tests would lead to a region merge or
separation task that by no means invalidates the actual values: the pr
ocess is unfin-
ished and more work needs to be done in order to not only validate the
SOP
2
model
(which Soporcel will eventually do and will identify the real negative points of the
model) but also to continuously reduce the observed uncertainty (e.g. by modifying
the system’s functional forms – the most accurate way of targeting the statistical
assumptions – or by creating additional submodels). All of this must be assisted by
an accurate inventory database.
Finally and re-stating what has already been said (Amaro, 1997), water avail-
ability and fr
ost risk are both limiting factors to eucalyptus growth patterns! Water
seems to help to establish the potential and frost risk more as a rate-to-potential
regulator. In basal areas, however, the potential seems to be more influenced by frost
risk.

22Amaro Forests - Chap 19 1/8/03 11:53 am Page 223
The SOP Model 223
Acknowledgements
This study was supported by project Sapiens PCTI/1999/MGS/36578 and data pro-
vided by Soporcel.
References
Amaro, A. (1997) Modelação do crescimento de povoamentos de Eucalyptus globulus Labill de
1
a
rotação em Portugal. PhD dissertation, IST, UTL, 241 pp.
Amaro, A. and Reed, D. (2001) Forest re-measurements and modelling strategies. In: Proceedings
of the Conference on Forest Biometry, Modelling and Information Science. University of
Greenwich, 25–29 June. Available at: cms1.gre.ac.uk/conferences/iufro/proceedings/
AmaroReed1.pdf
Amaro, A., Themido, I. and Tomé, M. (1994) A definição de unidades de gestão de informação
num sistema de apoio à decisão para a gestão florestal. In: III Congresso Florestal Nacional.
Actas 1, Figueira da Foz, pp. 74–82.
Bates, D.M. and Watts, D.G. (1988) Nonlinear Regression Analysis and its Applications. John Wiley,
New York, 365 pp.
Borders, B.E. (1989) System of equations in forest stand modelling. Forest Science 35, 548–556.
Gujarati, D.N. (1995) Basic Econometrics. McGraw-Hill International, Economic Series, 838 pp.
Huang, S. and Titus, S. (1999) Estimating a system of nonlinear simultaneous individual tree
models for white spruce in boreal mixed-species stands. Canadian Journal of Forestry
Research 29, 1805–1811.
Murphy, P.A. (1983) A nonlinear timber yield equation system for loblolly pine. Forest Science
29, 582–591.
SPSS (1996) SPSS Base System Syntax Reference Guide. Release 7.5.1.
StatSoft (2001) STATISTICA (Data Analysis Software System), version 6. Available at:
www.statsoft.com
Tomé, M., Falcão, A., Carvalho, A. and Amaro, A. (1995) A global growth model for eucalypt
plantations in Portugal. Lesnictví-Forestry 41(4), 197–205.
22Amaro Forests - Chap 19 1/8/03 11:53 am Page 224

23Amaro Forests - Chap 20 25/7/03 11:08 am Page 225
20 Evaluating Estimation Methods for
Logistic Regression in Modelling
Individual-tree Mortality
Virpi Alenius,
1
Hannu Hökkä,
1
Hannu Salminen
1
and
Sylvain Jutras
2
Abstract
In this study we compared individual-tree mortality models for peatland Scots pine (Pinus
sylvestris L.) in Finland constructed using different estimation methods. We applied standard
logistic regression with the maximum likelihood (ML) method by ignoring the data structure,
and alternatively accounted for the data hierarchy using generalized linear mixed models with
either the marginal quasi-likelihood (MQL) or penalized quasi-likelihood (PQL) estimation
method. We evaluated the models on the basis of traditional logistic regression goodness-of-fit
criteria including the
χ
2
test, sensitivity, specificity, rate of correct classification, bias and the
receiver operating characteristic (ROC) curves with subsequent R
2
. The interpretation of the fit
measures appeared to be complicated. The ML and MQL methods resulted in models with
high sensitivity, a high rate of correct classification and low bias. Despite the good fit measures,
the Hosmer–Lemeshow test suggested rejection of the models. The graphical expression of the
models’ ROC curves did not give additional information to make a selection between any of
the models, but the R
2
showed that the models obtained with the ML and MQL methods were
slightly better than that obtained with the PQL method.
Introduction
When modelling the development and survival of forest stands, the status of an
individual tree at a certain time is described by two possible values; the tree is either
alive or dead, i.e. the response is typically binary. Logistic regression has generally
been used as the method to describe the relationship between a binary outcome and
continuous explanatory variables. Consequently, logistic regression has been
applied in modelling the probability of individual trees dying along the forest suc-
cession. During recent years, other methods such as binary classification tree
(CART) (Dobbertin and Biging, 1998) and neural computing (Guan and Gertner,
1991; Hasenauer et al., 2001) have also been successfully introduced into forestry
modelling, but are not considered in this chapter.
1
Finnish Forest Research Institute, Rovaniemi Research Station, Finland
Correspondence to: Virpi.Alenius@metla.fi
2
Département des Sciences du Bois et de la Forêt, Université Laval, Canada
© CAB International 2003. Modelling Forest Systems (eds A. Amaro, D. Reed and P. Soares) 225