Ahsan A. Two Phase Flow, Phase Change and Numerical Modeling
Подождите немного. Документ загружается.


A Numerical Study on Time-Dependent Melting and
Deformation Processes of Phase Change Material (PCM) Induced by Localized Thermal Input
529
2
3
(1 )
,
mush
p
Av
β
β
−
∇=−
(6)
where
mush
A is a constant (
6
1.0 10× ) accounting for the mushy region morphology. In order
to achieve this behavior, we implemented a source term in the momentum equation for the
mushy zone (a region in which the liquid fraction lies between 0 and 1):
2
3
(1 )
,
()
mush
SA v
β
βε
−
=−
+
(7)
where
ε
is a computational constant ( 0.001 ) introduced to prevent division by zero.
In the energy equation, h is the sensible enthalpy, which is
,
ref
T
ref p
T
hh cdT=+
(9)
where,
re
f
h is the reference enthalpy,
re
f
T is the reference temperature and
p
c is specific heat.
In the continuity and momentum equation,
β
determines whether a computational cell is
solid or not.
β
is a function of temperature, and can be described as
0 ,
1 ,
()/( ) .
solidus
liquidus
solidus li
q
uidus solidus solidus li
q
uidus
if T T
if T T
TT T T ifT TT
β
<
=>
−−<<
(10)
Furthermore, the energy equation takes into account latent heat as the volume source for the
heat transfer condition at the melting front,
h
S
:
()
(),
h
H
SvH
t
ρ
ρ
∂Δ
=+∇⋅Δ
∂
(11)
where
HΔ is latent heat, and is defined as
HL
β
Δ=
, where L is latent heat of PCM material.
To represent the free surface of the melting region adjacent to the gas phase, the VOF
method is used. In this method, function
F is a scalar field, which defines the state of a
particular cell in the computational domain:
1 ,
01 ,
0,
liquid or solid
FFpartialgas
gas
=
=<<=
=
(12)
and
F also satisfies the conservation equation
()
()0,
DF F
vF
Dt t
β
β
∂
=+∇⋅=
∂
(13)
Two Phase Flow, Phase Change and Numerical Modeling
530
and the material properties involved in equations (1) to (3) are written as follows:
,,, ,,
()(), ()
()(), ( )( ).
=+ − + − = + −
=+ − + − = + − + −
sgs lg g lg
s
g
sl
gpp
s
pg p
s
p
l
pg
FF
kk k k Fk k c c c c Fc c
ρρ βρ ρ βρρ μβμ βμμ
ββ β β
(14)
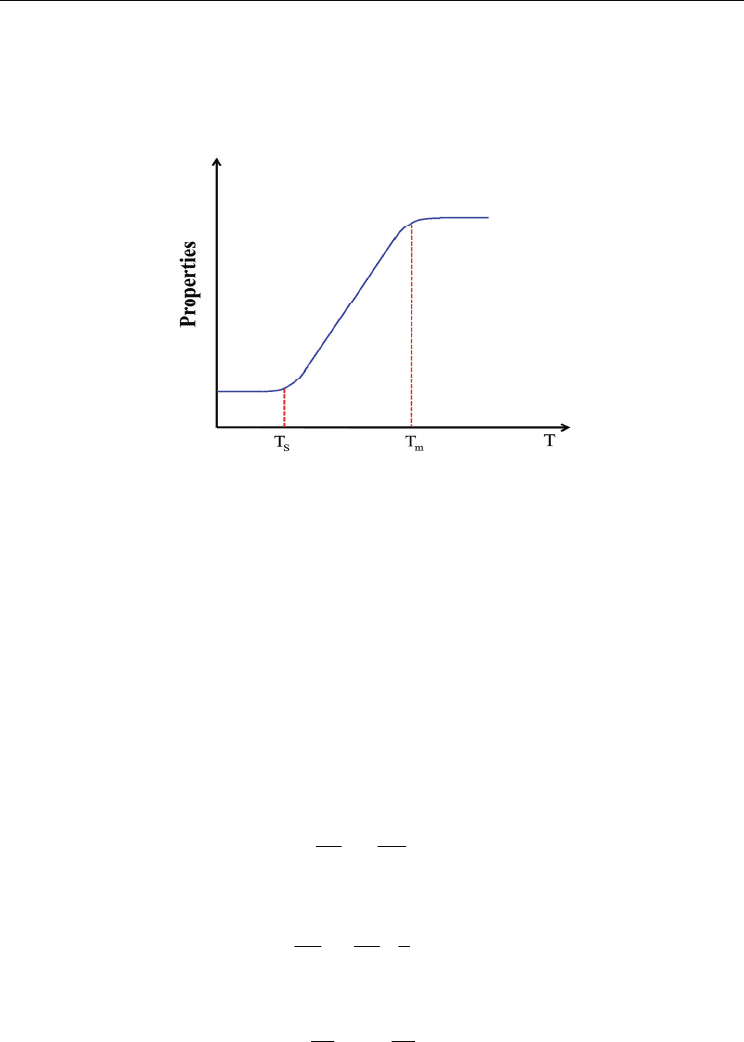
Fig. 4. Temperature dependent smoothed function for modeling properties intermediate
between the solid and liquid phases
A smoothed piecewise-polynomial profile, which is a function of temperature, is used due
to discontinuities in properties between solid and liquid PCM. This is shown in Fig. 4.
2.2 Initial and boundary conditions
The initial temperature of domain is 300 K, and the localized thermal input temperature is
500 K. The conjugated thermal boundary condition is applied between the copper and the
solid PCM, and the heat balance equation between the PCM and air. The boundary
conditions are expressed as follows:
at x = 0
300 ;TK=
at interface between the PCM and air
0 ;
∂
∂
−=
∂∂
g
l
lg
T
T
kk
nn
(15)
at interface between the solid and liquid PCM
() ;
∂∂
−=−
∂∂
sl
sl sl
TTk
kk TT
nnl
at other boundaries
0 or 0.
∂∂
==
∂∂
TT
xy
A Numerical Study on Time-Dependent Melting and
Deformation Processes of Phase Change Material (PCM) Induced by Localized Thermal Input
531
3. Results and discussion
3.1 Model validation
To validate the model, a simple melting problem of gallium in a cavity by the use of
Enthalpy-Porosity method was solved and compared with experimental results. Fig. 5
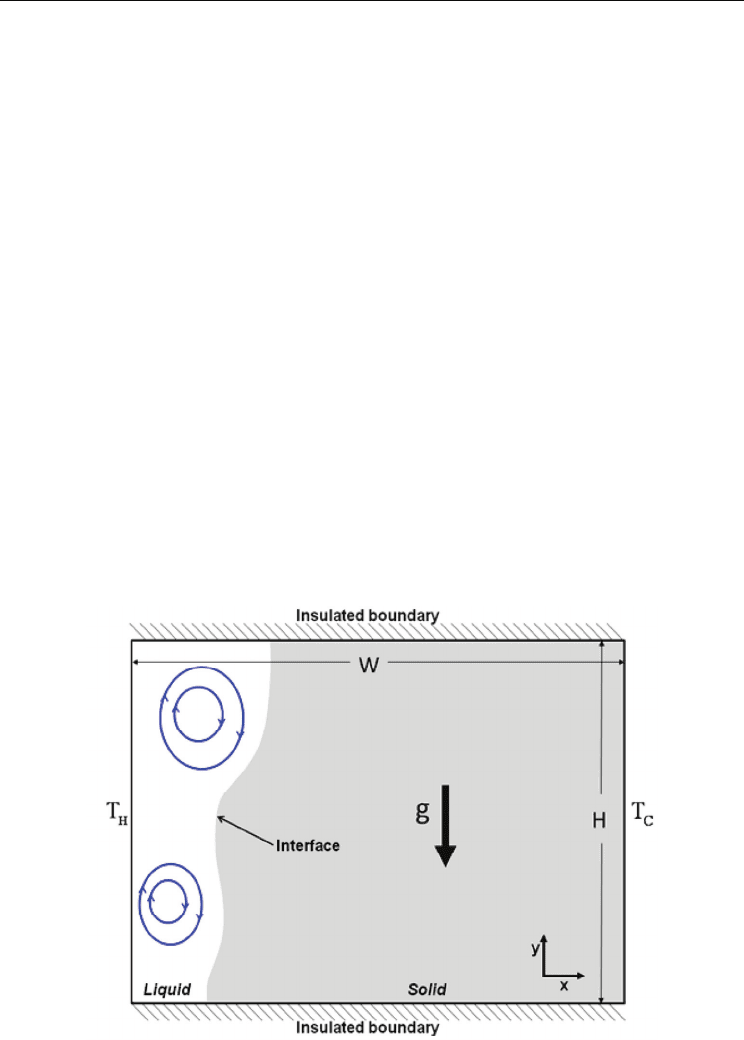
shows the schematic illustration of the physical configuration of gallium melting. Solid
gallium occupies the whole domain, T
H
= 311 K is heated wall temperature, and T
C
= 301.3
K is cold wall temperature. The boundaries of the top and bottom surfaces are isothermal
walls. The width W = 8.89 cm and the height H = 6.35 cm. Normal gravity is applied in the
downward. Details of the applied material properties and information on the experimental
setup are described in Brent’s work (Brent, 1988). Once the calculation is started, the solid
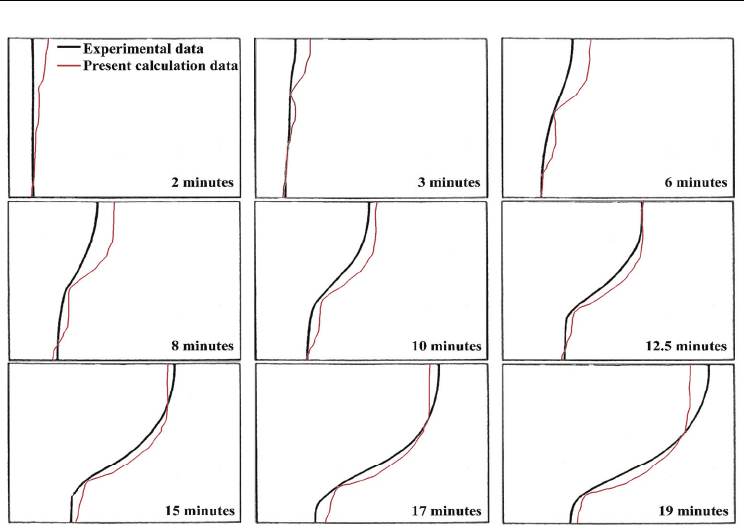
gallium melts. Fig. 6 shows the shape and location of the solid-liquid interface at several
times during the melting process. The black and red lines indicate the experimental (Brent,
1988) and calculated data respectively. Before a time of 2 minutes, the shape of the interface
is nearly flat because convection is still weak and melting is driven by conduction. After 2
minutes, the interface becomes wavy due to the circular flow inside the molten region.
The position of the melt front near the top surface in the calculation before a time of 12.5
minutes is over-estimated compared to experiment, and after 19 minutes, it is
underestimated. However, the overall trend shows good agreement with experiment and
we can safely said that our model and code are fairly validated to track the melting
boundary satisfactorily. It is well known that a key point in the calculation of melting is
the exact interface position between the solid and liquid phases. But in case of a
convection-driven melting problem, such exact prediction is difficult due to the complex
convection flow inside the liquid. For this reason, numerical studies for convection flow
inside molten liquids require more attention (Noureddine, 2003).
Fig. 5. Schematic of gallium melting
Two Phase Flow, Phase Change and Numerical Modeling
532
Fig. 6. Comparison of experiment (Brent, 1988) and current numerical model: position of
melt front with time
3.2 Expansion to three phase problem
The two dimensional continuity and Navier-Stokes equations are solved with the Enthalpy-
Porosity and the VOF methods in order to simulate a melting and falls-off PCM and we can
safely said that our model and code are fairly validated to track the melting boundary
satisfactorily hereafter. For precise calculation the free interface between liquid PCM and air
and linear surface tension, which is function of temperature, are considered. And to reduce
the numerical oscillation at the interface discontinuity, a piecewise polynomial profile
between the solid and liquid state PCM materials is used.
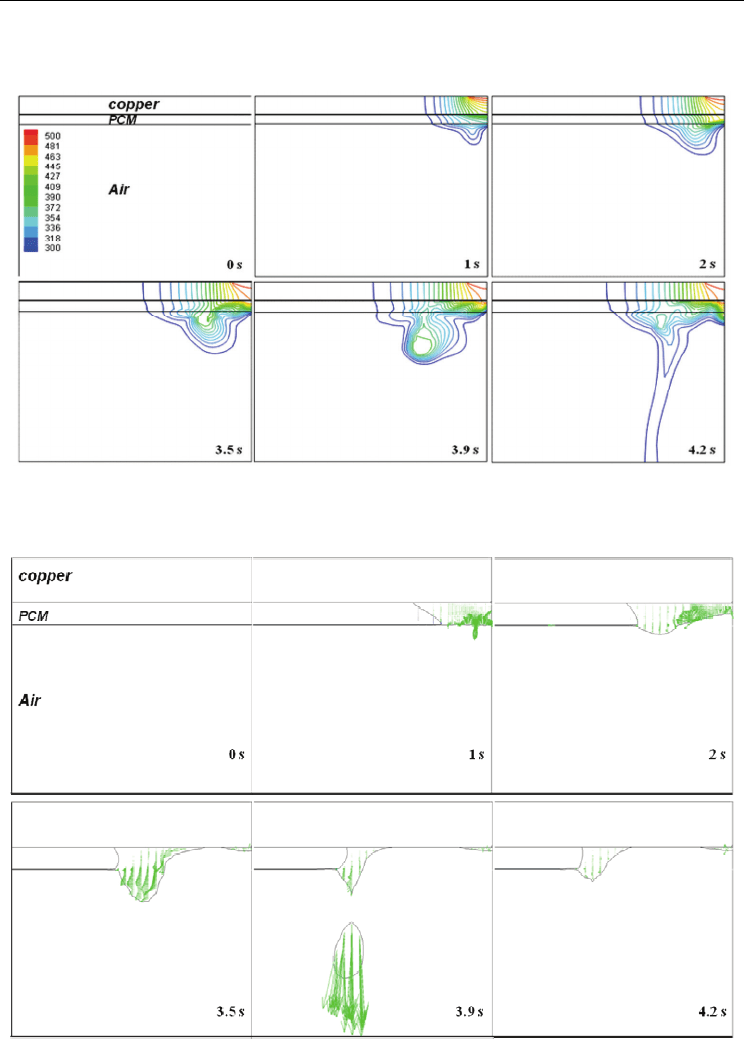
Energy determines critical point of melting and most physical and transport properties vary
with it in melting phenomena. For this reason, at first, the temperature profiles as a function
of time at 0, 1, 2, 3.5, 3.9 and 4.2 s are shown in Fig. 7. At 3.9 s, melted PCM separates from
the ceiling and falls-off. In this calculation, convection mode heat transfer can be negligible
due to no force flow. Heat is transferred by conduction through the copper from the
localized thermal input imposed from the right corner at the top surface, and then passed to
the PCM and air. At the interface boundary between different materials, a discontinuity in
temperature is observed. The temperature profile in all regions shows a decrease over a
wide range of y in the air.
Because convection flow inside molten PCM affects the shape of the melt front directly, flow
inside molten PCM is shown in Fig. 8 as velocity vectors. During molten PCM growth, the
velocity vector is generated inside the molten PCM and then moves to the left. At 3.5 s, a
A Numerical Study on Time-Dependent Melting and
Deformation Processes of Phase Change Material (PCM) Induced by Localized Thermal Input
533
relatively high surface velocity near the molten ball is observed. When falls-off of molten
ball is experienced at 3.9 s, a high velocity driven by gravity is observed.
Fig. 7. Temperature distribution in copper, PCM and air as a function of time (localized
thermal input is imposed from right side on the top surface of copper)
Fig. 8. Velocity vector field and solid-liquid interface at t = 0, 1, 2, 3.5, 3.9 and 4.2 s
Two Phase Flow, Phase Change and Numerical Modeling
534
Fig. 9 shows the volume fraction, F . In this figure, change of free surface interface between
gas and PCM are observed. Free surface interface becomes to strech from 2 s, and then free
surface interface moves to left direction. It is important to note that the melted region cannot
be distinguished solely by
F .
Fig. 9. Time dependence of the volume fraction distribution
Fig. 10. Time dependence of the liquid fraction distribution
A Numerical Study on Time-Dependent Melting and
Deformation Processes of Phase Change Material (PCM) Induced by Localized Thermal Input
535
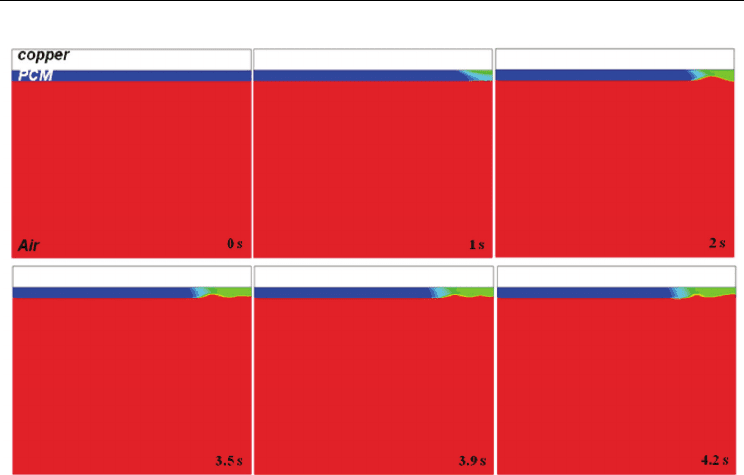
Fig. 11. Distribution of (
β
+ F )/2 with respect to time
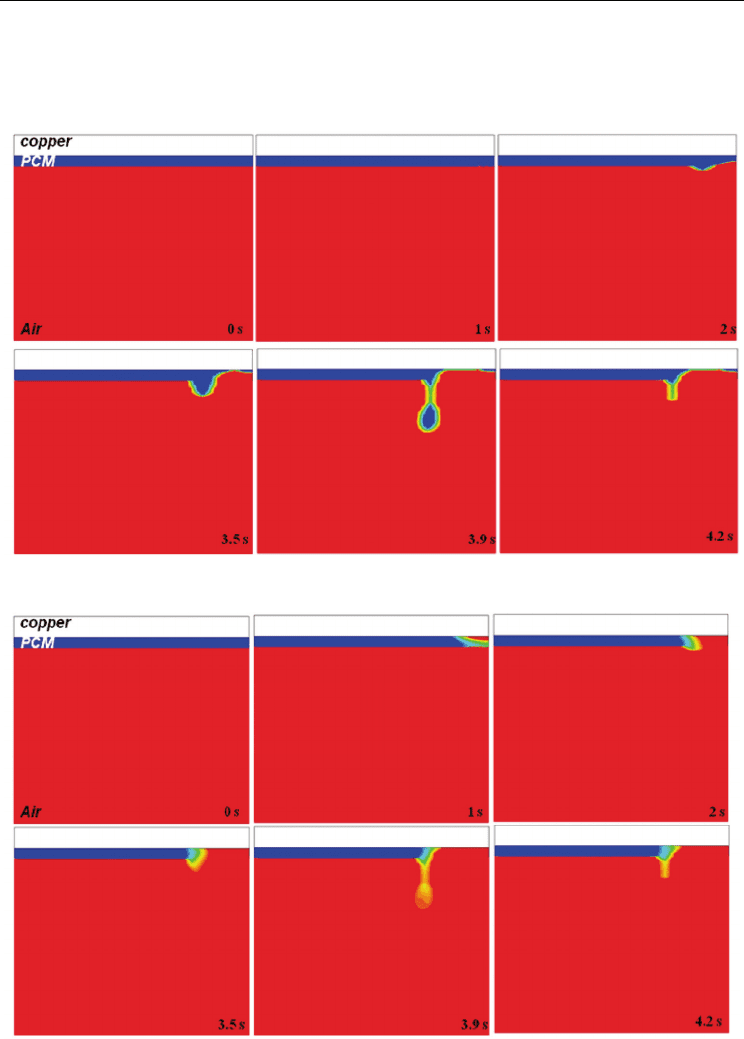
Fig. 10 illustrates the melting processes by use of liquid fraction
β
.
β
determines the melt
front by both solidus and liquidus temperature. When cell temperature is lower than solidus
temperature,
β
= 0, mass and momentum equations are turned off, and energy equation is
only solved. When cell temperature is higher than liquidus temperature,
β
= 1, all equations
are solved. If temperature is between solidus and liquidus temperature, 0<
β
<1, cell is
treated as partial liquid region, which is represents a mushy region. Here blue is solid
region, and red means gas or liquid region. Figure at 1 s shows that melting of PCM begins
to happen at the right conner of top surface. After that, melting front advances to left, and
then molten ball falls-off at 3.9 s, as stated. But it is hard to distinguish where is liquid and
gas region when melt front touch the gas phase. To the end, in order to visualize the three
phases together, the simple combined relation, (
β
+
F
)/2, is shown in Fig. 11. When
(
β
+ F )/2 = 1, all computational cells are shown in red, and this represents the gas phase.
When (
β
+ F ) = 0, all computational cells are shown in blue, and this represents the solid
phase. When 0<(
β
+
F
)/2<1, intermediate colors are used to represent the liquid region.
Melting in the solid state PCM initially takes place due to absorption of heat from the
adjacent copper by localized thermal input. When heat reaches to the free surface between
the liquid PCM and air, free surface starts to deform. After that, molten PCM moves to the left
and starts to form a molten ball, as shown at 3.5 s. Molten PCM is sustained till 3.9 s, and then
the molten ball falls-off eventually. By introducing (
β
+ F )/2 for identification of edge of
each phase, we can see a melting as well as falls-off process clearly.
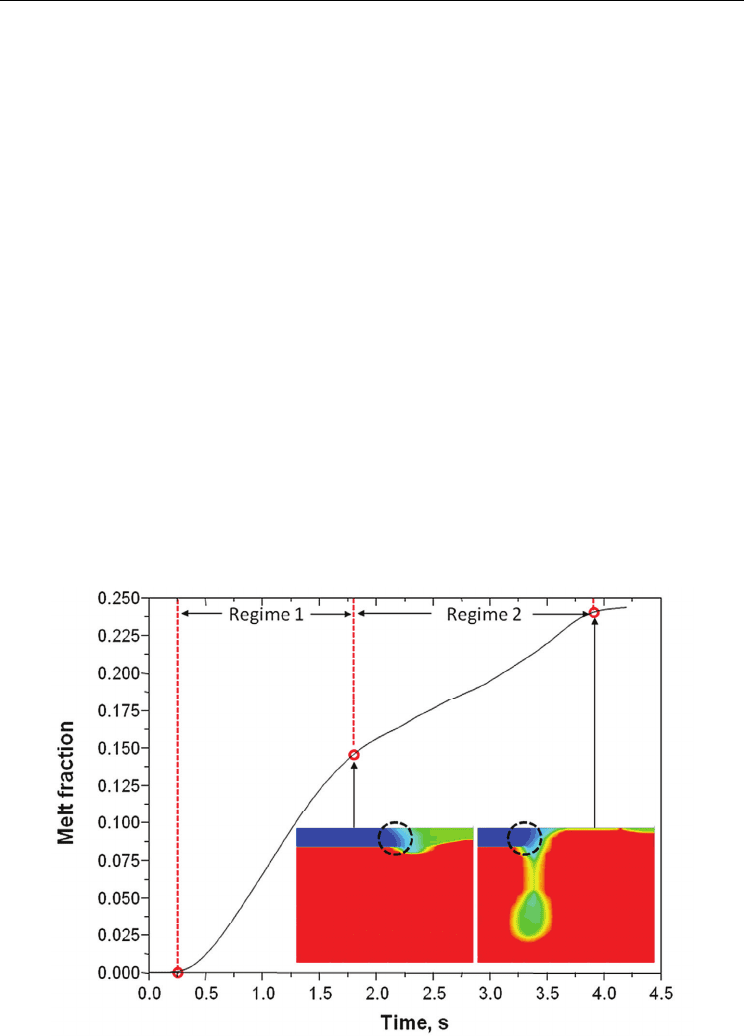
Fig. 12 represents the melt fraction as a function of time. It is estimated that 24% of the PCM
is melted during 4.2 s. Melting of PCM is started at 0.25 s. The melt fraction variation with
time exhibits a different gradient after 1.8 s. This behaviour can be categorized by two
regimes: regime 1 from the starting point of melting to the point at which the molten ball
begins to grow; regime 2 from the point of the initiation of molten ball growth and the point
at which molten ball starts to drop. These two regimes can be explained by different
Two Phase Flow, Phase Change and Numerical Modeling
536
conduction modes. In regime 1, the conduction from copper governs the heat transfer to the
solid PCM, and this directly affects the melt fraction. However, liquefied PCM on the right
hand side moves to the left, and then it generates the molten ball. Therefore, when the melt
front becomes isolated from the localized thermal input, it is more affected by the molten
ball than by the copper. So in regime 2, heat transfer by conduction from the molten ball
dominates the melt fraction rather than that from copper. This can be more easily
understood by observing the shape of solid PCM adjacent to the melt front and the melt
fraction after the molten ball falls-off (as it is shown by the inset in Fig.12). Within regime 1,
the top part of the solid PCM is more melted than the bottom part because the conduction
mode of heat transfer from the copper mainly affects the PCM. However in the case of
regime 2, the bottom part of the solid PCM is more melted than the top part because the
molten ball governs the heat transfer to the solid PCM rather than from the copper. It is
also seen that after the falls-off the molten ball, the melt speed is dramatically reduced.
This fact could support above-mentioned thermal status, such that the heat from the
molten ball is mainly governed by melting phenomena in the PCM before the falling-off is
experienced.
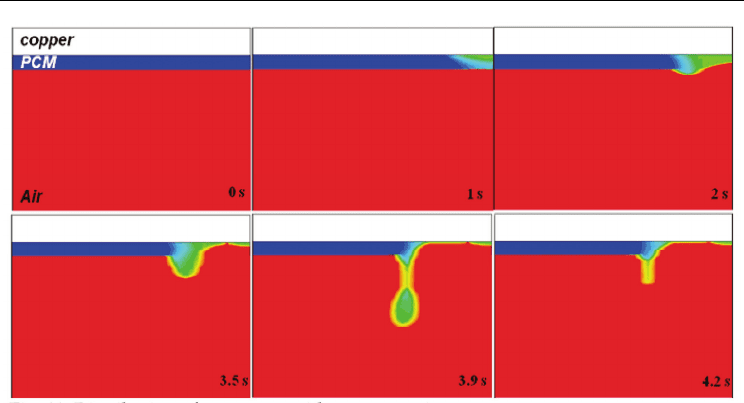
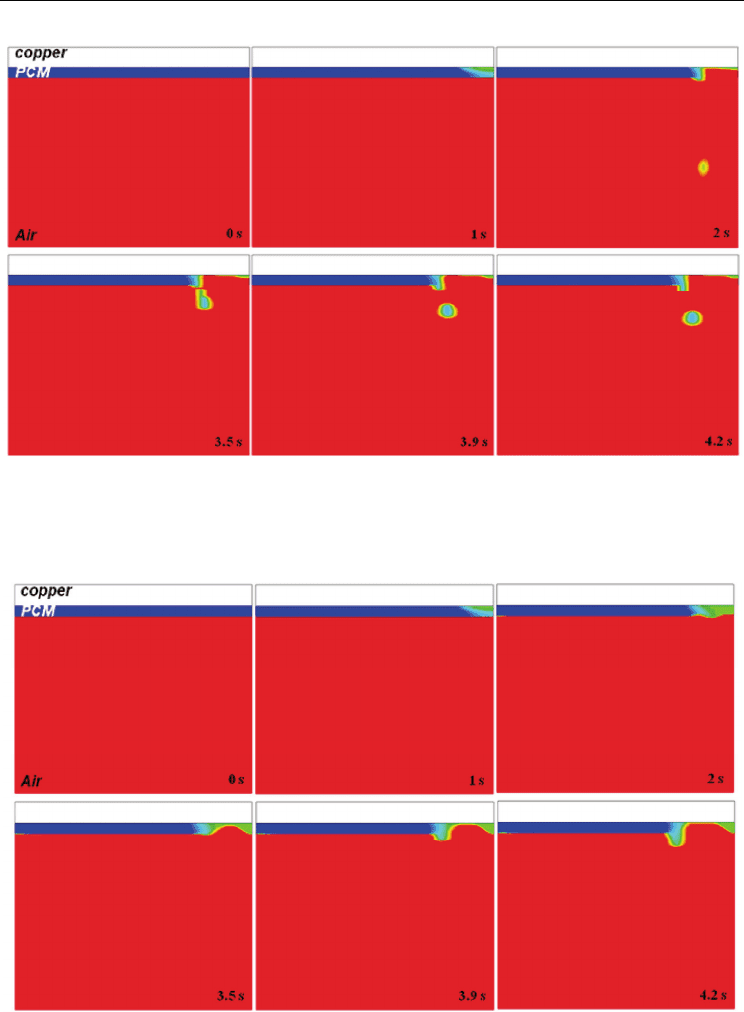
()/2F
β
+
are shown with various surface tension coefficients, [σ] in Figs. 13, 14 and 15.
Falling-off of molten phase is only happen in Fig. 13 (surface tension coefficient; [σ] = 0.15),
and is repeated. But when relatively high surface tension is forced, free surface of molten
PCM is sustained along the copper, and melted region is broadening out, which is shown in
Figs. 14 and 15. Especially, in case of surface tension [σ] = 0.35, surface becomes wavy, and
molten ball is not generated till 4.2 s. The surface tension force is a tensile force tangential to
the interface separating pair of fluids, and it tries to keep the fluid molecules at the free
surface. Therefore, molten PCM can be sustained with growth of forced surface tension.
Fig. 12. Melt fraction with time, showing two regimes
A Numerical Study on Time-Dependent Melting and
Deformation Processes of Phase Change Material (PCM) Induced by Localized Thermal Input
537
Fig. 13. Distribution of
()/2F
β
+ with respect to time (surface tension coefficient, [σ] = 0.15)
Fig. 14. Distribution of
()/2F
β
+ with respect to time ([σ] = 0.25)
Two Phase Flow, Phase Change and Numerical Modeling
538
Fig. 15. Distribution of
()/2F
β
+ with respect to time ([σ] = 0.35)
4. Conclusion
The model proposed in this study has been successfully applied in the elucidation of the
melting process involving three phases and the falling-off phenomena of sustained solid
matter. The Enthalpy-Porosity and VOF methods generate scalar transport and involve
source term in the governing equations. Additional treatment for surface tension and
material properties at the interface between solid and liquid PCM are applied. Validation of
the current model by existing experiment shows reasonable agreement from the
mathematical as well as from the physical points of view. Discontinuity at the phase
interface is inherently included in the governing equation at each time step. However this
may generate errors during the progression of time. Therefore we precisely included heat
transfer, motion of molten ball and melting rate in the model to minimize such errors.
Furthermore we suggested that there are two different dominant modes during the
melting and falls-off process: one is the copper conduction driven mode and the other is
the molten PCM driven mode. Finally, possible effect induced by surface tension on heat
transfer in PCM was elucidated. Although the model requires further development and
validation of the model with the inclusion of much more complex phenomena such as
species transport and combustion processes, and this study has brought one of major
insights of teat transfer which possibly occurs during the wire combustion.
5. Acknowledgment
The authors gratefully acknowledge the financial support for this research provided by JSPS
(Grants-in-aid for Young Scientists: #21681022; PI: YN) and the Japan Nuclear Energy Safety