Ahsan A. (ed.) Evaporation, Condensation and Heat transfer
Подождите немного. Документ загружается.


Computational Fluid Dynamic Simulations of Natural Convection in Ventilated Facades
359
Layer Material Width (m) ρ (kgm
-3
)
λ
(Wm
-1
K
-1
)
1 (Ext) Brick slabs 0.045 800 0.30
2 Air (ventilation duct) 0.10 - 0.56
3
Rigid fibreglass
panels
0.04 100 0.038
4 Cement mortar 0.015 2000 1.40
5 Brick in hollow blocks 0.18 1600 0.59
Facade P1
R
tnv
=1.855
m
2
KW
-1
6 (Int)
Lime mortar and
cement plastering
0.015 1800 0.90
1 (Ext) Slabs of ceramics 0.013 2700 1.00
2 Air (ventilation duct) 0.10 - 0.56
3
Rigid fibreglass
panels
0.03 100 0.038
4 Cement mortar 0.015 2000 1.40
5 Brick in hollow blocks 0.19 1200 0.43
Facade P2
R
tnv
=1.855
m
2
KW
-1
6 (Int)
Lime mortar and
cement plastering
0.015 1800 0.90
1 (Ext)
Cement fibred
reinforced panels
0.05 315 0.92
2 Air (ventilation duct) 0.10 - 0.56
3
Rigid fibreglass
panels
0.03 100 0.038
4 Cement mortar 0.015 2000 1.40
5
Brick in hollow blocks
of concrete
0.14 1100 0.35
Facade P3
R
tnv
=1.855
m
2
KW
-1
6 (Int)
Lime mortar and
cement plastering
0.015 1800 0.90
1 (Ext) Aluminum 0.001 2700 220
2 Vermiculite 0.026 90 0.08
3 Aluminum 0.001 2700 220
4 Air (ventilation duct) 0.10 - 0.56
5 Cement mortar 0.01 1800 0.70
6 Poroton Block 0.2 1600 0.17
Facade P4
R
tnv
=1.855
m
2
KW
-1
7 (Int)
Lime mortar and
cement plastering
0.015 1800 0.70
Table 2. Thermophysical characteristics of unventilated roofs.
Thermo-physical characteristics and geometry (thickness d, density ρ, solar absorptivity α,
and conductivity λ) of the four structures are showed in Table 2. The four samples of facade
have been chosen with the same value of thermal resistance (R
nv
=1,855m
2
kW
-1
) but different
external surface coating:
• facade P1 has a brick exterior coating;

Evaporation, Condensation and Heat Transfer
360
• facade P2 has a coating of ceramic tiles;
• facade P3 has a coating of cement fibred reinforced panels;
• facade P4 has an external coating made of insulated panels in vermiculite covered with
aluminum on both sides.
In all the studied cases, the outer layer is anchored to a supporting structure made of brick
blocks. The facades P1, P2 and P3 present the insulating layer, consisting of a rigid fibreglass
panel with a thickness of 4 cm, placed in the inner slab, while in the case of the facade P4 the
coating panel also acts as insulation layer.
The ventilation openings that connect the ventilated cavity with the external environment
are placed at the base and at the upper part of facade and have a size of 20 cm x 100 cm
The friction factors and heat transfer coefficients are assumed to be constant along the duct.
Generally, the roughness value of the air duct is assumed to be quite high in order to take
into account the presence of supports inside the air duct. Obviously this parameter is not
uniform throughout the whole structure but it is realistic in the portion of the channel that is
not affected by the presence of supporting elements.
Therefore the sensitivity analysis for this parameter have been performed.
The roughness
b has been varied from 0,005 m up to 0,03 m. This sensitive analysis didn’t
show significant variations both for the velocity profiles and for the energy performance of
the ventilated facade. The value of roughness has been estimated as b = 0,02 m.
The solar absorptivity coefficient α has been defined constant because its difference between
the three studied cases is about from 0.02 up to 0.04, so it involves only a few hundredths of
temperature degrees changes in the temperature sun-air
T
as
. According to the studies in
references the solar absorption coefficient has been fixed in
α = 0,8.
Thermal resistances of inner and outer surfaces have been defined respectively r
i
=0.13
m
2
kW
-1
and re=0.04 m
2
kW
-1
.
7. Results and discussions
The authors have studied the behavior of the four types of facades, both in case of natural
ventilation and in the case of forced ventilation of the air in the duct.
For the study of a typical summer situation have been considered the following reference
conditions:
-
External temperature: T
e
= T0 = 301 K;
-
Indoor temperature: T
i
= 297 K;
-
Incident solar radiation: I = 400 W/m
2
.
The modeling of the real system has been performed using the computer code "Fluent"and
the pre-processor "Gambit".
The convergence criterion requires that the maximum relative difference between two
consecutive iterations for each local variable is less than 10
-3
.
Convergence has been generally obtained with a number of iterations, which varies from
case to case, but always between 800 and 1200 iterations.
7.1 Natural ventilation
Initially has been studied the behavior of the ventilated facade system in natural ventilation,
with the motion of air in the cavity caused by thermal and pressure gradients.
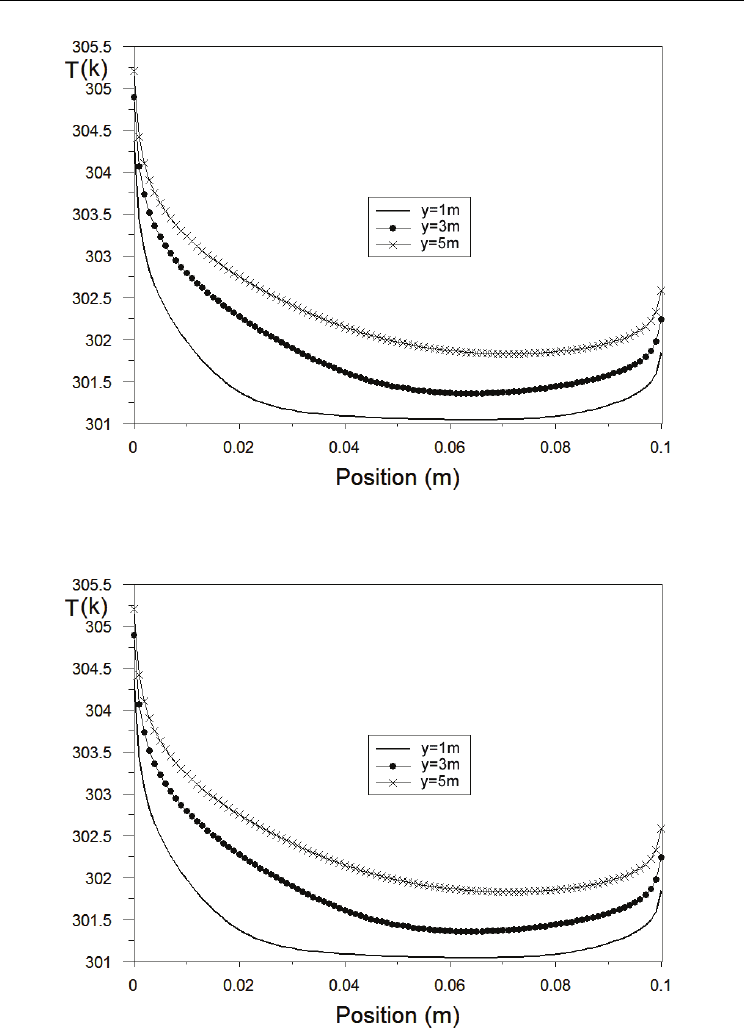
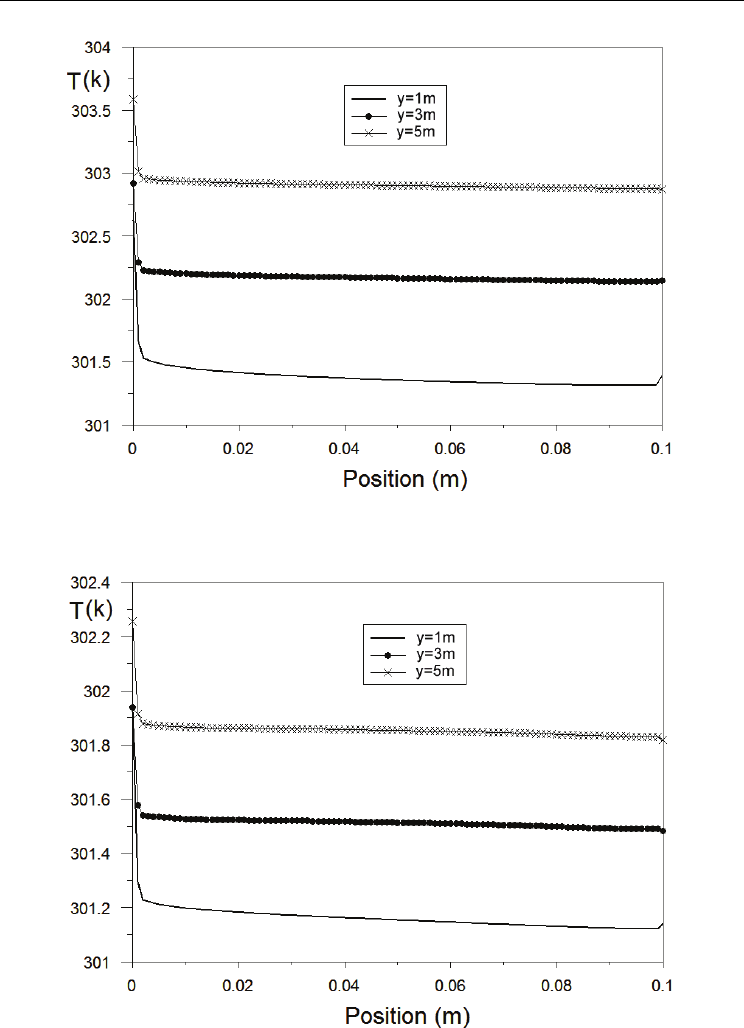
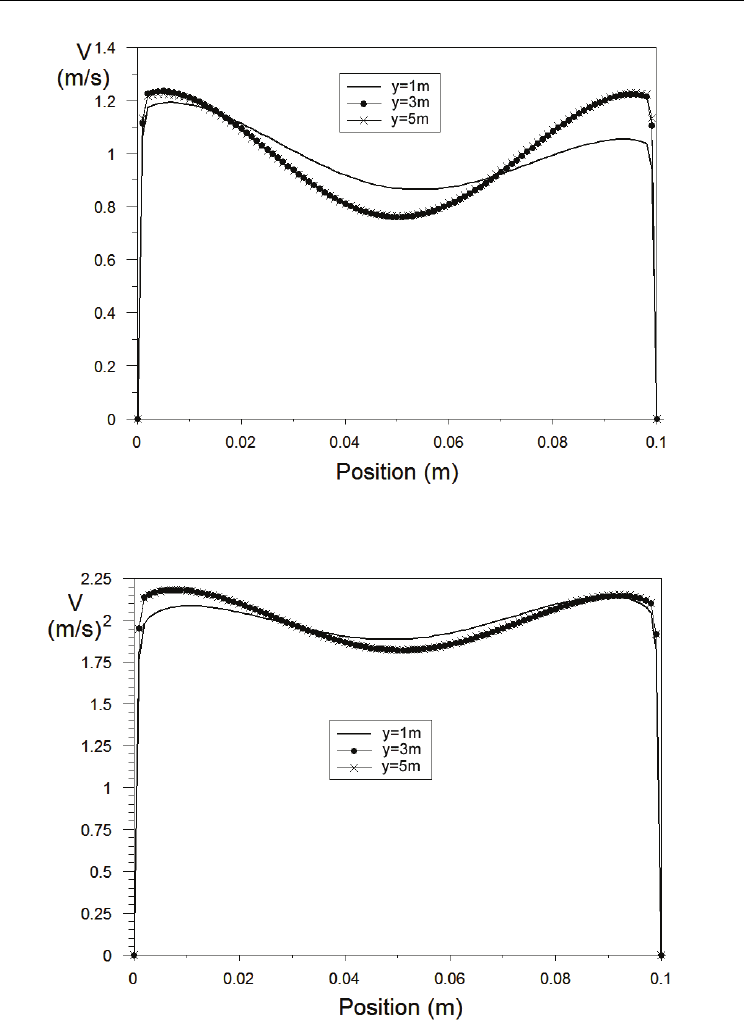
Figures 5 to 12 show the velocity and temperature profiles obtained for the four facades.
Computational Fluid Dynamic Simulations of Natural Convection in Ventilated Facades
361
Fig. 5. Facade P1- Temperature profiles (L=6 m, d=0.1 m, T
e
=301 K, I=400W/m
2
)
Fig. 6. Facade P2- Temperature profiles (L=6 m, d=0.1 m, T
e
=301 K, I=400W/m
2
)
Evaporation, Condensation and Heat Transfer
362
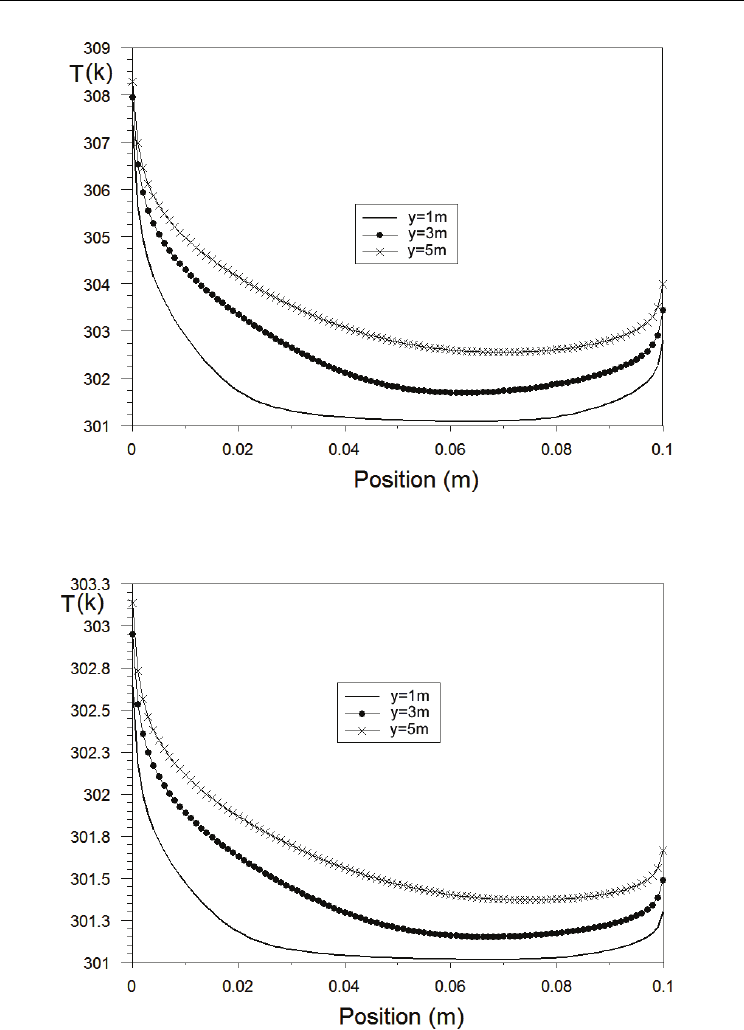
Fig. 7. Facade P3- Temperature profiles (L=6 m, d=0.1 m, T
e
=301 K, I=400W/m
2
)
Fig. 8. Facade P4- Temperature profiles (L=6 m, d=0.1 m, T
e
=301 K, I=400W/m
2
)
Computational Fluid Dynamic Simulations of Natural Convection in Ventilated Facades
363
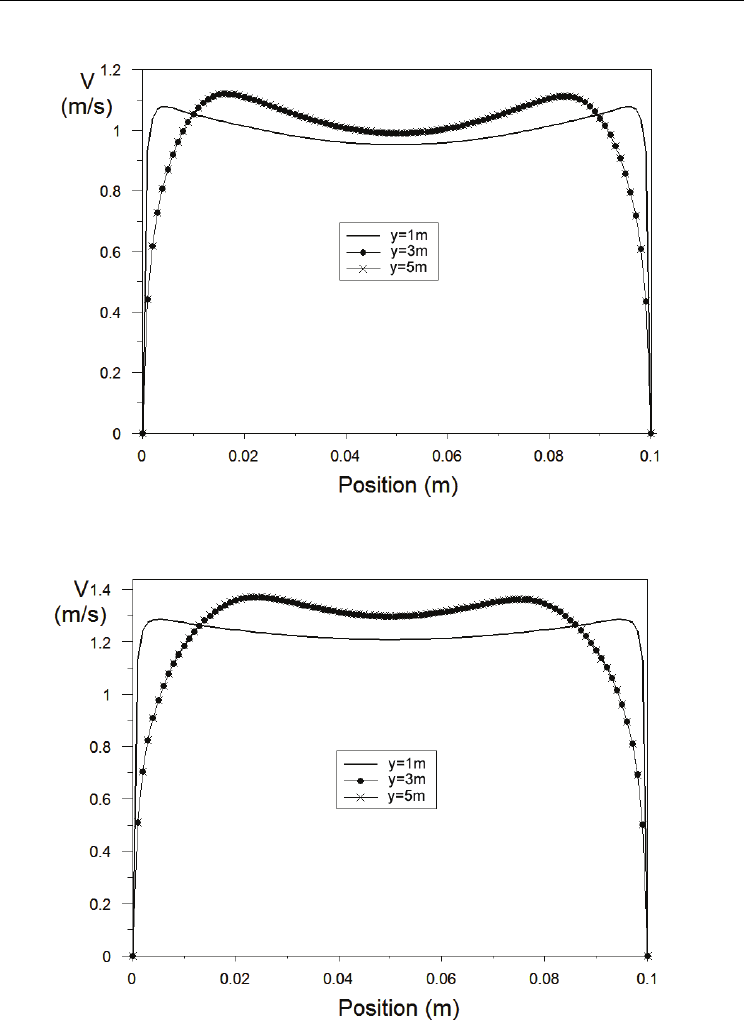
Fig. 9. Facade P1- Velocity profiles (L=6 m, d=0.1 m, Te=301 K, I=400W/m
2
)
Fig. 10. Facade P2- Velocity profiles (L=6 m, d=0.1 m, Te=301 K, I=400W/m
2
)
Evaporation, Condensation and Heat Transfer
364
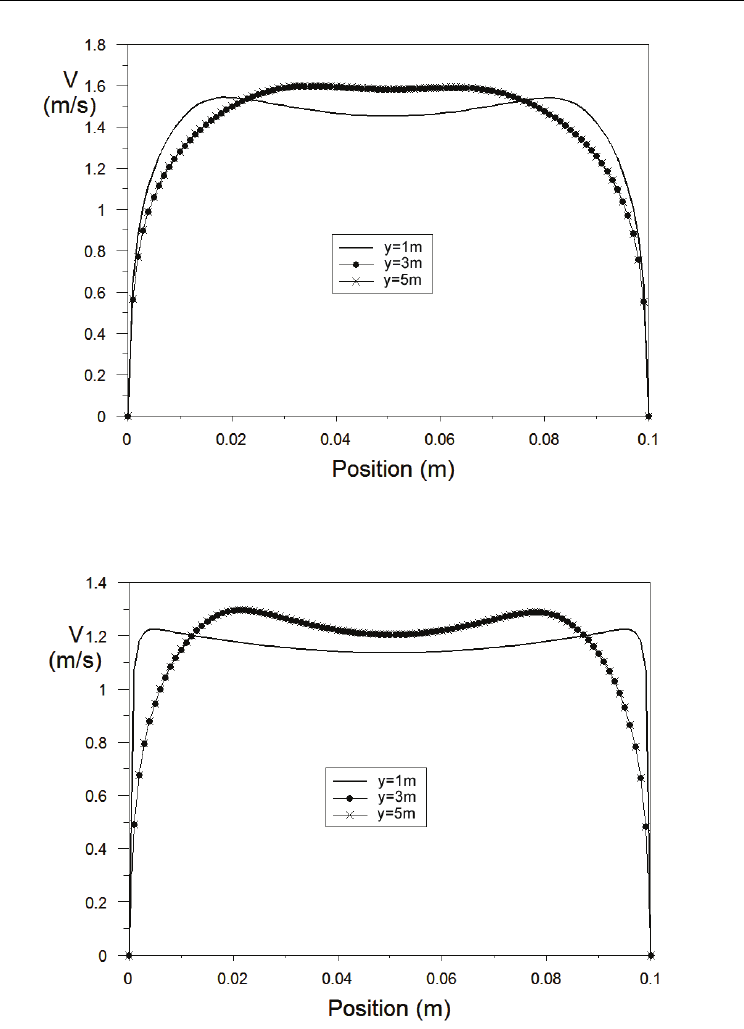
Fig. 11. Facade P3- Velocity profiles (L=6 m, d=0.1 m, Te=301 K, I=400W/m
2
)
Fig. 12. Facade P4- Velocity profiles (L=6 m, d=0.1 m, Te=301 K, I=400W/m
2
)

Computational Fluid Dynamic Simulations of Natural Convection in Ventilated Facades
365
The temperature profiles show an increase of the air temperature inside the cavity along the
direction of the motion. It also possible to observe two temperature boundary layers
developed in correspondence of the two slabs.
The fluid temperature decreases gradually moving away from the two surfaces delimiting
the ventilated cavity and it reaches the value of undisturbed flow outside the thermal
boundary layer.
In the first section of the ventilation duct (1/6 of the total length of the facade), as is possible
to see in the profile obtained for y=1 m, the temperature increases above in the part of the
duct near the two walls, where viscous dissipation is maximum, while the air in the middle
of the channel presents a temperature very close to the entrance value
T
0
.
At a distance from the entrance sufficiently high (3/6 of the total length of the facade), the
air temperature in correspondence of the centerline increases too. From this section the
temperature profile becomes “stable”.
The temperature profiles obtained at the third section of the ventilation duct (5 / 6 of the
total length of the facade) have the same trend as those obtained for the second section, but
with higher overall temperatures.
It is interesting to observe that in the case of the ventilated facade P4, the air flow inside the
duct is heated less than the other two studied facades. In fact, for the facade P4 has been
obtained the lowest value of air temperature inside the duct.
The distributions of velocity observed in the cases of the walls P1,P2 and P4 show the
characteristic trend of internal flows in natural convection.
It is possible to observe the existence of two symmetric boundary layers developed near the
two slabs that delimit the ventilated duct . The fluid velocity is zero in correspondence of
the two walls (condition of adhesion to the wall) and increases with distance from the
surface, until it reaches a maximum value (x = 0.02m) and then decreases again moving
toward the center line (x = 0.05 m).
In the first section of the ventilation duct, as shown by the velocity profiles obtained at the
section located at y = 1 m, the air flow is not yet fully developed and it has a lower average
speed of about 1 m / s for the wall P1, of 1.2 m / s for the walls and P2 and P4 of 1.5 m / s
for the wall P3.
In the case of the wall P3, velocity profiles show a parabolic trend with a maximum speed of
1.6 m/s on the centerline (x = 0.05 m).
7.2 Forced ventilation
In the case of forced convection, the action of an mechanical propeller(one or more low
power fan) that pushes the air inside the double-ventilated, increasing the effects due to
local gradients of density characteristic of simple natural convection , has been simulated by
imposing a speed input v
0.
The other boundary conditions have been imposed coincident with those used to study the
motion of air in case of natural convection.
The following figures (from 13 to 16) show the velocity and temperature profiles obtained
for the ventilated wall P1, for two different values of inlet velocity, respectively, v
0
(1) = 1
m/s and v
0
(2) = 2 m/s.
The temperature profiles (see fig. 13 and 14) show a very flattened trend in the middle of the
channel with two points of maximum in correspondence to the two slabs. The increase of
the velocity v
0
, imposed by the fan, causes both the decrease of the temperature difference
between the two sides of the duct and the decrease of the temperature difference between
the inlet and outlet cross-sections (
T
L
-T
0
). Every way the ventilation heat flux, Q
v
=m
c
p
(T
L
-
T
0
), augment is caused by the increase of the mass air flow.
Evaporation, Condensation and Heat Transfer
366
Fig. 13. Facade P1- Temperature profiles (L=6 m, d=0.1 m, Te=301 K, I=400W/m
2
, v
0
=1 m/s)
Fig. 14. Facade P1- Temperature profiles (L=6 m, d=0.1 m, Te=301 K, I=400W/m
2
, v
0
=2 m/s)
Computational Fluid Dynamic Simulations of Natural Convection in Ventilated Facades
367
Fig. 15. Facade P1- Velocity profiles (L=6 m, d=0.1 m, Te=301 K, I=400W/m
2
, v
0
(1) =1m/s)
Fig. 16. Facade P1- Velocity profiles (L=6 m, d=0.1 m, Te=301 K, I=400W/m
2
, v
0
(1) =2m/s)
Evaporation, Condensation and Heat Transfer
368
The values of temperature inside the channel, T
m
, are less than the ones calculated for lower
inlet velocities, consequently it implies the decrease in the heat flux incoming into the
building expressed by the relation
Q
in
=R
in
(T
m
– T
i
).
Increasing the inlet velocity (see fig. 15 and 16) from 1 m/s to 2 m/s, the velocity profiles
tend to a flattened trend, the airflow feels less the effect of friction and the two boundary
layers become very thin.
The same results have been obtained for the other types of facades object of the study.
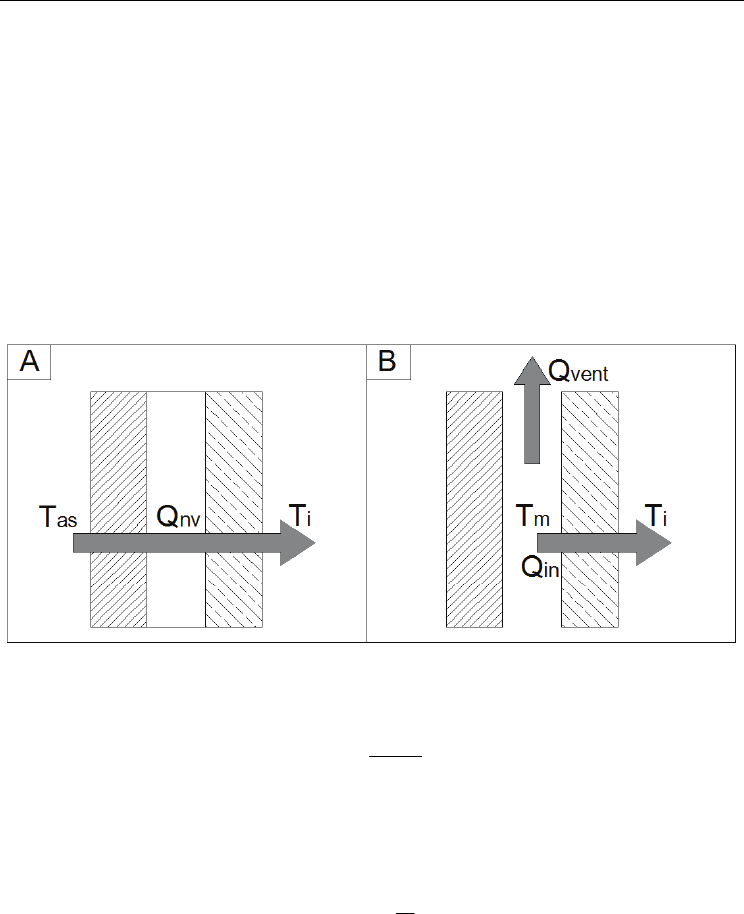
8. Energy performance of ventilated facades
In order to evaluate the benefit that derives from the use of ventilation, have been calculated
heat fluxes entering through ventilated structures, both in presence and absence of
ventilation.
Fig. 17. Heat flux incoming for unventilated(A) and ventilated (B) facade
In the case of lack of ventilation, the incoming heat flux (see fig. 17A) is :
-
as i
nv
nv
TT
Q
R
=
(25)
where
T
as
is the temperature-sun-air defined as: T
as
= T
e
+αI/h
oe
, T
e
is the outdoor air
temperature;
α is the absorption coefficient of the outer face; I is the incident solar radiation
intensity;
R
nv
is the thermal resistance of the unventilated facade defined as:
N
i
nv i e
i
i
s
Rr r
λ
=+ +
∑
(26)
where
r
i
and r
e
are respectively the thermal resistances of the inner and the external
surfaces while
s
i
and λ
i
are the thickness and the thermal conductivity of the i
th
layer (see
table 2).
In the case of ventilated facade (see fig. 17B) the heat flux coming into the room will be
given by the equation: