ACCA P4 Advanced Financial Management - 2010 - Study text - Emile Woolf Publishing
Подождите немного. Документ загружается.

Chapter 4: DCF: risk analysis
© EWP Go to www.emilewoolfpublishing.com for Q/As, Notes & Study Guides 105
Beginner’s guide to normal distribution tables
The features of a normal distribution
A standard normal distribution table
Using a standard normal distribution table
Normal distribution tables and confidence levels
Applications of normal distribution tables in financial management
4 Beginner’s guide to normal distribution tables
When a measurement is taken of a population or a sample of items, we can calculate
an average value for the population or sample.
For example, a business can calculate its average daily sales from a sample of daily
sales figures. The actual sales on any day will usually be above or below the
average, so there is a range of daily sales figures that the average sales figure
represents. Actual daily sales are therefore ‘distributed’ around the average or mean
value. So daily sales might average $2,400, but actual daily sales might be anywhere
in a range of, say, $1,200 to $3,700.
It has been found from experience that the distribution of actual values around the
average is often very close to a normal distribution. A normal distribution is a
distribution that can be defined mathematically, and whose properties are
measurable. If a population of items has a distribution that is similar to a normal
distribution, the distribution can be analysed statistically using normal distribution
tables.
4.1 The features of a normal distribution
A normal distribution is a symmetrical distribution of values around an average
(‘mean’). The distribution of values below the average is mirrored exactly by the
distribution of values above the average.
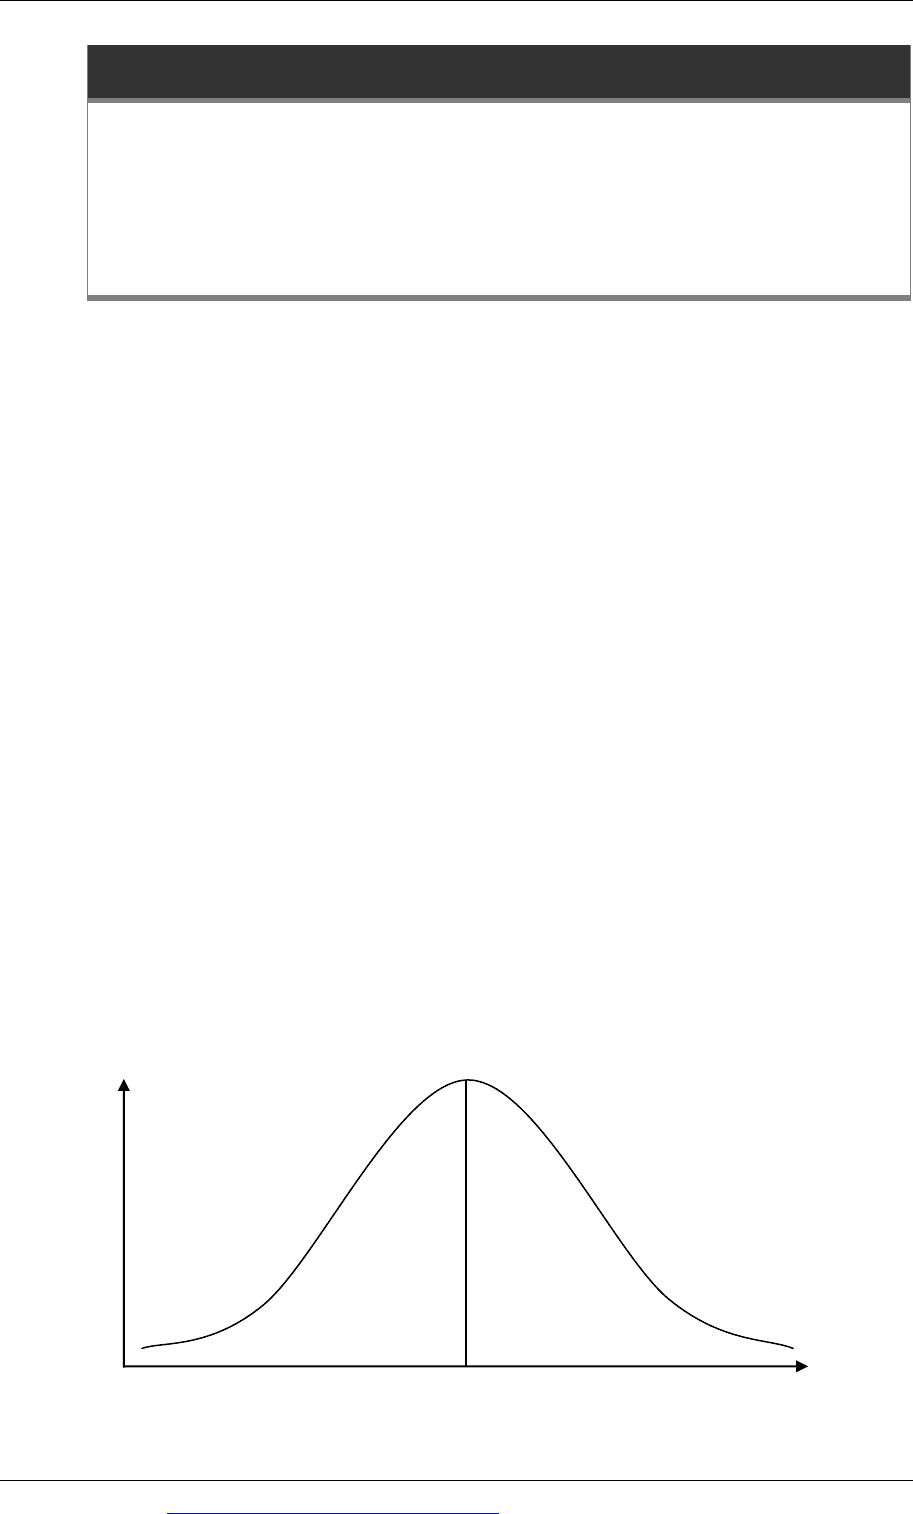
This symmetrical distribution can be drawn as a bell-shaped curve as follows:
Mean
Value
Probability

Paper P4: Advanced Financial Management
106 Go to www.emilewoolfpublishing.com for Q/As, Notes & Study Guides © EWP
This is a graph where the y axis represents probability and the x axis represents the
value of the item being measured (such as daily sales). The total area under the
curve represents 100% of total values.
A normal distribution therefore shows that the most likely actual value is the mean
value, but the actual value can be above or below the mean. Values close to the
mean are more probable (more likely to happen) than values a long way above or
below the mean.
Because of the mathematical properties of a normal distribution, it is possible to
measure the probability of a value being:
above a specified amount
below a specified amount, or
within a specified range of values.
A key statistical feature of a normal distribution is that the probability of a value
being more or less than a specified amount can be measured in terms of standard
deviations above or below the average/mean.
The normal distribution is symmetrical. Because the distribution is symmetrical,
there is a 50% probability that a value will be higher than the average (‘above the
mean’ and a 50% probability that a value will be less than the average (‘below
the mean’).
Because of the mathematical properties of the normal distribution, it is also
possible to predict the probability that a value will be within a given number of
standard deviations above or below the mean. For example:
-
there is a probability of 34.13% that a value will be within a range of one
standard deviation below the mean and the mean
-
there is a probability of 34.13% that a value will be within a range of the
mean and one standard deviation above the mean
-
there is therefore a probability of 68.26% (2 × 34.13%) that a value will be
in a range of one standard deviation below the mean to one standard
deviation above the mean.
For similar reasons we can predict that there is a probability of 15.87% (50% -
34.13%) that a value will be more than one standard deviation below the mean
and there is also a probability of 15.87% that a value will be more than one
standard deviation above the mean.
These probabilities can be obtained from normal distribution tables. A normal
distribution table is provided in the formula sheet in your examination.

Chapter 4: DCF: risk analysis
© EWP Go to www.emilewoolfpublishing.com for Q/As, Notes & Study Guides 107
4.2 A standard normal distribution table
A standard normal distribution table is shown in the introductory pages to this text,
in the pages for the formulae and tables.
The table represents the probabilities in one half of a normal distribution. Since the
normal distribution is symmetrical, the table represents either the half of the
distribution below the mean or the half that is above the mean.
The rows and columns represent the number of standard deviations above or
below the mean.
The figures in the table are the probabilities that a value will be within that
number of standard deviations of the mean.
For example:
The value for 1 standard deviation is in the row 1.0 and the column 0.00. The
value here is 0.3413. This shows that in a normal distribution, there is a
probability of 0.3413 or 34.13% of a value between the mean and 1 standard
deviation below the mean. There is a similar probability of 0.3413 or 34.13% of a
value between the mean and 1 standard deviation above the mean.
The value for 1.25 standard deviations is in the row 1.2 and the column 0.05. The
value in the table is 0.3944. This shows that in a normal distribution, there is a
probability of 0.3944 or 39.44% of a value between the mean and 1 standard
deviation below the mean. There is a similar probability of 0.3944 or 39.44% of a
value between the mean and 1 standard deviation above the mean. This also
means that the probability that a value will be somewhere between 1.25
standard deviations below the mean and 1.25 standard deviations above the
mean is 78.88%.
4.3 Using a standard normal distribution table
For any value whose variability can be approximated by a normal distribution,
normal distribution tables can be used for probability analysis and so for risk
analysis. The following examples show how this can be done:
Example
A simulation model has been used to calculate the expected value of the NPV of a
project. This is + $30,600. The standard deviation of the project is $18,000.
The variability in the NPV approximates to a normal distribution. (This is usual for
the output results from a simulation model.)
(a)
What is the probability that the NPV will be greater than $0?
(b)
What is the probability that the NPV will be greater than $40,000?

Paper P4: Advanced Financial Management
108 Go to www.emilewoolfpublishing.com for Q/As, Notes & Study Guides © EWP
Answer
(a)
An NPV of $0 is below the mean value of $31,950, by $31,950. We need to
convert this into a number of standard deviations, or ‘Z score’.
Z = 31,950/18,000 = 1.775 standard deviations.
The probability that the NPV will be between the mean (the EV of the NPV)
and a value that is 1.775 standard deviations below the mean is between
0.4616 (1.77 standard deviations) and 0.4625 (1.78 standard deviations). Since
1.775 is exactly half-way between 1.77 and 1.78, we can estimate by
interpolation that the probability for 1.775 standard deviations is 0.46205
(0.4616 + (0.4625 – 0.4616) × 50%).
This can be rounded to 0.4620.
The probability that the NPV will be between the mean (the EV of the NPV)
and a value that is 1.775 standard deviations below the mean is therefore
0.4620. The probability that the NPV will be above the mean (the EV of the
NPV) is 0.5000 (50%). The probability that the NPV will be higher than $0 is
therefore 0.9620 or 96.20%.
Probability
NPV between $0 and the EV(mean) 0.4620
Above the mean 0.5000
Above $0 0.9620
(b) An NPV of $40,000 is $8,050 above the mean value of $31,950.
The Z score is 8,050/18,000 = 0.447.
The probability that the NPV will be between the mean value (EV) and 0.447
standard deviations above the mean is somewhere between 0.1700 (0.44
standard deviations) and 0.1736 (0.45 standard deviations). We can estimate
by interpolation that the probability for 0.447 standard deviations is 0.1726
(0.1700 + (0.1736 – 0.1700) × 70%).
The probability that the NPV will be more than 0.447 standard deviations
above the mean is therefore 0.5000 – 0.1726 = 0.3274 or 32.74%.
4.4 Normal distribution tables and confidence levels
A normal distribution table can also be used to establish confidence levels. In risk
analysis, it is usual to assess risk at the 95% confidence level or the 99% confidence
level.
A 95% confidence level means that there is a 95% probability.
A 99% confidence level means that there is a 99% probability.

Chapter 4: DCF: risk analysis
© EWP Go to www.emilewoolfpublishing.com for Q/As, Notes & Study Guides 109
Confidence levels for values within a range
We can use normal distribution tables to calculate, at a given confidence level, that
the value of an item will be within a specified range of values above and below the
mean.
For example, suppose that a simulation model produces results showing that the EV
of the NPV for a project is $125,000 and the standard deviation (project volatility) is
$40,000. We can predict at the 95% confidence level that the NPV of the project will
be within a specified range around the EV.
To establish a 95% confidence level for the range around the NPV, we need to
identify the range of values below the mean that represent 47.5% of total
probabilities and the range of values above the mean that represent 47.5% of total
probabilities (since 2 × 47.5% = 95%).
We therefore need to identify the number of standard deviations from the mean that
cover 47.5% of all probabilities. From the normal distribution table, we can identify
that this is 1.96 standard deviations.
At a 95% confidence level, we can therefore predict that the NPV will be somewhere
in the range between 1.96 standard deviations below the mean and 1.96 standard
deviations above the mean.
Similarly, at a 99% confidence level, we can predict that the NPV will be somewhere
in the range between 2.575 standard deviations below the mean and 2.575 standard
deviations above the mean. (This is because there is a probability of 0.4950 that the
value will be 2.575 standard deviations below the mean and a probability of 0.4950
that the value will be 2.575 standard deviations above the mean.)
Example
A simulation model has been used to calculate the expected value of the NPV of a
project. This is + $150,000. The standard deviation of the project is $55,000.
The variability in the NPV approximates to a normal distribution. (This is usual for
the output results from a simulation model.)
At the 95% confidence level, we can predict that the NPV of the project will be in the
range of 1.96 standard deviations above and below the mean. 1.96 × $55,000 =
$107,800. At the 95% confidence level, we can therefore predict that the NPV will be
somewhere in the range $42,800 to $257,800.
At the 99% confidence level, we can predict that the NPV of the project will be in the
range of 2.57 standard deviations above and below the mean. 2.57 × $55,000 =
$141,350. At the 99% confidence level, we can therefore predict that the NPV will be
somewhere in the range + $8,650 to $291,350.
Paper P4: Advanced Financial Management
110 Go to www.emilewoolfpublishing.com for Q/As, Notes & Study Guides © EWP
Confidence levels for values above or below a specified amount
Confidence levels can also be established to identify the probability that the actual
value will be above or below a specified amount. For example, we can establish at
the 95% or 99% level of confidence that a value will be more than $X or less than $X
(or not more than $X or not less than $X).
With this type of calculation we are looking at only one side of the normal
distribution table (and carrying out a ‘one-tailed test’). This differs from confidence
levels for a range above and below the mean, where we are looking at both sides of
the normal distribution, above and below the mean.
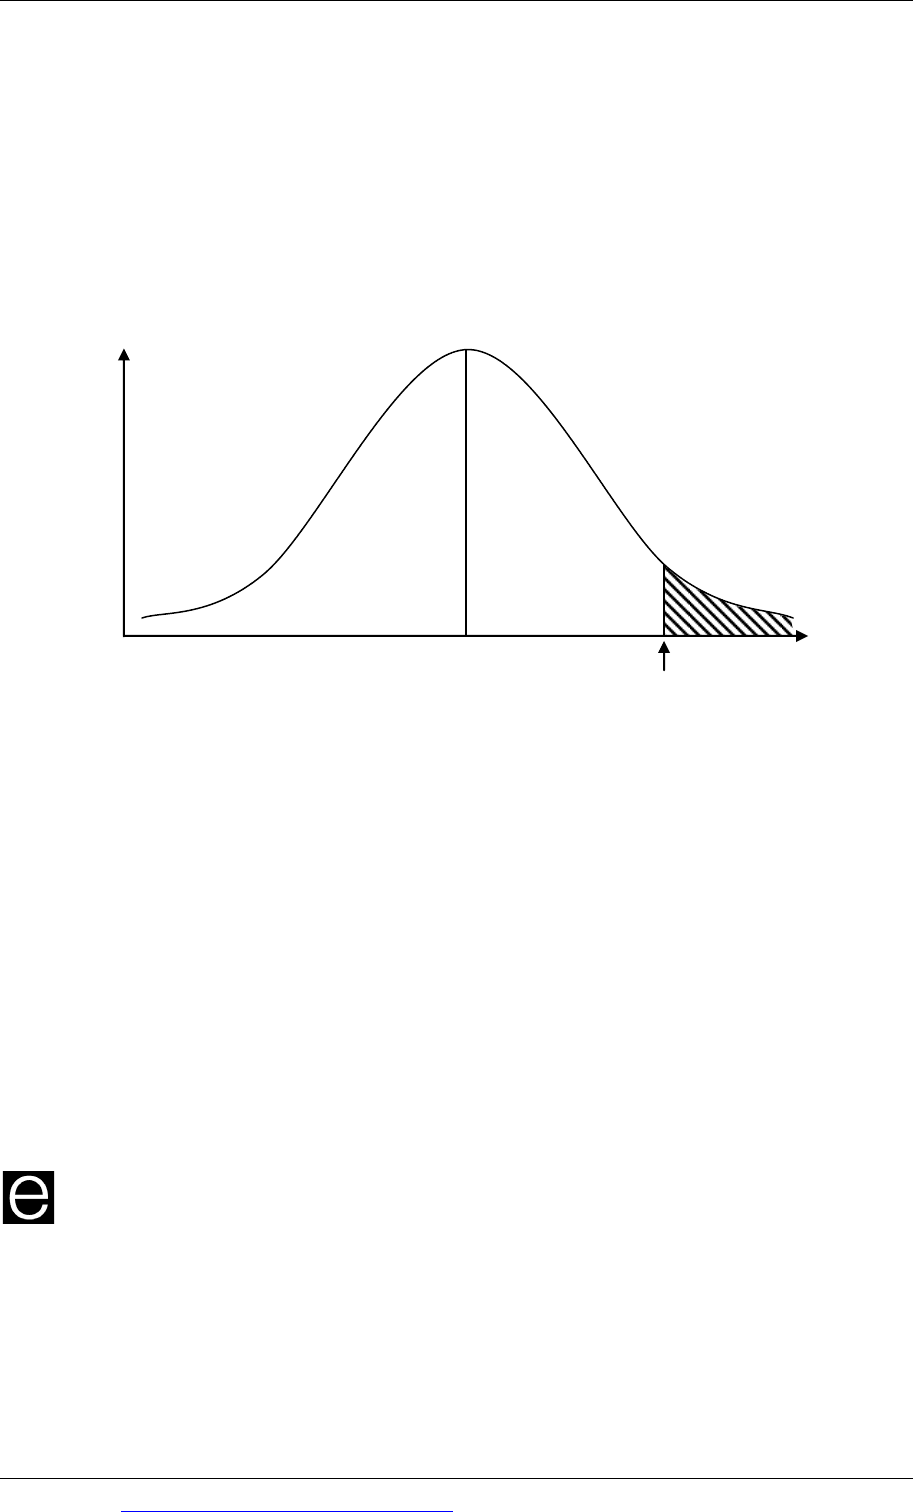
Mean
95%
confidence level
5% probability
The diagram shows that if we want to establish a 95% confidence level for a value
that is above the mean, we need to calculate the number of standard deviations
above the mean for which there is a 45% probability. There is a 50% probability that
the value will be less than the mean, so taken together we have a 95% probability
level.
From the normal distribution table, we can find that 0.4500 of probabilities are
within 1.645 standard deviations of the mean, on one side of the normal distribution
table.
At the 95% level of confidence we can therefore state that the value will be less than
an amount equal to 1.645 standard deviations below the mean. We can also state
that at the 95% confidence level, the value will not exceed an amount that is more
than 1.645 standard deviations above the mean.
Example
A simulation model has been used to calculate the expected value of the NPV of a
project. This is + $70,000. The standard deviation of the project is $28,000.
The variability in the NPV approximates to a normal distribution.

Chapter 4: DCF: risk analysis
© EWP Go to www.emilewoolfpublishing.com for Q/As, Notes & Study Guides 111
At the 95% confidence level, we can therefore predict that the NPV will be not less
than $46,060 (1.645 × $28,000) below the EV of $70,000. This means that at the 95%
confidence level the NPV will be not less than $23,940.
To establish the 99% confidence level, we can establish that 0.4900 of probabilities
are between the men and about 2.33 standard deviations of the mean. At the 99%
confidence level, we can therefore predict that the NPV will be not less than $65,240
(2.33 × $28,000) below the EV of $70,000. This means that at the 99% confidence level
the NPV will be not less than + $4,760.
4.5 Applications of normal distribution tables in financial management
Normal distributions are found in many ‘populations’ and can be used for detailed
statistical analysis of risk. For your examination, the most likely use of normal
distribution tables will be for:
analysing the output from a Monte Carlo simulation model for the purpose of
assessing project risk, or
the valuation of financial options, which is explained in another chapter.

Paper P4: Advanced Financial Management
112 Go to www.emilewoolfpublishing.com for Q/As, Notes & Study Guides © EWP

© EWP Go to www.emilewoolfpublishing.com for Q/As, Notes & Study Guides 113
Paper P4
Advanced Financial Management
CHAPTER
5
Investing: portfolio theory
and the CAPM
Contents
1 Measuring investment risk
2 Portfolio theory
3 Choosing an investment portfolio
4 Capital asset pricing model (CAPM)

Paper P4: Advanced Financial Management
114 Go to www.emilewoolfpublishing.com for Q/As, Notes & Study Guides © EWP
Measuring investment risk
Risk and return in investments
What is investment risk?
Measuring risk as a variance or standard deviation of expected returns
Assessing the investment risk: coefficient of variation
1 Measuring investment risk
1.1 Risk and return in investments
Investors invest in shares and bonds in the expectation of making a return. The
return that they want from any investment could be described as:
a return as reward for providing funds and keeping those funds invested, plus
a return to compensate the investor for the risk.
As a basic rule, an investor will expect a higher return when the investment risk is
higher.
1.2 What is investment risk?
Investors in bonds, investors in shares and companies all face investment risk.
In the case of bonds, the risks for the investor are as follows:
The bond issuer may default, and fail to pay the interest on the bonds, or fail to
repay the principal at maturity.
There may be a change in market rates of interest, including interest yields on
bonds. A change in yields will alter the market value of the bonds. If interest
rates rise, the market value of bonds will fall, and the bond investor will suffer a
loss in the value of his investment.
In the examination, you are often told to assume that debt capital is risk-free. (In
practice, only government debt denominated in the domestic currency of the
government is risk-free).
In the case of equity shares, the risks for the investor are that:
the company might go into liquidation, or
(much more significantly) the company’s profits might fluctuate, and dividends
might also rise or fall from one year to the next.
For investors in equities, the biggest investment risk comes from uncertainty and
change from one year to the next in annual profits and dividends. Changes in
expected profits and dividends will affect the value of the shares.