Wunderlich W. (ed.). Ceramic Materials
Подождите немного. Документ загружается.


Ceramic Materials and Color in Dentistry 173
Holloway, J. & Miller, R.B. (1997). The effect of core translucency on the aesthetics of all-
ceramic restorations. Pract Periodontics Aesthetic Dent, Vol. 9, No. 5, (June/July,
1997) pp. 567-574, ISSN 1042-2722.
Johnston, W.M. & Kao, E.C. (1989). Assessment of appearance match by visual observation
and clinical colorimetry. J Dent Res, Vol. 68, No. 5, (May, 1989) pp. 819-822, ISSN
0022-0345.
Joiner, A. (2004). Tooth colour: a review of the literature. J Dent, Vol. 32, No. 1, (Suplly, 2004)
pp. 3-12, ISSN 0300-5712.
Kelly, J. R. & Denry, I. (2008). Stabilized zirconia as a structural ceramic: An overview. Dent
Mater, Vol. 24, No. 3, (Mar, 2008) pp. 289-98, ISSN 0109-564.
Kelly, J.R.; Nishimura, I. & Campbell, S. D. (1996). Ceramics in dentistry: historical roots and
current perspectives. J Prosthet Dent, Vol 75, No. 1, (Jan 1996) pp. 18-32, ISSN 0022-
3913.
Knispel, G. (1991). Factors affecting the process of color matching restorative materials to
natural teeth. Quintessence Int, Vol. 22, No. 7, (Jul, 1991) pp. 525-531, ISSN 0033-
6572.
Kourtis, S. G.; Tripodakis, A. P. & Doukoudakis, A. A. (2004). Spectrophotometric
evaluation of the optical influence of different metal alloys and porcelains in the
metal-ceramic complex. J Prosthet Dent, Vol. 92, No. 5, (Nov, 2004) pp. 477-485,
ISSN 0022-3913.
Koutayas, S.; Kakaboura, A.; Hussein, A. & Strub, J. (2003). Colorimetric evaluation of the
five different restorative materials on the color of veneered densely sintered
alumina. J Esthetic Rest Dent, Vol. 15, No. 6, (2003) pp. 353-360, ISSN 1496-4155.
Kuehni, R. G. & Marcus, R. T. (1979). An experiment in visual scaling of small color
differences. Color Res Appl, Vol. 4, No. 2, (Summer, 1979) pp. 83-91, ISSN 0361-2317.
Lamas, D. G.; Lascalea, G. E.; Walsoe de Reca, N. E. (1998). Synthesis and characterization of
nanocrystalline powders for partially stabilized zirconia ceramics. J Euro Ceramic
Soc, Vol. 18, No. 9, (1998) pp. 1217-21, ISSN 0955-2219.
Luthardt, R. G.; Holzhüter, M.; Rudolph, H.; Herold,V. & Walter, M. (2004). CAD/CAM
machining effects on Y-TZP zirconia. Dent Mater, Vol. 20, No. 7, (Sep, 2004) pp.
655-62. ISSN 0109-564.
Manicone, P. F.; Iommetti, P. R. & Rafaelli, L. (2007). An overview of zirconia ceramics: basic
properties and clinical applications. J Dent, Vol. 35, No. 11, (Nov, 2007) pp. 819-26,
ISSN 0300-5712.
McLean, J. W. (2001). Evaluation of dental ceramic in the twentieth century. J Prosthet Dent,
Vol. 85, No. 1, (Jan, 2001) pp. 61-66, ISSN 0022-3913.
Miyashita, E.; Mesquita, A.M.M. & Vasconcellos, D.K. (2006). Seleção de cor, In: Atualização
Clínica em Odontologia. Luciano Lauria Dib/Mario Sergio Saddy, Artes Médicas
Ltda, p. 509-526, 1a ed, ISBN 9788527809, São Paulo.
Miyazaki, T.; Hotta, Y.; Kunii, S.; Kuriyama, S. & Tamaki, Y. (2009). A review of dental
CAD/CAM: current status and future perspectives from 20 years of experience.
Dent Mater, Vol. 28, No. 1 (Jan, 2009) pp. 44-56, ISSN 0109-564.
Monsenego, G.; Burdairon, G. & Clerjaud B. (1993). Fluorescence of dental porcelain. J
Prosthetic Dent, Vol. 69, No. 1 (Jan 1993), pp 106-13, ISSN 0022-3913.
Nakamura, T.; Saito, O.; Fuyikawa, J.; Ishigaki, S. (2002). Influence of abutment substrate
and ceramic thickness on the colour of heat-presses ceramic crowns. J Oral Rehabil,
Vol. 29, No. 9, (Sep, 2002) pp. 805-809, ISSN 0305-182X.
O’Brien, W.J.; Groh, C.L.; Boenke, K.M. (1989). A one-dimensional color order system for
dental shade guides. Dent Mater, Vol. 5, No. 6, (Nov, 1989) pp. 371-374, ISSN 0109-
564.
Paravina, R. D. (2002). Evaluation of a newly developed visual sahde-matching apparatus.
Int J Prosthodont, Vol. 15, No. 6, (Nov-Dec, 2002) pp. 528-234, ISSN 0893-2174.
Petter, C. O. & Gliese, R. (2000). Fundamentals in Colorimetry. Ed. UFRGS, Porto Alegre,
Brazil.
Raigrodski, J. (2004). Contemporary materials and technologies for all-ceramic fixed partial
dentures: a review of the literature. J Prosthet Dent, Vol. 92, No. 6 (Dec, 2004) pp.
557-562, ISSN 0022-3913.
Sadowsky, S. J. (2006). An overview of treatment considerations for esthetic restorations: a
review of the literature. J Prosthet Dent, Vol. 96, No. 6, (Dec, 2006) pp. 433-42, ISSN
0022-3913.
Segui, R. R.; Hewlett, E. R.; Kim, J. (1989). Visual and instrumental colorimetric assessments
of small color differences on translucent dental porcelain. J Dent Res, Vol. 68, No.
12, (Dec, 1989) pp. 1760-1764, ISSN
0022-0345.
Sproull, R. C. (2001a). Color matching in dentistry. Part I. The three-dimensional nature of
colour. J Prosthet Dent, Vol. 86, No. 5, (Nov, 2001) pp. 453-457, ISSN 0022-3913.
Sproull, R. C. (2001b). Color matching in dentistry. Part II. Practical applications of the
organization of color. J Prosthet Dent, Vol. 86, No. 5, (Nov, 2001) pp. 458-464, ISSN
0022-3913.
Tadakoro, S. K. & Muccillo, E. N. S. (2002). Synthesis and characterization of nanosized
powders of yttria-doped zirconia. J Alloys Compd, Vol. 344, No. 1-2 (Oct, 2002) pp.
186-89, ISSN 0925-8388.
Vagkopoulou, T.; Koutayas, S.O.; Koidis, P. & Strub, J.R. (2009). Zirconia in Dentistry: Part 1.
Discovering the nature of an upcoming bioceramic. Eur J Esthet Dent, Vol. 4, No. 2,
(Summer, 2009) pp. 130-51, ISSN 1862-0612.
Van Der Burgt, T. P.; Ten Bosch, J. J.; Borsboom, P. C. F.; Kortsmit, W. J. P. M. (1990). A
comparison of new and convencional methods for quantification of tooth color. J
Prosthet Dent, Vol.63, No. 2, (Feb, 1990) pp. 155-162, ISSN 0022-3913.
Vanini, L. (1996). Light and color in anterior composite restorations. Pract Periodontics
Aesthetic Dent, Vol. 8, No. 7 (Sep, 1996) pp. 673-682, ISSN 1042-2722.
Vichi A.; Ferrari, M. & Davidson, C. L. (2000). Influence of ceramic and cement thickness on
the masking of various types of opaque posts. J Prosthet Dent, Vol. 83, No. 4, (April,
2000) pp. 412-17, ISSN 0022-3913.
Volpato, C. A. M.; Monteiro Jr, S.; Andrada, M. A.; Fredel, M. C.; Petter, C. O. (2009). Optical
influence of the type of illuminant, substrates and thickness of ceramic materials.
Dent Mater, Vol. 25, No. 1, (Jan, 2009) pp. 87-93, ISSN 0109-564.
Yang, S. F. et al. (2009). New nansized Al
2
O3 – BN coating 3Y-TPZ ceramics composites for
CAD/CAM – produced all-ceramic dental restorations. Part I. Fabrications of
powders. Nanomedicine J, Vol. 5, No. 2 (Jun, 2009) pp. 232-39, ISSN 1549-9634.

Ceramic Materials 174

Surface quality controls mechanical strength and
fatigue lifetime of dental ceramics and resin composites 175
Surface quality controls mechanical strength and fatigue lifetime of
dental ceramics and resin composites
Ulrich Lohbauer, Roland Frankenberger and Norbert Krämer
X
Surface quality controls mechanical
strength and fatigue lifetime of
dental ceramics and resin composites
Ulrich Lohbauer
1
, Roland Frankenberger
2
and Norbert Krämer
3
1
University of Erlangen, Erlangen, Germany
2
University of Marburg, Marburg, Germany
3
University of Giessen, Giessen, Germany
Summary
Objectives: Surface quality strongly influences the mechanical strength of dental restorative
materials by a specific surface flaw population. Perfect polishing is thus a highly
recommended clinical procedure to ensure maximum mechanical performance. Dental
restorations are commonly exposed to masticatory loads much lower than their short time
fracture strength. Surface microcracks can grow under subcritical fatigue loads
resulting in
premature failure of a restoration.
This study was conducted to discuss the relevant parameters on ceramic strength and
degradation over time. The aim was to correlate surface roughness, fracture strength,
toughness and degradation behavior
by slow crack growth with the results of a prospective
clinical trial. The fracture strength
c
and toughness K
Ic
of a glass ceramic and of a resin
composite have been assessed as a function of surface roughness and related to critical flaw
sizes a
c
, intrinsic microstructure and fractographic findings. The slow crack growth
parameters of the clinically used glass ceramic material have been determined using the
dynamic fatigue method. Based on a naturally inherent flaw population of the specimens, so
called fractureStrength - failureProbability – lifeTime
diagrams (SPT) could be derived. This
allowed for theoretically predicting the lifetime of a ceramic material. The 12-years follow-
up results of a prospective clinical trial have been analyzed according to clinical fractures
and correlated with measured lab data on slow crack growth degradation of strength.
Methods: Rectangular specimens were manufactured using two glass ceramic materials (IPS
Empress (IEM), IPS E.max Press (EMP), IvoclarVivadent, Liechtenstein) and a resin
composite (Tetric EvoCeram (TEC), IvoclarVivadent). Different surface roughness levels
were prepared on EMP and TEC using lab grinding/ polishing techniques and quantified
under a confocal laser scanning microscope (CLSM).
Fracture strength data were determined in four-point bending. Weibull statistics were
applied and the parameters m and
0
were calculated. The Indentation fracture method was
used to calculate fracture toughness for EMP and TEC. Critical flaw sizes were calculated
9

Ceramic Materials 176
and related to the microstructural and fractographic features using a scanning electron
microscope (SEM).
Dynamic fatigue experiments were performed on IEM in water at four decreasing stress
rates from 1.3 to 0.0013 MPas
-1
. The parameters of subcritical crack growth n and A were
calculated. SPT predictions
were derived for 1, 4, 8 and 12 years, based on a static crack
growth mechanism.
A twelve years clinical recall of a prospective clinical trial was performed using the ceramic
restorative material IEM. Bulk, chipping and marginal fractures or detoriations were
observed. Failure rates were calculated according to Kaplan-Meier
survival analysis and
merged into the SPT diagram.
Results: Fracture strength of EMP decreased from 441.4 to 303.3 MPa (R
a
= 150 nm to 1.5 µm)
and of TEC from 109.8 to 74.0 MPa (R
a
=, 300 nm to 50 µm). EMP exhibited a fracture
toughness of K
Ic
= 4.14 MPam
0.5
and TEC of K
Ic
= 1.89 MPam
0.5
. Calculated crack lengths for
EMP ranged from 28.1 µm (441.4 MPa) to 59.6 µm (303.3 MPa) and for TEC from 94.3 µm
(109.8 MPa) to 207.0 µm (74.0 MPa).
The inert fracture strength of IEM was measured to 134 MPa and the Weibull modulus to
m=8.1. The subcritical crack growth parameter n was calculated to n=19.2 and the
extrapolated crack velocity to A= 0.0014 m/s. Based on a clinical relevant failure probability
of P
F
= 5 %, material strength was predicted to decrease from initial
0.05
= 93 MPa down to
0.05
= 33 MPa after 12 years (- 64 %).
The clinical survival rate for the material IEM dropped from 100 % (1 year) to 93 % (4 years),
92 % (8 years) down to 86 % after 12 years. The incidence of inlay defects like chipping and
marginal fractures increased from 1 % at baseline, 7 % after 4 years, 26 % after 8 years to 57
% after 12 years.
Significance: The fracture strength of brittle ceramics is determined by surface roughness. A
proper polishing procedure is thus essential for maximum strength of glass ceramic
materials. Dynamic fatigue experiments showed a dramatic degradation of ceramic strength
over time due to a corrosive growth of small surface microcracks. The strength behavior of
the investigated resin composite is less influenced by surface roughness.
Clinical data followed the in vitro lifetime predictions in terms of dramatically increased
clinical bulk fractures and detoriations from chipping and marginal fractures after twelve
years. The clinically observed survival rate seems to match the in vitro lifetime predictions
with time. A failure level of P
F
= 5% is clinically exceeded after 4 years of clinical service,
which corresponds to an theoretical prediction of maximum static loading of 35.5 MPa.
Since the slow growth
of surface flaws is responsible for fatigue degradation, a perfect
polishing procedure right after placement is strongly recommended to keep an optimum
strength performance during the whole clinical lifetime. Based on the results on the resin
composite, the fatigue lifetime in this case would be expected to be less
influenced by
surface roughness.
1. Introduction
An increasing amount of all-ceramic materials are being used in restorative and prosthetic
dentistry. High demands for aesthetic and biocompatible materials extend the significance
of ceramic restorations. Clinically, the main problem having consequently been reported in
literature, are fractures such as chipping, marginal and bulk fractures (Molin & Karlsson,
2000; Krämer & Frankenberger, 2005). Major goals of dental ceramic developers are thus the
improvement of mechanical properties and reliability through e.g. CAD/CAM processing
or hot pressing techniques (Evans, 1990).
Clinical reports of ceramic inlays report bulk fractures to be still a main failure reason of all
commercially available ceramic inlay systems, however, only a few controlled prospective
clinical studies presented data on clinical long-term performances of different ceramic
systems (Molin & Karlsson, 2000; Krämer & Frankenberger, 2005; Pallesen & van Dijken,
2000; Hayashi et al., 2003; Reiss & Walther, 2000). Although adhesively bonded to tooth
hard tissues, all-ceramic materials suffer from fractures in up to 20 % of clinically assessed
cases (Hayashi et al., 2003). Clinical failures with ceramic inlays and onlays are observed
throughout their clinical lifetime. Extended class-I restorations develop marginal fractures in
the majority of cases, whereas class-II inlays fail predominantly due to bulk fractures (Molin
& Karlsson, 2000). Among the high strength prosthetic restorations, prospective clinical
studies using zirconia supported fixed partial dentures (FPDs) reported promising results
for an observation time of two to five years (Raigrodski et al., 2006; Tinschert et al., 2008;
Sailer et al., 2007; Molin and Karlsson, 2008; Beuer et al., 2009). However, several authors
reported up to 15% of minor chipping of the veneering ceramic. Minor clinical failures
are
thereby due to zirconia framework fractures but to chipping failures within the veneering
ceramic.
Ceramic strength in general is limited by the size and distribution of an inherent flaw
population. Fracture of brittle ceramics occur without measurable plastic deformation,
which is due to the stable atomic bonds
of ceramics. In consequence, failure can start from
small flaws prior to plastic deformation. This fact is expressed by a low resistance against
crack extension, that
is characterized by the parameter fracture toughness K
Ic
(Munz & Fett,
1999). Various approaches have been used to determine the effect of flaws on strength
(Davidge & Evans, 1970). Griffith postulated for plane stress conditions an inverse square
root relationship between fracture strength
c
and critical flaw size a
c
(Griffith, 1920):
0
1
2
Ic
c t
c
K
a
(1)
Brittle fracture will occur when the stress intensity K
I
at a crack of length a
c
exceeds the
critical stress intensity factor, i.e. K
I
≥ K
Ic
.
One simple method to increase
ceramic strength is an accurate surface polishing procedure.
Polishing leads to reduction of surface flaw sizes a
c
and thus to increased mechanical
strength
c
, as can be seen from eq. 1 (O’Brien, 2002). Intraoral adjustment of a restoration
surface after placement induces deep flaws and requires proper polishing especially in load
bearing areas and in deep fissures. Also, intensive research is focused on surface polishing
of resin composites. A smooth surface is desirable due to optimal biocompatibility
(Watanabe et al., 2006). Proper polishing of restorations minimizes possible gingival
irritation, surface staining, plaque accumulation, and secondary caries (Venturini et al.,
2006). In literature, no indication is provided that proper polishing substantially influences
resin composite strength as it is
reported for brittle ceramics.

Surface quality controls mechanical strength and
fatigue lifetime of dental ceramics and resin composites 177
and related to the microstructural and fractographic features using a scanning electron
microscope (SEM).
Dynamic fatigue experiments were performed on IEM in water at four decreasing stress
rates from 1.3 to 0.0013 MPas
-1
. The parameters of subcritical crack growth n and A were
calculated. SPT predictions
were derived for 1, 4, 8 and 12 years, based on a static crack
growth mechanism.
A twelve years clinical recall of a prospective clinical trial was performed using the ceramic
restorative material IEM. Bulk, chipping and marginal fractures or detoriations were
observed. Failure rates were calculated according to Kaplan-Meier
survival analysis and
merged into the SPT diagram.
Results: Fracture strength of EMP decreased from 441.4 to 303.3 MPa (R
a
= 150 nm to 1.5 µm)
and of TEC from 109.8 to 74.0 MPa (R
a
=, 300 nm to 50 µm). EMP exhibited a fracture
toughness of K
Ic
= 4.14 MPam
0.5
and TEC of K
Ic
= 1.89 MPam
0.5
. Calculated crack lengths for
EMP ranged from 28.1 µm (441.4 MPa) to 59.6 µm (303.3 MPa) and for TEC from 94.3 µm
(109.8 MPa) to 207.0 µm (74.0 MPa).
The inert fracture strength of IEM was measured to 134 MPa and the Weibull modulus to
m=8.1. The subcritical crack growth parameter n was calculated to n=19.2 and the
extrapolated crack velocity to A= 0.0014 m/s. Based on a clinical relevant failure probability
of P
F
= 5 %, material strength was predicted to decrease from initial
0.05
= 93 MPa down to
0.05
= 33 MPa after 12 years (- 64 %).
The clinical survival rate for the material IEM dropped from 100 % (1 year) to 93 % (4 years),
92 % (8 years) down to 86 % after 12 years. The incidence of inlay defects like chipping and
marginal fractures increased from 1 % at baseline, 7 % after 4 years, 26 % after 8 years to 57
% after 12 years.
Significance: The fracture strength of brittle ceramics is determined by surface roughness. A
proper polishing procedure is thus essential for maximum strength of glass ceramic
materials. Dynamic fatigue experiments showed a dramatic degradation of ceramic strength
over time due to a corrosive growth of small surface microcracks. The strength behavior of
the investigated resin composite is less influenced by surface roughness.
Clinical data followed the in vitro lifetime predictions in terms of dramatically increased
clinical bulk fractures and detoriations from chipping and marginal fractures after twelve
years. The clinically observed survival rate seems to match the in vitro lifetime predictions
with time. A failure level of P
F
= 5% is clinically exceeded after 4 years of clinical service,
which corresponds to an theoretical prediction of maximum static loading of 35.5 MPa.
Since the slow growth
of surface flaws is responsible for fatigue degradation, a perfect
polishing procedure right after placement is strongly recommended to keep an optimum
strength performance during the whole clinical lifetime. Based on the results on the resin
composite, the fatigue lifetime in this case would be expected to be less
influenced by
surface roughness.
1. Introduction
An increasing amount of all-ceramic materials are being used in restorative and prosthetic
dentistry. High demands for aesthetic and biocompatible materials extend the significance
of ceramic restorations. Clinically, the main problem having consequently been reported in
literature, are fractures such as chipping, marginal and bulk fractures (Molin & Karlsson,
2000; Krämer & Frankenberger, 2005). Major goals of dental ceramic developers are thus the
improvement of mechanical properties and reliability through e.g. CAD/CAM processing
or hot pressing techniques (Evans, 1990).
Clinical reports of ceramic inlays report bulk fractures to be still a main failure reason of all
commercially available ceramic inlay systems, however, only a few controlled prospective
clinical studies presented data on clinical long-term performances of different ceramic
systems (Molin & Karlsson, 2000; Krämer & Frankenberger, 2005; Pallesen & van Dijken,
2000; Hayashi et al., 2003; Reiss & Walther, 2000). Although adhesively bonded to tooth
hard tissues, all-ceramic materials suffer from fractures in up to 20 % of clinically assessed
cases (Hayashi et al., 2003). Clinical failures with ceramic inlays and onlays are observed
throughout their clinical lifetime. Extended class-I restorations develop marginal fractures in
the majority of cases, whereas class-II inlays fail predominantly due to bulk fractures (Molin
& Karlsson, 2000). Among the high strength prosthetic restorations, prospective clinical
studies using zirconia supported fixed partial dentures (FPDs) reported promising results
for an observation time of two to five years (Raigrodski et al., 2006; Tinschert et al., 2008;
Sailer et al., 2007; Molin and Karlsson, 2008; Beuer et al., 2009). However, several authors
reported up to 15% of minor chipping of the veneering ceramic. Minor clinical failures
are
thereby due to zirconia framework fractures but to chipping failures within the veneering
ceramic.
Ceramic strength in general is limited by the size and distribution of an inherent flaw
population. Fracture of brittle ceramics occur without measurable plastic deformation,
which is due to the stable atomic bonds
of ceramics. In consequence, failure can start from
small flaws prior to plastic deformation. This fact is expressed by a low resistance against
crack extension, that
is characterized by the parameter fracture toughness K
Ic
(Munz & Fett,
1999). Various approaches have been used to determine the effect of flaws on strength
(Davidge & Evans, 1970). Griffith postulated for plane stress conditions an inverse square
root relationship between fracture strength
c
and critical flaw size a
c
(Griffith, 1920):
0
1
2
Ic
c t
c
K
a
(1)
Brittle fracture will occur when the stress intensity K
I
at a crack of length a
c
exceeds the
critical stress intensity factor, i.e. K
I
≥ K
Ic
.
One simple method to increase
ceramic strength is an accurate surface polishing procedure.
Polishing leads to reduction of surface flaw sizes a
c
and thus to increased mechanical
strength
c
, as can be seen from eq. 1 (O’Brien, 2002). Intraoral adjustment of a restoration
surface after placement induces deep flaws and requires proper polishing especially in load
bearing areas and in deep fissures. Also, intensive research is focused on surface polishing
of resin composites. A smooth surface is desirable due to optimal biocompatibility
(Watanabe et al., 2006). Proper polishing of restorations minimizes possible gingival
irritation, surface staining, plaque accumulation, and secondary caries (Venturini et al.,
2006). In literature, no indication is provided that proper polishing substantially influences
resin composite strength as it is
reported for brittle ceramics.
Ceramic Materials 178
On the long term however, a corrosive degradation and a slow crack growth (SCG)
mechanism is reducing the initial fracture strength of a ceramic material (Lohbauer et al.,
2002). Numerous studies have shown that catastrophic failure may occur far below the
short-time fracture strength due to a slow growth of a subcritical crack up to the critical
crack length a
c
(Fairhurst et al., 1993; Ritchie & Dauskardt, 1991). Thus, degradation of
strength is measured during a period of lifetime (Mecholsky, 1995). Similar characteristics
for the fatigue performance of dental ceramics under the special focus of oral environment
and loading was observed (Morena et al., 1986). SCG kinetics are strongly influenced by the
amount and composition of a glass phase in the ceramic microstructure (Wiederhorn, 1967).
The deleterious effect of slow crack propagation may be attributed to the stress-enhanced
chemical reaction occurring in the presence of water vapour at a crack tip. This occurs
preferentially in silicate base glasses resulting in bond rupture (Charles, 1958). Even
moisture levels of 0.017 % relative humidity cause stress corrosion (Wiederhorn, 1967).
(2)
Fracture resistance of resin composites is discussed controversially in literature. There is the
treatment of resin composites as brittle materials, applying linear elastic fracture theory and
measuring related material properties such as SCG parameters or fracture toughness
(Marshall & Cox, 1985; Fujishima & Ferracane, 1996; Shin & Drummond, 1999). On the other
hand, dental composites exhibit plastic and viscoelastic effects or a viscoplastic
susceptibility for creep and recovery (El Hejazi & Watts, 1999; Vaidyanathan &
Vaidyanathan, 2001; DeGroot et al., 1988). However, in the vicinity of a sharp surface crack
tip, blunting occurs by plastic deformation, which reduces the local stress at the crack tip,
resulting in cleavage rather than brittle rupture of the atomic bonds (Ashby & Jones, 1996).
The brittle response (or respectively the ductility) of a resin composite is depending on
variables such as loading rate, temperature and filler loading. Fillers are reported to increase
fracture toughness due to microcracking at the crack front or crack bridging mechanisms by
second phase particles e.g. filler particles (Evans, 1990). Temperature increase, even far
below the glass transition temperature will contribute to a rather ductile material behavior
and fast fracture is reported to suppress creep and recovery phenomena (Ashby & Jones,
1996). Fatigue measurements in resin composites postulate a different material response
comparing fast fracture with cyclic fatigue (Lohbauer et al., 2003).
This study was performed to discuss influencing parameters on ceramic strength and
degradation over time. The aim was to correlate surface roughness, fracture strength,
toughness and degradation behavior
by slow crack growth with the results of a prospective
clinical study. The fracture strength
c
and toughness K
Ic
of a glass ceramic and of a resin
composite have been assessed as a function of surface roughness and related to critical flaw
sizes a
c
, intrinsic microstructure and fractographic findings. A long-term prospective clinical
study has been performed in our academic environment. Recently, the 12-years follow-up
results have been reported (Frankenberger et al., 2008). Based on this glass ceramic material,
one aim of this study was to correlate the long-term clinical outcome with measured lab
Si
O
+
H
2
O
Si
Si
O H HO
Si
data on slow crack growth degradation of strength. The SCG parameters of this glass
ceramic material have been determined using the dynamic fatigue method (Munz & Fett,
1999). Based on a naturally inherent flaw population of the specimens, so called
fractureStrength - failureProbability – lifetime
diagrams (SPT) could be derived from the
crack growth measurements (Sudreau et al., 1994). This allowed for theoretically predicting
the lifetime of a ceramic restoration related to an underlying crack growth mechanisms. SPT
diagrams have been derived as a predictive tool for clinical reliability.
Materials and Methods
Materials
Two glass ceramic materials and one resin composite have been assessed in this study.
The clinical study as well as the evaluation of the subcritical crack growth parameters was
based on an identical batch of the leucite reinforced glass ceramic system IPS Empress
®
(IEM, IvoclarVivadent, Schaan, Liechtenstein).
Surface roughness related fracture strength experiments have been performed using the
lithiumdisilicate glass ceramic IPS E.max
®
Press (EMP, IvoclarVivadent) and the direct resin
composite Tetric
®
EvoCeram (TEC, IvoclarVivadent).
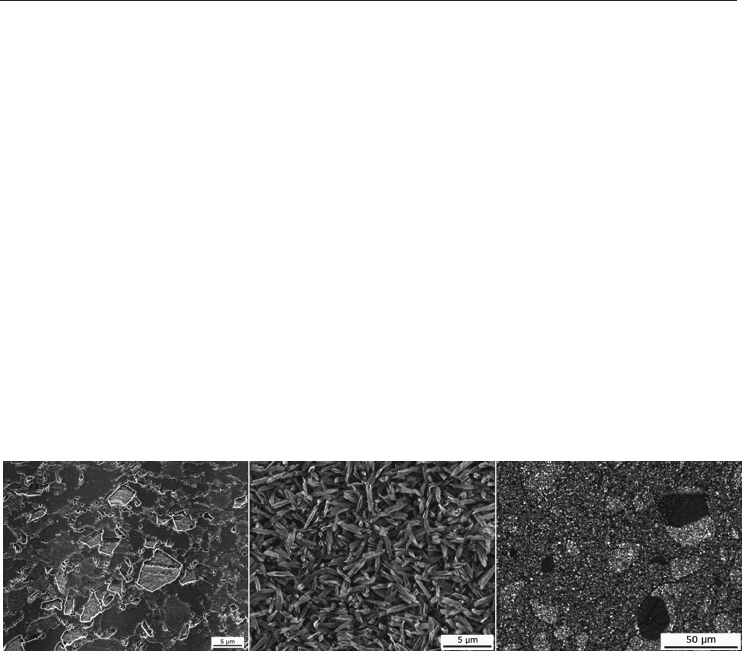
Fig. 1. Microstructure of the investigated materials: a) Leucite reinforced glass ceramic IEM;
b) Lithiumdisilicate crystallite habit and size in EMP; c) Filler particle size and distribution
of the inhomogenous microfiller TEC exhibiting prepolymeric fillers.
The glass ceramic IEM consisted of a silica based glass fraction of approx. 60 vol % out of the
system K
2
0 - Al
2
O
3
- SiO
2
. Leucite [K
2
0 Al
2
O
3
4 SiO
2
] was the major crystalline phase ( 40 vol
%) exhibiting a mean crystallite size of 1 - 3 µm, as shown in Fig 1a (Höland et al., 2000).
EMP mainly consisted of 70 wt % crystalline Li
2
Si
2
O
5
phase of 3 – 6 µm in length (Fig 1b).
Beside that a small amount of Li
3
PO
4
(lithiumorthophosphate) crystals is embedded in the
glassy matrix. EMP is used as a supporting structure and will clinically be veneered with a
silicate based feldspathic porcelain. A core material has been selected since the influence of
surface defects on the strength performance of veneering porcelains is well understood and
since slow crack growth influences are even reduced in high crystalline lithium disilicate
structures (Höland et al., 2000). TEC as an inhomogenous microfiller hybridcomposite
consists of a dimethacrylic matrix system and 48.5 wt % microfiller hybrids with mean
particle sizes of 160 nm to 0.4 and 0.7 µm. Further 34 wt % of prepolymeric fillers are added.
Those fillers consist of a pre-polymerized and re-grinded
resin composite material and
exhibit a mean grain size of approx. 20 - 50 µm. The microstructure is displayed in Fig 1c.
Surface quality controls mechanical strength and
fatigue lifetime of dental ceramics and resin composites 179
On the long term however, a corrosive degradation and a slow crack growth (SCG)
mechanism is reducing the initial fracture strength of a ceramic material (Lohbauer et al.,
2002). Numerous studies have shown that catastrophic failure may occur far below the
short-time fracture strength due to a slow growth of a subcritical crack up to the critical
crack length a
c
(Fairhurst et al., 1993; Ritchie & Dauskardt, 1991). Thus, degradation of
strength is measured during a period of lifetime (Mecholsky, 1995). Similar characteristics
for the fatigue performance of dental ceramics under the special focus of oral environment
and loading was observed (Morena et al., 1986). SCG kinetics are strongly influenced by the
amount and composition of a glass phase in the ceramic microstructure (Wiederhorn, 1967).
The deleterious effect of slow crack propagation may be attributed to the stress-enhanced
chemical reaction occurring in the presence of water vapour at a crack tip. This occurs
preferentially in silicate base glasses resulting in bond rupture (Charles, 1958). Even
moisture levels of 0.017 % relative humidity cause stress corrosion (Wiederhorn, 1967).
(2)
Fracture resistance of resin composites is discussed controversially in literature. There is the
treatment of resin composites as brittle materials, applying linear elastic fracture theory and
measuring related material properties such as SCG parameters or fracture toughness
(Marshall & Cox, 1985; Fujishima & Ferracane, 1996; Shin & Drummond, 1999). On the other
hand, dental composites exhibit plastic and viscoelastic effects or a viscoplastic
susceptibility for creep and recovery (El Hejazi & Watts, 1999; Vaidyanathan &
Vaidyanathan, 2001; DeGroot et al., 1988). However, in the vicinity of a sharp surface crack
tip, blunting occurs by plastic deformation, which reduces the local stress at the crack tip,
resulting in cleavage rather than brittle rupture of the atomic bonds (Ashby & Jones, 1996).
The brittle response (or respectively the ductility) of a resin composite is depending on
variables such as loading rate, temperature and filler loading. Fillers are reported to increase
fracture toughness due to microcracking at the crack front or crack bridging mechanisms by
second phase particles e.g. filler particles (Evans, 1990). Temperature increase, even far
below the glass transition temperature will contribute to a rather ductile material behavior
and fast fracture is reported to suppress creep and recovery phenomena (Ashby & Jones,
1996). Fatigue measurements in resin composites postulate a different material response
comparing fast fracture with cyclic fatigue (Lohbauer et al., 2003).
This study was performed to discuss influencing parameters on ceramic strength and
degradation over time. The aim was to correlate surface roughness, fracture strength,
toughness and degradation behavior
by slow crack growth with the results of a prospective
clinical study. The fracture strength
c
and toughness K
Ic
of a glass ceramic and of a resin
composite have been assessed as a function of surface roughness and related to critical flaw
sizes a
c
, intrinsic microstructure and fractographic findings. A long-term prospective clinical
study has been performed in our academic environment. Recently, the 12-years follow-up
results have been reported (Frankenberger et al., 2008). Based on this glass ceramic material,
one aim of this study was to correlate the long-term clinical outcome with measured lab
Si
O
+
H
2
O
Si
Si
O H HO
Si
data on slow crack growth degradation of strength. The SCG parameters of this glass
ceramic material have been determined using the dynamic fatigue method (Munz & Fett,
1999). Based on a naturally inherent flaw population of the specimens, so called
fractureStrength - failureProbability – lifetime
diagrams (SPT) could be derived from the
crack growth measurements (Sudreau et al., 1994). This allowed for theoretically predicting
the lifetime of a ceramic restoration related to an underlying crack growth mechanisms. SPT
diagrams have been derived as a predictive tool for clinical reliability.
Materials and Methods
Materials
Two glass ceramic materials and one resin composite have been assessed in this study.
The clinical study as well as the evaluation of the subcritical crack growth parameters was
based on an identical batch of the leucite reinforced glass ceramic system IPS Empress
®
(IEM, IvoclarVivadent, Schaan, Liechtenstein).
Surface roughness related fracture strength experiments have been performed using the
lithiumdisilicate glass ceramic IPS E.max
®
Press (EMP, IvoclarVivadent) and the direct resin
composite Tetric
®
EvoCeram (TEC, IvoclarVivadent).
Fig. 1. Microstructure of the investigated materials: a) Leucite reinforced glass ceramic IEM;
b) Lithiumdisilicate crystallite habit and size in EMP; c) Filler particle size and distribution
of the inhomogenous microfiller TEC exhibiting prepolymeric fillers.
The glass ceramic IEM consisted of a silica based glass fraction of approx. 60 vol % out of the
system K
2
0 - Al
2
O
3
- SiO
2
. Leucite [K
2
0 Al
2
O
3
4 SiO
2
] was the major crystalline phase ( 40 vol
%) exhibiting a mean crystallite size of 1 - 3 µm, as shown in Fig 1a (Höland et al., 2000).
EMP mainly consisted of 70 wt % crystalline Li
2
Si
2
O
5
phase of 3 – 6 µm in length (Fig 1b).
Beside that a small amount of Li
3
PO
4
(lithiumorthophosphate) crystals is embedded in the
glassy matrix. EMP is used as a supporting structure and will clinically be veneered with a
silicate based feldspathic porcelain. A core material has been selected since the influence of
surface defects on the strength performance of veneering porcelains is well understood and
since slow crack growth influences are even reduced in high crystalline lithium disilicate
structures (Höland et al., 2000). TEC as an inhomogenous microfiller hybridcomposite
consists of a dimethacrylic matrix system and 48.5 wt % microfiller hybrids with mean
particle sizes of 160 nm to 0.4 and 0.7 µm. Further 34 wt % of prepolymeric fillers are added.
Those fillers consist of a pre-polymerized and re-grinded
resin composite material and
exhibit a mean grain size of approx. 20 - 50 µm. The microstructure is displayed in Fig 1c.

Ceramic Materials 180
This material has been selected due to the extended filler size distribution which in turn
should have an influence on strength versus surface defect performance.
Experimental procedure
For the clinical study the material (IEM) was processed by one dental ceramist according to
the manufacturer’s instructions for use (IFU) (Krämer & Frankenberger, 2005).
Surface
treatment
Mean roughness EMP TEC
R
a
[µm]
0
[MPa]
m a
c
[µm]
0
[MPa]
m a
c
[µm]
untreated 0.429 ± 0.04 - - 109.8
c
12.5 94.3
polished 0.214 ± 0.01 441.4
a
13.3 28.1 - - -
4000 grit 0.150 ± 0.02 438.3
a
4.8 28.5 - - -
4000 grit 0.310 ± 0.09 - - - 104.4
c
11.3 104.3
1000 grit 0.646 ± 0.02 370.5
a,b
7.2 39.9 - - -
800 grit 0.835 ± 0.13 - - - 109.3
c
14.6 95.2
500 grit 1.131 ± 0.89 - - - 103.8
c
10.9 105.5
320 grit 1.509 ± 0.15 303.3
b
10.0 59.6 - - -
320 grit 2.075 ± 0.34 - - - 96.9
c
16.5 121.1
120 grit 4.221 ± 1.11 - - - 88.7
d
12.8 144.5
cutting 25.0 ± 4.05 - - - 85.6
d
13.5 155.2
cutting 50.0 ± 6.87 - - - 74.0
d
15.2 207.6
Statistical homogenous subgroups are labelled with superscript letters (p < 0.05).
Table 1. Weibull parameters
0
and m and the estimated fracture releasing crack length a
c
according to the applied surface roughness R
a
.
Regarding the lab experiments, IEM and EMP specimens were hot pressed to a final
geometry of 25 x 2.5 x 2 mm applying the manufacturer recommended procedure and
according to the ISO 6872 standard. TEC specimens with the dimension 25 x 2 x 2 mm were
produced using a metal /glass mold and light-curing on five overlapping spots of 8 mm
diameter. The upper and lower side of the bar were cured with a commercial halogen light
curing unit (Elipar
®
Trilight (750 mW/ cm²), 3M ESPE, Germany). The illumination time on
a single spot was 20 seconds. The procedure followed the manufacturer’s IFU and ISO 4049
standard.
All specimen surfaces were grinded under permanent water cooling with silicon carbide
paper according to Table 1. The specimen flanges were grinded
under an angle of 45° with
the specific roughness to prevent fracture releasing stress concentrations. For polishing the
samples a 0.25 µm polishing paste was used. The two groups exhibiting an extremely deep
roughness of 25 and 50 µm, were treated by a standardized surface cutting technique with a
bur. Respective data for surface roughness were determined under a CLSM in reflectance
mode ((TCS SL, Leica, Bensheim, Germany). The confocal z-sections were taken at every 1.6
µm under 1000 fold magnification (HC PL Fluotar 100, NA = 0.9).
All specimens were stored dark and dry for 24 h at 37 °C prior to fracture testing. To
evaluate the specific flexural strength and SCG parameters, the four-point-bending test was
used. The bars were fixed between four fins ( = 2 mm, distance of inner/ outer fins: 10/ 20
mm) and were subsequently loaded until fracture with a crosshead speed of 0.75 mm/ min
in an universal testing machine (Z 2.5, Zwick, Germany).
Prospective clinical study design and follow-up
Patients’ selection for the clinical study was based on criteria such as a high level of dental
hygiene, absence of pain from the tooth to be restored or further restorations planned in the
posterior region. 96 inlays (77 %) and onlays (23 %) were placed in 34 patients by six
dentists. Whether two surface (n = 45) or three surface (n = 27) restorations exhibited
proximal margins below the cementoenamel junction (CEJ). 57 molar and 39 premolar
restorations were bonded with a four-step selective-etch adhesive system (Syntac
®
Classic,
IvoclarVivadent), inserted using four different resin composites and light cured for a total of
120 s. The average ceramic dimensions measured prior to insertion have been 1.4 mm below
the deepest fissure, 3.5 mm buccal-lingually at the isthmus, and 1.8 mm below reconstructed
cusps of onlays. Occlusal contacts were adjusted using finishing burs (Intensiv, Viganello-
Lugano, Switzerland) prior to SofLex discs (3MESPE, St. Pauls, MN, USA). Polishing was
conducted using felt discs with a polishing gel (Dia-Finish E Filzscheiben & Brinell, Renfert,
Hilzingen, Germany).
The restorations were assessed after placement by two calibrated investigators using
modified USPHS codes and criteria (major criteria: surface roughness, marginal integrity,
tooth integrity, inlay integrity) at the following time periods: baseline, 1, 2, 4, 6, 8, 10 and 12
years. The study was conducted according to EN 540. For specific details and clinical
procedure refer to (Krämer & Frankenberger, 2005).
Median survival times have been calculated according to Kaplan-Meier survival analysis.
The statistics applied here represent failure rates that correspond to the experimental failure
probability P
F
since most clinical restorations failed due to fracture. To receive information
on fracture releasing clinical loads, those Kaplan-Meier survival times were merged into the
experimental SPT lifetime prediction. Experimental lifetime regression lines for 1, 4, 8 and 12
years were calculated to meet the clinical follow-up periods. Clinical incidence of failures as
well as of defects were located on the corresponding regression line. This experimental
approach might allow for an extrapolation on clinically fracture releasing stress levels.
Fracture strength, slow crack growth and lifetime
According to the assumption of weakest link, the fracture strength of brittle materials is
limited by the largest crack in the loaded volume. Hence, a distribution of crack lengths
results in a strength distribution which is commonly described by fracture probability P
F
c)
0
1 exp
m
c
F
P
(3)

Surface quality controls mechanical strength and
fatigue lifetime of dental ceramics and resin composites 181
This material has been selected due to the extended filler size distribution which in turn
should have an influence on strength versus surface defect performance.
Experimental procedure
For the clinical study the material (IEM) was processed by one dental ceramist according to
the manufacturer’s instructions for use (IFU) (Krämer & Frankenberger, 2005).
Surface
treatment
Mean roughness EMP TEC
R
a
[µm]
0
[MPa]
m a
c
[µm]
0
[MPa]
m a
c
[µm]
untreated 0.429 ± 0.04 - - 109.8
c
12.5 94.3
polished 0.214 ± 0.01 441.4
a
13.3 28.1 - - -
4000 grit 0.150 ± 0.02 438.3
a
4.8 28.5 - - -
4000 grit 0.310 ± 0.09 - - - 104.4
c
11.3 104.3
1000 grit 0.646 ± 0.02 370.5
a,b
7.2 39.9 - - -
800 grit 0.835 ± 0.13 - - - 109.3
c
14.6 95.2
500 grit 1.131 ± 0.89 - - - 103.8
c
10.9 105.5
320 grit 1.509 ± 0.15 303.3
b
10.0 59.6 - - -
320 grit 2.075 ± 0.34 - - - 96.9
c
16.5 121.1
120 grit 4.221 ± 1.11 - - - 88.7
d
12.8 144.5
cutting 25.0 ± 4.05 - - - 85.6
d
13.5 155.2
cutting 50.0 ± 6.87 - - - 74.0
d
15.2 207.6
Statistical homogenous subgroups are labelled with superscript letters (p < 0.05).
Table 1. Weibull parameters
0
and m and the estimated fracture releasing crack length a
c
according to the applied surface roughness R
a
.
Regarding the lab experiments, IEM and EMP specimens were hot pressed to a final
geometry of 25 x 2.5 x 2 mm applying the manufacturer recommended procedure and
according to the ISO 6872 standard. TEC specimens with the dimension 25 x 2 x 2 mm were
produced using a metal /glass mold and light-curing on five overlapping spots of 8 mm
diameter. The upper and lower side of the bar were cured with a commercial halogen light
curing unit (Elipar
®
Trilight (750 mW/ cm²), 3M ESPE, Germany). The illumination time on
a single spot was 20 seconds. The procedure followed the manufacturer’s IFU and ISO 4049
standard.
All specimen surfaces were grinded under permanent water cooling with silicon carbide
paper according to Table 1. The specimen flanges were grinded
under an angle of 45° with
the specific roughness to prevent fracture releasing stress concentrations. For polishing the
samples a 0.25 µm polishing paste was used. The two groups exhibiting an extremely deep
roughness of 25 and 50 µm, were treated by a standardized surface cutting technique with a
bur. Respective data for surface roughness were determined under a CLSM in reflectance
mode ((TCS SL, Leica, Bensheim, Germany). The confocal z-sections were taken at every 1.6
µm under 1000 fold magnification (HC PL Fluotar 100, NA = 0.9).
All specimens were stored dark and dry for 24 h at 37 °C prior to fracture testing. To
evaluate the specific flexural strength and SCG parameters, the four-point-bending test was
used. The bars were fixed between four fins ( = 2 mm, distance of inner/ outer fins: 10/ 20
mm) and were subsequently loaded until fracture with a crosshead speed of 0.75 mm/ min
in an universal testing machine (Z 2.5, Zwick, Germany).
Prospective clinical study design and follow-up
Patients’ selection for the clinical study was based on criteria such as a high level of dental
hygiene, absence of pain from the tooth to be restored or further restorations planned in the
posterior region. 96 inlays (77 %) and onlays (23 %) were placed in 34 patients by six
dentists. Whether two surface (n = 45) or three surface (n = 27) restorations exhibited
proximal margins below the cementoenamel junction (CEJ). 57 molar and 39 premolar
restorations were bonded with a four-step selective-etch adhesive system (Syntac
®
Classic,
IvoclarVivadent), inserted using four different resin composites and light cured for a total of
120 s. The average ceramic dimensions measured prior to insertion have been 1.4 mm below
the deepest fissure, 3.5 mm buccal-lingually at the isthmus, and 1.8 mm below reconstructed
cusps of onlays. Occlusal contacts were adjusted using finishing burs (Intensiv, Viganello-
Lugano, Switzerland) prior to SofLex discs (3MESPE, St. Pauls, MN, USA). Polishing was
conducted using felt discs with a polishing gel (Dia-Finish E Filzscheiben & Brinell, Renfert,
Hilzingen, Germany).
The restorations were assessed after placement by two calibrated investigators using
modified USPHS codes and criteria (major criteria: surface roughness, marginal integrity,
tooth integrity, inlay integrity) at the following time periods: baseline, 1, 2, 4, 6, 8, 10 and 12
years. The study was conducted according to EN 540. For specific details and clinical
procedure refer to (Krämer & Frankenberger, 2005).
Median survival times have been calculated according to Kaplan-Meier survival analysis.
The statistics applied here represent failure rates that correspond to the experimental failure
probability P
F
since most clinical restorations failed due to fracture. To receive information
on fracture releasing clinical loads, those Kaplan-Meier survival times were merged into the
experimental SPT lifetime prediction. Experimental lifetime regression lines for 1, 4, 8 and 12
years were calculated to meet the clinical follow-up periods. Clinical incidence of failures as
well as of defects were located on the corresponding regression line. This experimental
approach might allow for an extrapolation on clinically fracture releasing stress levels.
Fracture strength, slow crack growth and lifetime
According to the assumption of weakest link, the fracture strength of brittle materials is
limited by the largest crack in the loaded volume. Hence, a distribution of crack lengths
results in a strength distribution which is commonly described by fracture probability P
F
c)
0
1 exp
m
c
F
P
(3)

Ceramic Materials 182
where
0
is the scale parameter (P
F
= 63.2%) and m is the Weibull modulus, respectively
(Weibull, 1951; Drummond & Mieschke, 1991). The strength data were evaluated according
to the two parameter cumulative Weibull distribution by plotting the fracture probability P
F
versus fracture strength
c
.
0
1
ln ln ln ln
1
c
F
m m
P
(4)
The parameters m und
0
were determined by a maximum likelihood approach. The slope
of the regression line within the Weibull plot ln (ln (1/(1 - P
F
))) versus ln
c
indicates the
Weibull modulus m and is an indicator for the material homogeneity. The scale parameter
0
represents the strength at a failure probability of P
F
= 63.2%. However, for reliable use in
dentistry the limits for fracture strength are recommended to be set at a failure probability
of P
F
= 5% (Annusavice & Brennan, 1996). Fracture strength for IEM, EMP, and TEC and
dynamic fatigue measurements for IEM were carried out using the 4-point bending
technique in a universal testing machine (Z 2.5, Zwick, Germany) according to the European
standard EN 843. To ensure inert conditions, the specimens (n=25 per group) were dry
stored for 24 h prior to measurements. A constant loading rate d/dt of 130 MPas
-1
was
applied. The groups among each other were analyzed using the non-parametric Mann-
Whitney U-Test ( = 0.05; SPSS 14.0 for Windows). However, to generate significant
differences between the tested groups a Bonferroni correction was applied.
The subcritical crack growth parameters n and A were determined by means of dynamic
fatigue, in which the strength of bend specimens is measured as a function of distinct
loading rates d/dt:
1 2
( 1)
n n
c
t
d
B n
d
(5)
where is the fracture strength at a given loading rate d/dt: [
f
= f (d/dt:)] and
c
the
inert strength at very high loading rates ( =
c
). The parameters n and A were determined
by linear regression analysis from the plot log
f
versus log d/dt (Peterlik, 1994). The
parameter n and A represent the slope and site of the regression line. The extrapolated crack
velocity A is calculated as a function of the constant B (Munz & Fett, 1999):
2 2
2
2
n
Ic
B
A Y n K
(6)
To calculate A, literature values for fracture toughness (IEM: K
Ic
= 1.29 MPam
0.5
) and for the
function of crack shape (Y =
0.5
) were taken reference (Seghi et al., 1995).
Four dynamic fatigue tests at decreasing loading rates d/dt from 1.3 to 0.0013 MPas
-1
were
carried out in distilled water at 37°C.
With the knowledge of the slow crack growth parameters n and A, it is possible to calculate
lifetime for certain loading conditions (Munz & Fett, 1999; Sudreau et al., 1994). For a crack
growth mechanism based on static loading ( = const.) the lifetime t
f
is given as (Ritchie &
Dauskardt, 1991)
2n n
c
f const
t B
(7)
Merging a material’s lifetime with its parameters m and
0
of the Weibull distribution it
becomes possible to define critical conditions for lifetime or loading strength at a given
failure probability P
F
. Those distributions may help to select a suitable dental ceramic for a
reliable design of specific indications. Chadwick, for example, derived comparable relations
for resin composite materials (Chadwick, 1994). On the other hand, by knowledge of clinical
failure rates or lifetimes it is possible to establish a threshold value representing a maximum
load to failure.
Fracture toughness
In order to calculate the fracture toughness K
Ic
for the materials EMP and TEC, the
measurement of surface hardness, elastic modulus and material density was necessary.
Material density was
measured according to Archimedes’ principles of buoyancy and
surface hardness H by Vickers indentation technique according to
2
P
H
b
(8)
where P is the applied load and b is the average indentation half-diagonal of the Vickers
indentation (Anstis et al., 1981). The elastic modulus E was
measured by ultrasound velocity
method (Halmshaw, 1991). Here, the characteristic time delay of sound velocity µ through a
material was measured and related to the elastic modulus
2
1 1 2
1
E
(9)
with the material inherent Poisson ratio .
The indentation fracture technique (IF) was used to calculate the fracture toughness (Anstis
et al., 1981). Flaws of controlled size, shape and location were
introduced into the sample
surface by Vickers indentations at supercritical indentation loads P
c
. Direct measurement of
radial crack lengths w led to characterization of the fracture process and thus to calculation
of fracture toughness K
Ic
through (Scherrer et al., 1998; Albakry et al., 2003):
0.5
1.5
0.016 / /
Ic c
K E H P w
(10)
Material property data for the resin composite and for the glass ceramic material are
summarized in Table 2. Inserting the fracture toughness values in eq. 1, critical flaw sizes a
c
can be calculated depending on the test group specific fracture strength
c
.