Wooldridge J., Introductory Econometrics - A Modern Approach (Instructors Manual)
Подождите немного. Документ загружается.


(ii) The following table contains the Tobit estimates and, for later comparison, OLS
estimates of a linear model:
Dependent Variable: ecolbs
Independent
Variable
Tobit OLS
(Linear Model)
ecoprc
−5.82
(.89)
−2.90
(.59)
regprc
5.66
(1.06)
3.03
(.71)
faminc
.0066
(.0040)
.0028
(.0027)
hhsize
.130
(.095)
.054
(.064)
constant
1.00
(.67)
1.63
(.45)
Number of Observations 660 660
Log Likelihood Value
−1,266.44
⎯⎯⎯
ˆ
σ
3.44 2.48
R-squared .0369 .0393
Only the price variables, ecoprc and regprc, are statistically significant at the 1% level.
(iv) The signs of the price coefficients accord with basic demand theory: the own-price
effect is negative, the cross price effect for the substitute good (regular apples) is positive.
(v) The null hypothesis can be stated as H
0
:
β
1
+
β
2
= 0. Define
θ
1
=
β
1
+
β
2
. Then
1
ˆ
θ
=
−.16.
To obtain the t statistic, I write
β
2
=
θ
1
−
β
1
, plug in, and rearrange. This results in doing Tobit
of ecolbs on (ecoprc − regprc), regprc, faminc, and hhsize. The coefficient on regprc is
1
ˆ
θ
and,
of course we get its standard error: about .59. Therefore, the t statistic is about −.27 and p-value
= .78. We do not reject the null.
(vi) The smallest fitted value is .798, while the largest is 3.327.
(vii) The squared correlation between ecolbs
i
and is about .0369. This is one
possible R-squared measure.
i
ecolbs
173
(viii) The linear model estimates are given in the table for part (ii). The OLS estimates are
smaller than the Tobit estimates because the OLS estimates are estimated partial effects on
E(ecolbs|x), whereas the Tobit coefficients must be scaled by the term in equation (17.27). The
scaling factor is always between zero and one, and often substantially less than one. The Tobit
model does not fit better, at least in terms of estimating E(ecolbs|x): the linear model R-squared
is a bit larger (.0393 versus .0369).
(ix) This is not a correct statement. We have another case where we have confidence in the
ceteris paribus price effects (because the price variables are exogenously set), yet we cannot
explain much of the variation in ecolbs. The fact that demand for a fictitious product is hard to
explain is not very surprising.
[Instructor’s Notes: This might be a good place to remind students about basic economics. You
can ask them whether reglbs should be included as an additional explanatory variable in the
demand equation for ecolbs, making the point that the resulting equation would no longer be a
demand equation. In other words, reglbs and ecolbs are jointly determined, but it is not
appropriate to write each as a function of the other. You could have the students compute
heteroskedasticity-robust standard errors for the OLS estimates. Also, you could have them
estimate a probit model for ecolbs = 0 versus ecolbs > 0, and have them compare the scaled
Tobit slope estimates with the probit estimates.]
17.17 (i) 497 people do not smoke at all. 101 people report smoking 20 cigarettes a day. Since
one pack of cigarettes contains 20 cigarettes, it is not surprising that 20 is a focal point.
(ii) The Poisson distribution does not allow for the kinds of focal points that characterize cigs.
If you look at the full frequency distribution, there are blips at half a pack, two packs, and so on.
The probabilities in the Poisson distribution have a much smoother transition. Fortunately, the
Poisson regression model has nice robustness properties.
(iii) The results of the Poisson regression are given in the following table, along with the
OLS estimates of a linear model for later reference. The Poisson standard errors are the usual
Poisson maximum likelihood standard errors, and the OLS standard errors are the usual
(nonrobust) standard errors.
174

Dependent Variable: cigs
Independent
Variable
Poisson
(Exponential Model)
OLS
(Linear Model)
log(cigpric)
−.355
(.144)
−2.90
(5.70)
log(income) .085
(.020)
.754
(.730)
white
−.0019
(.0372)
−.205
(1.458)
educ
−.060
(.004)
−.514
(.168)
age
.115
(.005)
.782
(.161)
age
2
−.00138
(.00006)
−.0091
(.0018)
constant
1.46
(.61)
5.77
(24.08)
Number of Observations 807 807
Log Likelihood Value
−8,184.03
⎯⎯⎯
ˆ
σ
4.54 13.46
R-squared .043 .045
The estimated price elasticity is −.355 and the estimated income elasticity is .085.
(iv) If we use the maximum likelihood standard errors, the t statistic on log(cigpric) is about
−2.47, which is significant at the 5% level against a two-sided alternative. The t statistic on
log(income) is 4.25, which is very significant.
(v)
2
ˆ
σ
20.61, and so =
ˆ
σ
=
4.54. This is evidence of severe overdispersion, and means that
all of the standard errors for Poisson regression should be multiplied by 4.54; the t statistics
should be divided by 4.54.
(vi) The robust t statistic for log(cigpric) is about
−.54, which makes it very insignificant.
This is a good example of misleading the usual Poisson standard errors and test statistics can be.
The robust t statistic for log(income) is about .94, which also makes the income elasticity
statistically insignificant.
175
(vii) The education and age variables are still quite significant; the robust t statistic on educ
over three in absolute value, and the robust t statistic on age is over five. The coefficient on educ
implies that one more year of education reduces the expected number of cigarettes smoked by
about 6.0%.
(viii) The minimum predicted value is .515 and the maximum is 18.84. The fact that we
predict some smoking for anyone in the sample is a limitation with using the expected value for
prediction. Further, we do not predict that anyone will smoke even one pack of cigarettes, even
though more than 25% of the people in the sample report smoking a pack or more per day! This
shows that smoking, especially heavy smoking, is difficult to predict based on the explanatory
variables we have access to.
(ix) The squared correlation between cigs
i
and is the R-squared reported in the above
table, .043.
i
cigs
(x) The linear model results are reported in the last column of the previous table. The R-
squared is slightly higher for the linear model – but remember, the OLS estimates are chosen to
maximize the R-squared, while the MLE estimates do not maximize the R-squared (as we have
calculated it). In any case, both R-squareds are quite small.
176
CHAPTER 18
TEACHING NOTES
Several of the topics in this chapter, including testing for unit roots and cointegration, have
become staples of applied time series analysis. Instructors who like their course to be more time
series oriented might cover this chapter after Chapter 12, if time permits. Or, the chapter can be
used as a reference for ambitious students who wish to be versed in recent time series
developments.
The discussion of infinite distributed lag models, and in particular geometric DL and rational DL
models, gives one particular interpretation of dynamic regression models. But one must
emphasize that only under fairly restrictive assumptions on the serial correlation in the error of
the infinite DL model does the dynamic regression consistently estimate the parameters in the lag
distribution. Computer Exercise 18.10 provides a good illustration of how the GDL model, and a
simple RDL model, can be too restrictive.
Example 18.5 tests for cointegration between the general fertility rate and the value of the
personal exemption. There is not much evidence of cointegration, which sheds further doubt on
the regressions in levels that were used in Chapter 10. The error correction model for holding
yields in Example 18.7 is likely to be of interest to students in finance. As a class project, or a
term project for a student, it would be interesting to update the data to see if the error correction
model is stable over time.
The forecasting section is heavily oriented towards regression methods and, in particular,
autoregressive models. These can be estimated using any econometrics package, and forecasts
and mean absolute errors or root mean squared errors are easy to obtain. The interest rate data
sets (for example, in INTQRT.RAW) can be updated to do much more recent out-of-sample
forecasting exercises.
177
SOLUTIONS TO PROBLEMS
18.1 With z
t1
and z
t2
now in the model, we should use one lag each as instrumental variables, z
t-1,1
and z
t-1,2
. This gives one overidentifying restriction that can be tested.
18.2 (i) When we lag equation (18.68) once, multiply it by (1 –
λ
), and subtract it from (18.68),
we obtain
y
t
– (1 –
λ
)y
t-1
=
λα
0
+
α
1
[
*
t
x
– (1 –
λ
)
*
1t
x
−
] + u
t
– (1 –
λ
)u
t-1
.
But we can rewrite (18.69) as
*
t
x
– (1 –
λ
)
*
1t
x
−
=
λ
x
t-1
;
when we plug this into the first equation we obtain the desired result.
(ii) If {u
t
} is serially uncorrelated, then {v
t
= u
t
– (1 –
λ
)u
t-1
} must be serially correlated. In
fact, {v
t
} is an MA(1) process with α = – (1 –
λ
). Therefore, Cov(v
t
,v
t-1
) = – (1 –
λ
)
2
u
σ
, and the
correlation between v
t
and v
t-h
is zero for h > 1.
(iii) Because {v
t
} follows an MA(1) process, it is correlated with the lagged dependent
variable, y
t-1
. Therefore, the OLS estimators of the
β
j
will be inconsistent (and biased, of course).
Nevertheless, we can use x
t-2
as an IV for y
t-1
because x
t-2
is uncorrelated with v
t
(because u
t
and
u
t-1
are both uncorrelated with x
t-2
) and x
t-2
) and x
t-2
is partially correlated with y
t-1
.
18.3 For
δ
≠
β
, y
t
–
δ
z
t
= y
t
–
β
z
t
+ (
β
–
δ
)z
t
, which is an I(0) sequence (y
t
–
β
z
t
) plus an I(1)
sequence. Since an I(1) sequence has a growing variance, it dominates the I(0) part, and the
resulting sum is an I(1) sequence.
18.4 Following the hint, we show that y
t-2
–
β
x
t-2
can be written as a linear function of y
t-1
–
β
x
t-1
,
Δy
t-1
, and Δx
t-1
. That is,
y
t-2
–
β
x
t-2
= a
1
(y
t-1
–
β
x
t-1
) + a
2
Δy
t-1
+ a
3
Δx
t-1
for constants a
1
, a
2
, and a
3
. But
(y
t-1
–
β
x
t-1
) – Δy
t-1
+
β
Δx
t-1
= y
t-1
–
β
x
t-1
– (y
t-1
– y
t-2
) +
β
(x
t-1
– x
t-2
) = y
t-2
–
β
x
t-2
,
and so a
1
= 1, a
2
= –1, and a
3
= β work in the first equation.
18.5 Following the hint, we have
y
t
– y
t-1
=
β
x
t
–
β
x
t-1
+
β
x
t-1
– y
t-1
+ u
t
178
or
Δy
t
=
β
Δx
t
– (y
t-1
–
β
x
t-1
) + u
t
.
Next, we plug in Δx
t
=
γ
Δx
t-1
+ v
t
to get
Δy
t
=
β
(
γ
Δx
t-1
+ v
t
) – (y
t-1
–
β
x
t-1
) + u
t
=
βγ
Δx
t-1
– (y
t-1
–
β
x
t-1
) + u
t
+
β
v
t
≡
γ
1
Δx
t-1
+
δ
(y
t-1
–
β
x
t-1
) + e
t
,
where
γ
1
=
βγ
,
δ
= –1, and e
t
= u
t
+
β
v
t
.
18.6 (i) This is given by the estimated intercept, 1.54. Remember, this is the percentage growth
at an annualized rate. It is statistically different from zero since t = 1.54/.56 = 2.75.
(ii) 1.54 + .031(10) = 1.85. As an aside, you could obtain the standard error of this estimate
by running the regression.
pcip
t
on pcip
t-1
, pcip
t-2
, pcip
t-3
, (pcsp
t-1
– 10),
and obtaining the standard error on the intercept.
(iii) Growth in the S&P 500 index has a statistically significant effect on industrial
production growth – in the Granger causality sense – because the t statistic on pcsp
t-1
is about
2.38. The economic effect is reasonably large.
18.7 If unem
t
follows a stable AR(1) process, then this is the null model used to test for Granger
causality: under the null that gM
t
does not Granger cause unem
t
, we can write
unem
t
= β
0
+ β
1
unem
t-1
+ u
t
E(u
t
|unem
t-1
, gM
t-1
, unem
t-2
, gM
t-2
, K ) = 0
and |
β
1
| < 1. Now, it is up to us to choose how many lags of gM to add to this equation. The
simplest approach is to add gM
t-1
and to do a t test. But we could add a second or third lag (and
probably not beyond this with annual data), and compute an F test for joint significance of all
lags of gM
t
.
18.8 (i) Following the hint we have
y
t
=
α
+
δ
1
z
t-1
+ u
t
=
α
+
δ
1
z
t-1
+
ρ
u
t-1
+ e
t
=
α
+
δ
1
z
t-1
+
ρ
(y
t-1
–
α
–
δ
1
z
t-2
) + e
t
= (1 –
ρ
)
α
+
ρ
y
t-1
+
δ
1
z
t-1
–
ρδ
1
z
t-2
+ e
t
.
179
By assumption, E(e
t
|I
t-1
) = 0, and since y
t-1
, z
t-1
, and z
t-2
are all in I
t-1
, we have
E(y
t
|I
t-1
) = (1 –
ρ
)
α
+
ρ
y
t-1
+
δ
1
z
t-1
–
ρδ
1
z
t-2
.
We obtain the desired answer by adding one to the time index everywhere.
(ii) The forecasting equation for y
n+1
is obtained by using part (i) with t = n, and then
plugging in the estimates:
ˆ
n
f
= (1 –
ˆ
ρ
)
ˆ
α
+
ˆ
ρ
y
n
+
1
ˆ
δ
z
n
–
1
ˆ
ˆ
ρ
δ
z
n-1
where I
t-1
contains y and z dated at t – 1 and earlier.
(iii) From part (i), it follows that the model with one lag of z and AR(1) serial correlation in
the errors can be obtained from
y
t
=
α
0
+
ρ
y
t-1
+
γ
1
z
t-1
+
γ
2
z
t-2
+ e
t
, E(e
t
|I
t-1
) = 0
with
α
0
= (1 −
ρ
)
α
,
γ
1
=
δ
1
, and
γ
2
= −
ρδ
1
= −
ργ
1
. The key is that γ
2
is entirely determined (in a
nonlinear way) by
ρ
and γ
1
. So the model with a lag of z and AR(1) serial correlation is a special
case of the more general model. (Note that the general model depends on four parameters, while
the model from part (i) depends on only three.)
(iv) For forecasting, the AR(1) serial correlation model may be too restrictive. It may
impose restrictions on the parameters that are not met. On the other hand, if the AR(1) serial
correlation model holds, it captures the conditional mean E(y
t
|I
t-1
) with one fewer parameter than
the general model; in other words, the AR(1) serial correlation model is more parsimonious.
[See Harvey (1990) for ways to test the restriction
γ
2
= −
ργ
1
, which is called a common factor
restriction.]
18.9 Let be the forecast error for forecasting y
1
ˆ
n
e
+
n+1
, and let
1
ˆ
n
a
+
be the forecast error for
forecasting Δy
n+1
. By definition, = y
1
ˆ
n
e
+
n+1
−
ˆ
n
f
= y
n+1
– ( + y
ˆ
n
g
n
) = (y
n+1
– y
n
) − = Δy
ˆ
n
g
n+1
−
= , where the last equality follows by definition of the forecasting error for Δy
ˆ
n
g
1
ˆ
n
a
+
n+1
.
SOLUTIONS TO COMPUTER EXERCISES
18.10 (i) The estimated GDL model is
= .0013 + .081 gwage + .640 gprice
gprice
-1
(.0003) (.031) (.045)
n = 284, R
2
= .454.
180
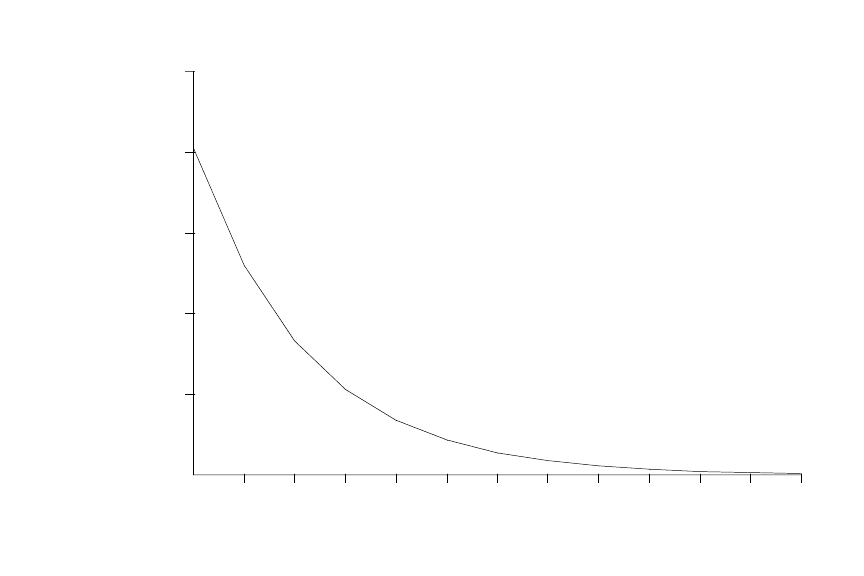
The estimated impact propensity is .081 while the estimated LRP is .081/(1 – .640) = .225. The
estimated lag distribution is graphed below.
lag
01
2 3 4 5 6 7 8 9 10 11 12
0
.02
.04
.06
.08
coefficient .1
(ii) The IP for the FDL model estimated in Problem 11.5 was .119, which is substantially
above the estimated IP for the GDL model. Further, the estimated LRP from GDL model is
much lower than that for the FDL model, which we estimated as 1.172. Clearly we cannot think
of the GDL model as a good approximation to the FDL model. One reason these are so different
can be seen by comparing the estimated lag distributions (see below for the GDL model). With
the FDL, the largest lag coefficient is at the ninth lag, which is impossible with the GDL model
(where the largest impact is always at lag zero). It could also be that {u
t
} in equation (18.8) does
not follow an AR(1) process with parameter
ρ
, which would cause the dynamic regression to
produce inconsistent estimators of the lag coefficients.
(iii) When we estimate the RDL from equation (18.16) we obtain
= .0011 + .090 gwage + .619 gprice
gprice
-1
+ .055 gwage
-1
(.0003) (.031) (.046) (.032)
n = 284, R
2
= .460.
The coefficient on gwage
-1
is not especially significant, but we compute the IP and LRP and
anyway. The estimated IP is .09 while the LRP is (.090 + .055)/1 – .619)
≈
.381. These are
both slightly higher than what we obtained for the GDL, but the LRP is still well below what we
obtained for the FDL in Problem 11.5. While this RDL model is more flexible than the GDL
181
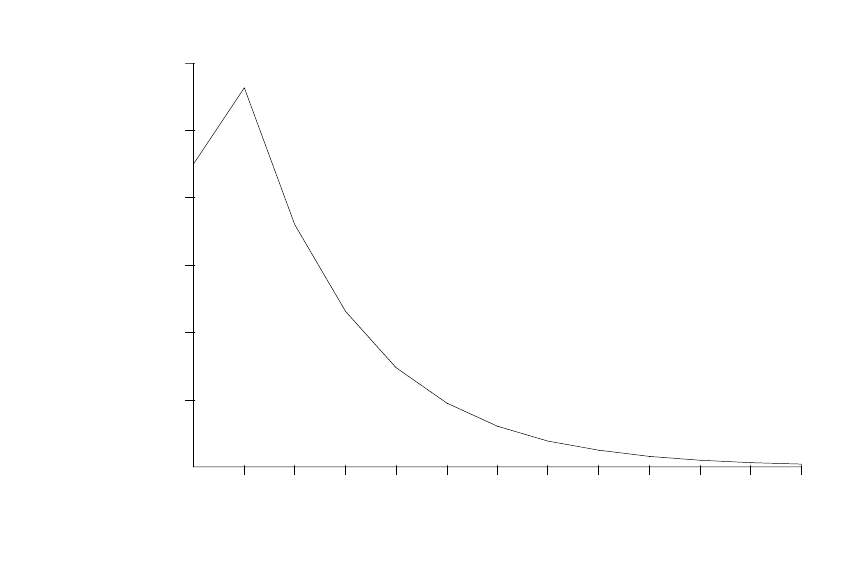
model, it imposes a maximum lag coefficient (in absolute value) at lag zero or one. For the
estimates given above, the maximum effect is at the first lag. (See the estimated lag distribution
below.) This is not consistent with the FDL estimates in Problem 11.5.
lag
01
2 3 4 5 6 7 8 9 10 11 12
0
.02
.04
.06
.08
.1
coefficient .12
18.11 (i) We run the regression
= –.786 – .956 log(invpc
t
ginvpc
t-1
) + .0068 t
(.170) (.198) (.0021)
+ .532 ginvpc
t-1
+ .290 ginvpc
t-2
(.162) (.165)
n = 39, R
2
= .437,
where ginvpc
t
= log(invpc
t
) – log(invpc
t-1
). The t statistic for the augmented Dickey-Fuller unit
root test is –.956/.198 –4.82, which is well below –3.96, the 1% critical value obtained from
Table 18.3. Therefore, we strongly reject a unit root in log(invpc
≈
t
). (Incidentally, remember that
the t statistics on the intercept and time trend in this estimated equation to not have approximate t
distributions, although those on ginvpc
t-1
and ginvpc
t-2
do under the usual null hypothesis that the
parameter is zero.)
(ii) When we apply the regression to log(price
t
) we obtain
182