Ware C. Information Visualization: Perception for Design
Подождите немного. Документ загружается.

(a) Arrows on a regular grid. Fixed length.
(b) Arrows on a jittered grid to reduce perceptual aliasing effects. Fixed length.
(c) Triangle icons. Icon size proportional to field strength density inversely related to icon size
(Kirby et al., 1999).
(d) Line integral convolution (Cabral and Leedom, 1993).
(e) Large-head arrows along a streamline using a regular grid (Turk and Banks, 1996).
(f) Large-head arrows along streamlines using constant spacing algorithm. (Turk and Banks,
1996).
In order to evaluate any visualization, it is necessary to specify a set of tasks. Laidlaw et al. (2001)
had subjects identify critical points as one task. These are points in a vector or flow field where
the vectors have zero magnitude. The results showed the arrow-based methods illustrated in
Figure 6.25(a) and (b) to be the least effective for identifying the locations of these points. A
second task involved perceiving advection trajectories. An advection trajectory is the path taken
by a particle dropped in a flow. The streamline methods of Turk and Banks proved best for
showing advection, especially the method shown in Figure 6.25(f). The line integral convolution
method, shown in Figure 6.25(d), was by far the worst for advection, probably because it does
not unambiguously identify direction.
Although the study done by Laidlaw et al. (2001) is the first serious comparative evaluation
of the effectiveness of vector field visualization methods, it is by no means exhaustive. There are
alternative visualizations, and those shown have many possible variations: longer and shorter
line segments, color variations, and so on. In addition, the tasks studied by Laidlaw et al. do not
include all of the important visualization tasks that are likely to be carried out with flow visu-
alizations. Here is a more complete list:
•
Identifying the location and nature of critical points
•
Judging an advection trajectory
•
Perceiving patterns of high and low velocity
•
Perceiving patterns of high and low vorticity (sometimes called curl)
•
Perceiving patterns of high and low turbulence
Both the kinds and the scale of patterns that are important will vary from one application to
another; small-scale detailed patterns, such as eddies, will be important to one researcher, whereas
large-scale patterns will interest another.
The problem of optimizing flow display may not be quite so complex and multifaceted as it
would first seem. If we ignore the diverse algorithms and think of the problem in purely visual
terms, then the various display methods illustrated in Figures 6.22 through 6.25 have many char-
acteristics in common. They all consist principally of contours oriented in the flow direction,
204 INFORMATION VISUALIZATION: PERCEPTION FOR DESIGN
ARE6 1/20/04 5:02 PM Page 204
although these contours have different characteristics in terms of length, width, and shape.
The line integral convolution method illustrated in Figure 6.25(d) produces a very different-
looking, blurry result; however, something similar could be computed using blurred contours.
Contours that vary in shape and gray value along their lengths could be expressed with two
or three parameters. The different degrees of randomness in the placement of contours could be
parameterized. Thus, we might consider the various 2D flow visualization methods as part of a
family of related methods—different kinds of flow oriented contours. Considered in this way,
the display problem becomes one of optimizing the various parameters to reveal important
aspects of the data for a particular set of tasks and not so much a problem of developing new
algorithms.
Perception of Transparency: Overlapping Data
In many visualization problems, it is desirable to present data in a layered form. This is espe-
cially common in geographic information systems (GISs). Sometimes, a useful technique is to
present one layer of data as if it were a transparent layer over another. However, there are many
perceptual pitfalls in doing this. The contents of the different layers will always interfere with
each other to some extent, and sometimes the two layers will fuse perceptually so that it is not
possible to determine to which layer a given object belongs.
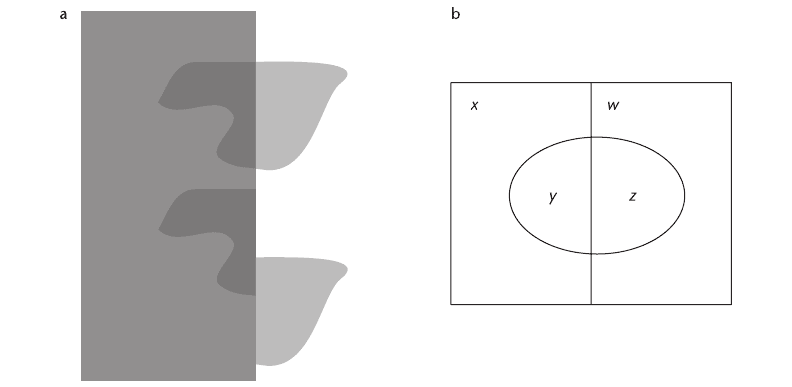
In simple displays, as in Figure 6.26(a), the two main determinants of perceived transparency
are good continuity (Beck and Ivry, 1988) and the ratio of colors or gray values in the different
pattern elements. A reasonably robust rule for transparency to be perceived is x < y < z or x >
y > z or y < z < w or y > z > w, where x, y, z, and w refer to gray values arranged in the pattern
shown in Figure 6.26(b) (Masin, 1997). Readers who are interested in perceptual rules of trans-
parency should consult Metelli (1974).
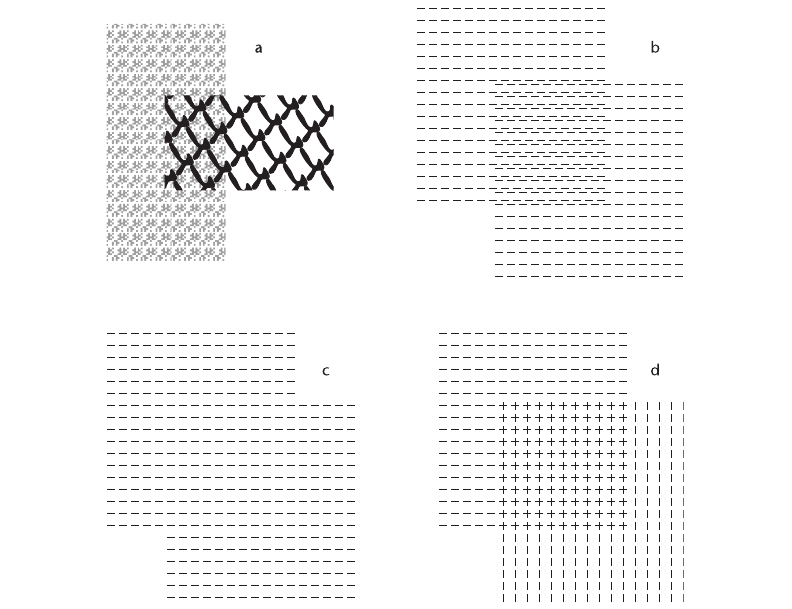
Another way to represent layers of data is to show each layer as a see-through texture or
screen pattern (Figure 6.27). Watanabe and Cavanaugh (1996) explored the conditions under
which people perceive two distinct overlapping layers, as opposed to a single fused composite
texture. They called the effect laciness. In Figure 6.27(a) and (b), two different overlapping rec-
tangles are clearly seen, but in (c), only a single textured patch is perceived. In (d), the percept
is bistable. Sometimes it looks like two overlapping squares containing patterns of “-” elements;
sometimes a central square containing a pattern of “+” elements seems to stand out as a distinct
region.
In general, when we present layered data, we can expect the basic rules of perceptual inter-
ference, discussed in Chapter 5, to apply. Similar patterns interfere with one another. Graphical
patterns that are similar in terms of color, spatial frequency, motion, and so on, tend to interfere
more with one another than do those with dissimilar components.
One possible application of transparency in user interfaces is to make pop-up menus
transparent so that they do not interfere with information located behind them. Harrison and
Vincente (1996) investigated the interference between background patterns and foreground trans-
Static and Moving Patterns 205
ARE6 1/20/04 5:02 PM Page 205
parent menus. They found that it took longer to read from the menu with text or wireframe
drawings in the background than with continuously shaded images in the background. This is
exactly what would be expected from an interference model. Because a continuously shaded
image lacks the high-frequency detail of a wireframe image or text, there will be less interference
between the two. The advantages of transparent layered displays must be weighed against the
perceptual interference between the layers. For the designer to minimize visual interference, layers
must be maximally separated in the different visual channels. Color, texture, motion, and stereo-
scopic depth channels can all be used in any combination, depending on the design requirements.
The more channels used, the better the separation will be.
Pattern Learning
If pattern perception is, as claimed, fundamental to extraction of meaning from visualizations,
then an important question arises. Can we learn to see patterns better? Artists talk about seeing
things that the rest of us cannot see, and ace detectives presumably spot visual clues that are
invisible to the beat officer.
What is the scientific evidence that people can learn to see patterns better? The results are
mixed. There have been some studies of pattern learning where almost no learning occurred. An
often-cited example is the visual search for the simple conjunction of features such as color and
shape (Treisman and Gelade, 1980). But other studies have found learning for certain patterns
(Logan, 1994). A plausible explanation is that pattern learning occurs least for simple, basic
206 INFORMATION VISUALIZATION: PERCEPTION FOR DESIGN
Figure 6.26 In (a), transparency is perceived only when good continuity is present and when the correct relationship
of the colors is present. See text for an explanation of (b).
ARE6 1/20/04 5:02 PM Page 206
patterns processed early in the visual system, and most for complex, unfamiliar patterns processed
late in the visual system.
Fine and Jacobs (2002) reviewed 16 different pattern-learning experiments and found very
different amounts of learning. The studies they looked at all contained large numbers of
trials (in which a subject would attempt to see a particular pattern in a display) distributed over
several days. They found that for simple pattern perception tasks, such as the ability to resolve
a grating pattern like that shown in Figure 6.28(a), almost no learning occurred. This task
depends on early-stage visual processing, for which the neural machinery is consolidated in the
first few months of life. In tasks involving patterns of intermediate complexity, some learning
does occur. For example, seeing spatial frequency differences within a pattern such as that shown
in Figure 6.28(b) can be learned (Fine and Jacobs, 2000). This is a “plaid” pattern constructed
by summing a variety of the sinusoidal gratings. Processing of such patterns is thought to occur
Static and Moving Patterns 207
Figure 6.27 Watanabe and Cavanaugh (1996) called the texture equivalent of transparency laciness. This figure is
based on their work.
ARE6 1/20/04 5:02 PM Page 207
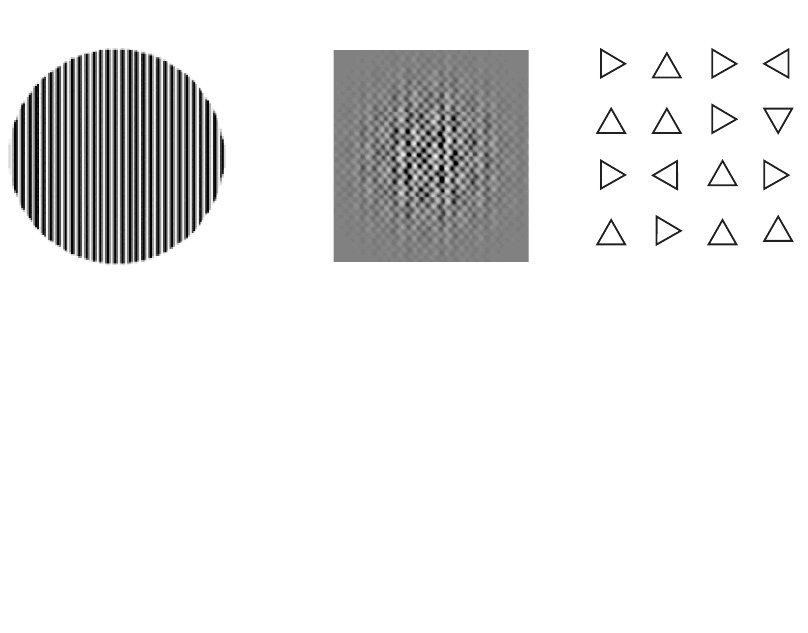
mostly at an intermediate stage of the visual system. The most learning was found in higher-level
pattern tasks, such as detecting the downward pointing triangles in Figure 6.28(c) (Sigman and
Gilbert, 2000).
Another factor that affects learning is the degree to which a particular pattern is already
familiar. We would not expect much change in a subject’s ability to identify letters of the alpha-
bet in a short experiment, because most people have already been exposed to millions of alpha-
betic characters. Rapid learning can only be expected for patterns that are unfamiliar. The change
in rate of learning over time is captured by the power law of practice, which has the following
form:
(6.1)
This law states that log of the time T
n
to respond on the n
th
trial is inversely proportional to the
log of the number of trials. The constant C is the time taken on the first trial (or block of trials).
The power law of practice is usually applied to manual skill learning, but it has also been
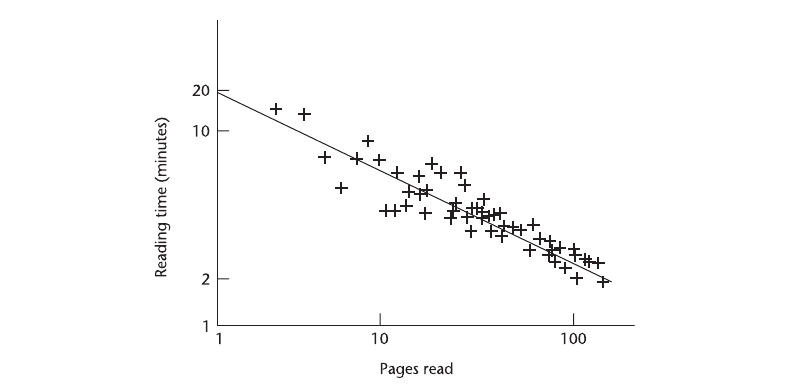
shown to apply to the perception of complex patterns. Kolers (1975) found that a power law
applied to the task of learning to read inverted text. His results are illustrated in Figure 6.29.
Initially, it took subjects about 15 minutes to read a single inverted page, but when over 100
pages had been read, the time was reduced to 2 minutes. Although Figure 6.29 shows a straight-
line relationship between practice and learning, this is only because of the logarithmic transfor-
mation of the data. The relationship is actually very nonlinear. Consider a hypothetical task where
people improve by 30% from the first day’s practice to the second day. Doubling the amount
of practice has resulted in a 30% gain. According to the power law, someone with 10 years of
experience at the same task will take a further 10 years to improve by 30%. In other words,
practice yields decreasing gains over time.
log logTC n
n
(
)
=-
(
)
a
208 INFORMATION VISUALIZATION: PERCEPTION FOR DESIGN
a
b
c
Figure 6.28 Three patterns used in perceptual learning studies.
ARE6 1/20/04 5:02 PM Page 208
In addition to long-term pattern-learning skills, there are also priming effects that are much
more transient. Whether these constitute learning is still the subject of debate. Priming refers to
the phenomenon that once a particular pattern has been recognized, it will be much easier to
identify in the next few minutes or even hours. This is usually thought of as a kind of height-
ened receptivity within the visual system, but some theorists consider it to be visual learning. In
either case, once a neural pathway has been activated, its future activation becomes facilitated.
For a modern theory of perceptual priming based on neural mechanisms, see Huber and O’Reilly
(2003).
What are the implications of these findings for visualization? One is that people can learn
pattern-detection skills, although the ease of gaining these skills will depend on the specific nature
of the patterns involved. Experts do indeed have special expertise. The radiologist interpreting
an X-ray, the meteorologist interpreting radar, and the statistician interpreting a scatter plot will
each bring a differently tuned visual system to bear on his or her particular problem. People who
work with visualizations must learn the skill of seeing patterns in data. In terms of making visu-
alizations that contain easily identified patterns, one strategy is to rely on pattern-finding skills
that are common to everyone. These can be based on low-level perceptual capabilities, such as
seeing the connections between objects linked by lines. We can also rely on skill transfer. If we
know that our users are cartographers, already good at reading terrain contour maps, we can
display other information, such as energy fields, in the form of contour maps. The evidence from
priming studies suggests that when we want people to see particular patterns, even familiar ones,
it is a good idea to show them a few examples ahead of time.
Static and Moving Patterns 209
Figure 6.29 The time to read a page of inverted text is plotted against the number of pages read. Both axes have
logarithmic spacing. Data replotted from Newell and Rosenbloom (1981).
ARE6 1/20/04 5:02 PM Page 209
210 INFORMATION VISUALIZATION: PERCEPTION FOR DESIGN
The Perceptual Syntax of Diagrams
Diagrams are always hybrids of the conventional and the perceptual. Diagrams contain conven-
tional elements, such as abstract labeling codes, that are difficult to learn but formally powerful.
They also contain information that is coded according to perceptual rules, such as Gestalt prin-
ciples. Arbitrary mappings may be useful, as in the case of mathematical notation, but a good
diagram takes advantage of basic perceptual mechanisms that have evolved to perceive structure
in the environment. By presenting examples, the following sections describe the visual grammar
of two different kinds of diagrams: node–link diagrams and the layered maps used in GISs.
The Grammar of Node–Link Diagrams
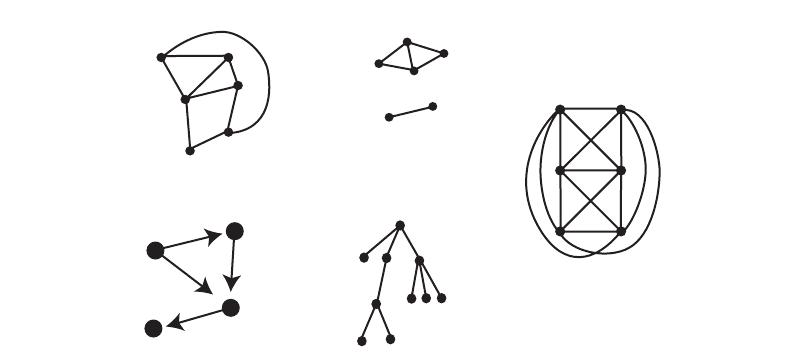
For a mathematician, a graph is a structure consisting of nodes and edges (links between the
nodes). See Figure 6.30 for examples. There is a specialized academic field called graph drawing
whose goal is to make graphs that are pleasantly laid out and easy to read. In graph drawing,
layout algorithms are optimized according to aesthetic rules, such as the minimization of link
crossings, displaying symmetry of structure and minimizing bends in links (Di Battista et al.,
1999). Path bendiness and the number of link crossings have both been shown empirically
to degrade performance on the task of finding the shortest path between two nodes (Ware
et al., 2002). However, for the most part, there has been little attempt either to systematically
apply our knowledge of pattern perception to problems in graph drawing or to use empirical
a
b
c
d
e
Figure 6.30 Node–link diagrams, technically called graphs: (a) A graph. (b) A graph with two connected components.
(c) A directed graph. (d) A tree structure graph. (e) A nonplanar graph. It cannot be laid out on a plane
without links crossing.
ARE6 1/20/04 5:02 PM Page 210
methods to determine that graphs laid out according to aesthetic principles are, in fact, easier to
understand.
In the following paragraphs, we broaden the concept of a graph to consider a very large
class of diagrams that we will call, generically, node–link diagrams. The essential characteristic
of these diagrams is that they consist of nodes, representing various kinds of entities, and links,
representing relationships between the entities. Dozens of different diagrams have this basic form,
including software structure diagrams, data-flow diagrams, organization charts, and software
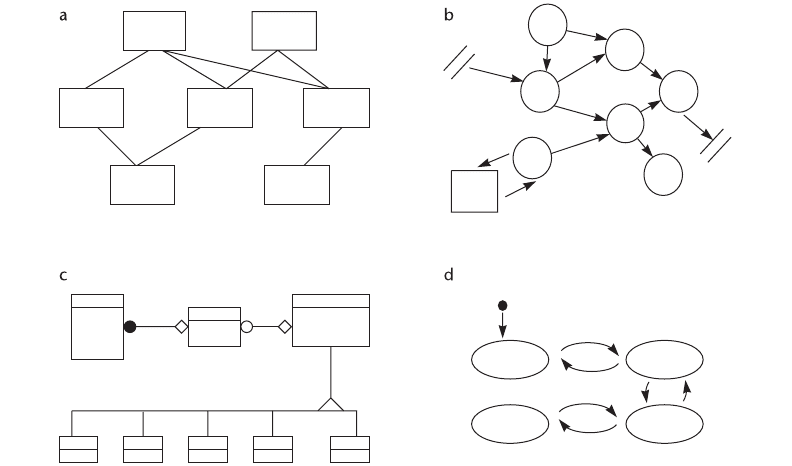
modeling diagrams. Figure 6.31 provides four examples commonly used in software engineer-
ing. The set of abstractions common to node–link diagrams is so close to ubiquitous that it can
be called a visual grammar. The nodes are almost always outline boxes or circles, usually repre-
senting the entities in a system. The connecting lines generally represent different kinds of rela-
tionships, transitions, or communication paths between nodes. Experimental work shows that
visualizing interdependencies between program elements helps program understanding (Linos
et al., 1994).
The various reasons why we may be justified in calling these graphical codes perceptual are
distributed throughout this book, but are addressed mostly in this chapter and Chapter 5. The
Static and Moving Patterns 211
Figure 6.31 Four different kinds of node–link diagrams used in software engineering: (a) A code module diagram.
(b) A data flow diagram. (c) An object modeling diagram. (d) A state transition diagram. Each of these
diagrams would normally contain text labels on the nodes and the arcs.
ARE6 1/20/04 5:02 PM Page 211
fundamental argument is that closed contours are basic in defining visual objects. Thus, although
a circular line may be only a mark drawn on paper, at some level in the visual system it is object-
like. Similarly, two objects can be connected by a line, and this visual connection has the ability
to represent any of a number of relationships.
Although lines get their expressive power from neural mechanisms designed to interpret
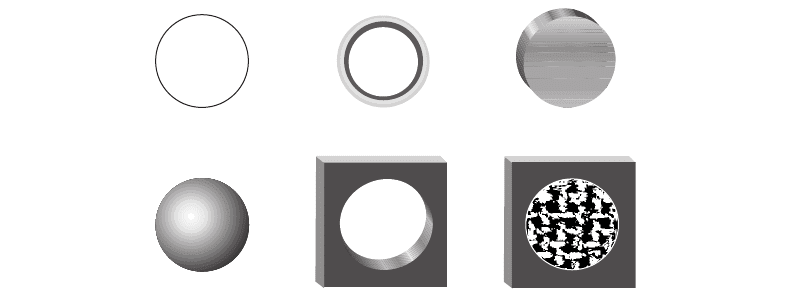
objects, they are fundamentally ambiguous. Kennedy (1974) has elucidated many ways in which
contours (lines) can represent aspects of the environment. Some of them are illustrated in Figure
6.32. A circle can represent a ring, a flat disk, a ball, a hole, or the boundary between two objects
(a disk in a hole). This nicely illustrates the mixture of perception and convention that is common
to diagrams. Our visual systems are capable of interpreting a line contour in any of these ways.
In real-world scenes, additional information is available to clarify ambiguous contours. In a
diagram, the contour may remain perceptually ambiguous and some convention may be neces-
sary to remove the ambiguity. In one kind of diagram, a circle may represent an object; in another,
it may represent a hole; in a third, it may represent the boundary of a geographic region. The
diagram convention tells us which interpretation is correct.
A general data model that uses a form of node–link diagram is the entity-relationship model.
It is widely used in computer science and business modeling (Chen, 1976). In entity relationships,
modeling entities can be objects and parts of objects, or more abstract things such as parts of
organizations. Relationships are the various kinds of connections that can exist between entities.
For example, an entity representing a wheel will have a part-of relationship to an entity repre-
senting an automobile. A person may have a customer relationship to a store. Both entities and
relationships can have attributes. Thus, a particular customer might be a preferred customer. An
attribute of an organization might be the number of its employees. There are standard diagrams
for use in entity-relationship modeling, but we are not concerned with these here. We are more
212 INFORMATION VISUALIZATION: PERCEPTION FOR DESIGN
Figure 6.32 The line circle shown at the top left can represent many kinds of objects: a wire ring, a disk, a ball, a
cut-out hole, or the boundary between a disk and the hole in which it resides.
ARE6 1/20/04 5:02 PM Page 212
interested in the different ways diagrams can be constructed to represent entities, relationships,
and attributes in an easily perceived manner.
The following list is a description of the general ways in which entities and relationships can
be expressed using node–link diagrams. This can be regarded loosely as a visual syntax. These
are conjectured to be good display mappings, although none has been proved through scientific
study to be the best. Each of the elements in the list has a perceptual, rather than conventional,
basis for the way it conveys meaning. Most of these elements are discussed more extensively else-
where in this book. Figure 6.33 provides a set of matching illustrations.
1. A closed contour in a node–link diagram generally represents an entity of some kind. It
might be part of a body of software, or a person in an organization.
2. The shape of the closed contour is frequently used to represent an entity type (an attribute
of the entity).
3. The color of an enclosed region represents an entity type (an attribute).
4. The size of an enclosed region can be used to represent the magnitude of an entity (a
scalar attribute).
5. Lines that partition a region within a closed contour can delineate subparts of an entity.
This may correspond to a real-world multipart object.
6. Closed-contour regions may be aggregated. The result is readily seen as a composite entity.
7. A number of closed-contour regions within a larger closed contour can represent
conceptual containment.
8. Placing closed contours spatially in an ordered sequence can represent conceptual ordering
of some kind.
9. A line linking entities represents some kind of relationship between them.
10. A line linking closed contours can have different colors, or other graphical qualities such
as waviness. This effectively represents an attribute or type of a relationship.
11. The thickness of a connecting line can be used to represent the magnitude of a
relationship (a scalar attribute).
12. A contour can be shaped with tabs and sockets to indicate which components have
particular relationships.
13. Proximity of components can represent groups.
The vast majority of node–link diagrams currently in use are very simple. For the most part,
these diagrams use identical rectangular or circular nodes and constant-width lines, like those
shown in Figure 6.31. Although such generic diagrams are very effective in conveying patterns
of structural relationships among entities, they are often poor at showing the types of entities
Static and Moving Patterns 213
ARE6 1/20/04 5:02 PM Page 213