Tietenberg Tom, Lewis Lynne. Environmental & Natural Resource Economics
Подождите немного. Документ загружается.

21Environmental Problems and Economic Efficiency
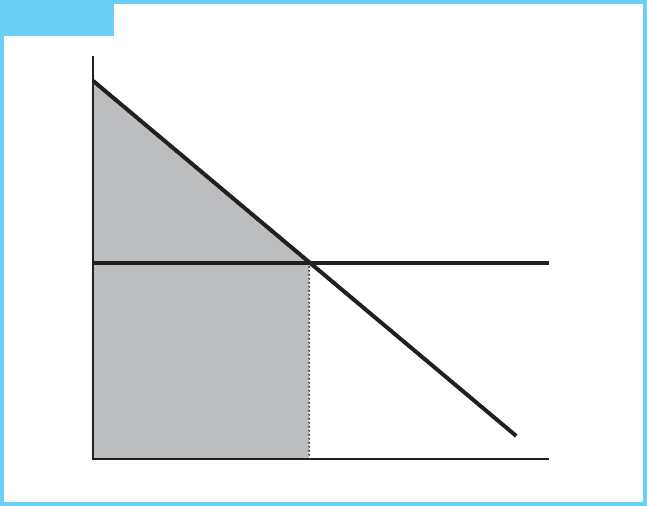
FIGURE 2.2 The Consumer’s Choice
demand curve minus the consumer’s cost. The cost to the consumer is the area
under the price line, bounded from the left by the vertical axis and the right by the
quantity of the good. This rectangle, which captures price times quantity, repre-
sents consumer expenditure on this quantity of the good.
Why is this area thought of as a surplus? For each quantity purchased, the
corresponding point on the market demand curve represents the amount of money
some person would have been willing to pay for the last unit of the good. The total
willingness to pay for some quantity of this good—say, three units—is the sum of the
willingness to pay for each of the three units. Thus, the total willingness to pay for
three units would be measured by the sum of the willingness to pay for the first,
second, and third units, respectively. It is now a simple extension to note that the
total willingness to pay is the area under the continuous market demand curve to
the left of the allocation in question. For example, in Figure 2.2 the total willing-
ness to pay for Q
d
units of the commodity is the shaded area. Total willingness to
pay is the concept we shall use to define the total value a consumer would receive
from the five units of the good. Thus, total value the consumer would receive is
equal to the area under the market demand curve from the origin to the allocation
of interest. Consumer surplus is thus the excess of total willingness to pay over the
(lower) actual cost.
Meanwhile, sellers face a similar choice (see Figure 2.3). Given price P*, the
seller maximizes his or her own producer surplus by choosing to sell Q
s
units. The
Price
(dollars
per unit)
Quantity
(units)
P*
0 Q
d
A =
Consumer
Surplus
D

FIGURE 2.3 The Producer’s Choice
22 Chapter 2 The Economic Approach
producer surplus is designated by area B, the area under the price line that lies over
the marginal cost curve, bounded from the left by the vertical axis and the right by
the quantity of the good.
Property Rights
Property Rights and Efficient Market Allocations
The manner in which producers and consumers use environmental resources
depends on the property rights governing those resources. In economics, property
right refers to a bundle of entitlements defining the owner’s rights, privileges, and
limitations for use of the resource. By examining such entitlements and how they
affect human behavior, we will better understand how environmental problems
arise from government and market allocations.
These property rights can be vested either with individuals, as in a capitalist
economy, or with the state, as in a centrally planned socialist economy. How can
we tell when the pursuit of profits is consistent with efficiency and when it is
not?
Price
(dollars
per unit)
Quantity
(units)
P*
0
Q
s
B =
Producer
Surplus
S
Efficient Property Rights Structures
Let’s begin by describing the structure of property rights that could produce effi-
cient allocations in a well-functioning market economy. An efficient structure has
three main characteristics:
1. Exclusivity—All benefits and costs accrued as a result of owning and using the
resources should accrue to the owner, and only to the owner, either directly
or indirectly by sale to others.
2. Transferability—All property rights should be transferable from one owner to
another in a voluntary exchange.
3. Enforceability—Property rights should be secure from involuntary seizure or
encroachment by others.
An owner of a resource with a well-defined property right (one exhibiting these
three characteristics) has a powerful incentive to use that resource efficiently
because a decline in the value of that resource represents a personal loss. Farmers
who own the land have an incentive to fertilize and irrigate it because the resulting
increased production raises income. Similarly, they have an incentive to rotate
crops when that raises the productivity of their land.
When well-defined property rights are exchanged, as in a market economy, this
exchange facilitates efficiency. We can illustrate this point by examining the incen-
tives consumers and producers face when a well-defined system of property rights
is in place. Because the seller has the right to prevent the consumer from consum-
ing the product in the absence of payment, the consumer must pay to receive the
product. Given a market price, the consumer decides how much to purchase by
choosing the amount that maximizes his or her individual consumer surplus.
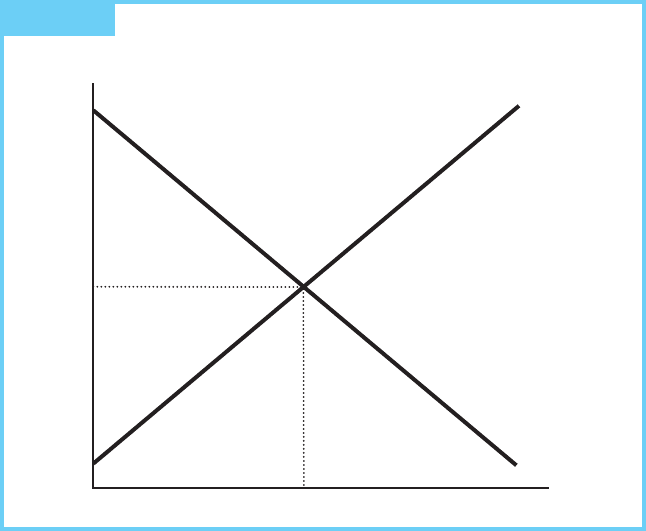
Is this allocation efficient? According to our definition of static efficiency, it is
clear the answer is yes. The economic surplus is maximized by the market allo-
cation and, as seen in Figure 2.4, it is equal to the sum of consumer and producer
surpluses (areas A + B). Thus, we have established a procedure for measuring effi-
ciency, and a means of describing how the surplus is distributed between consumers
and producers.
This distinction is crucially significant. Efficiency is not achieved because
consumers and producers are seeking efficiency. They aren’t! In a system with well-
defined property rights and competitive markets in which to sell those rights,
producers try to maximize their surplus and consumers try to maximize their
surplus. The price system, then, induces those self-interested parties to make
choices that are efficient from the point of view of society as a whole. It channels
the energy motivated by self-interest into socially productive paths.
Familiarity may have dulled our appreciation, but it is noteworthy that a system
designed to produce a harmonious and congenial outcome could function effec-
tively while allowing consumers and producers so much individual freedom in
making choices. This is truly a remarkable accomplishment.
23Property Rights
24 Chapter 2 The Economic Approach
Producer’s Surplus, Scarcity Rent, and Long-Run
Competitive Equilibrium
Since the area under the price line is total revenue, and the area under the marginal
cost curve is total variable cost, producer’s surplus is related to profits. In the short
run when some costs are fixed, producer’s surplus is equal to profits plus fixed cost.
In the long run when all costs are variable, producer’s surplus is equal to profits plus
rent, the return to scarce inputs owned by the producer. As long as new firms can
enter into profitable industries without raising the prices of purchased inputs, long-
run profits and rent will equal zero.
Scarcity Rent. Most natural resource industries, however, do give rise to rent and,
therefore, producer’s surplus is not eliminated by competition, even with free entry.
This producer’s surplus, which persists in long-run competitive equilibrium, is
called scarcity rent.
David Ricardo was the first economist to recognize the existence of scarcity rent.
Ricardo suggested that the price of land was determined by the least fertile
marginal unit of land. Since the price had to be sufficiently high to allow the poorer
land to be brought into production, other, more fertile land could be farmed at an
economic profit. Competition could not erode that profit because the amount of
high quality land was limited and lower prices would serve only to reduce the
FIGURE 2.4 Market Equilibrium
Price
(dollars
per unit)
Quantity
(units)
P*
0 Q*
B
S
A
D

25Externalities as a Source of Market Failure
supply of land below demand. The only way to expand production would be to
bring additional, less fertile land (more costly to farm) into production; con-
sequently, additional production does not lower price, as it does in a constant-cost
industry. As we shall see, other circumstances also give rise to scarcity rent for
natural resources.
Externalities as a Source of Market Failure
The Concept Introduced
Exclusivity is one of the chief characteristics of an efficient property rights
structure. This characteristic is frequently violated in practice. One broad class of
violations occurs when an agent making a decision does not bear all of the con-
sequences of his or her action.
Suppose two firms are located by a river. The first produces steel, while the
second, somewhat downstream, operates a resort hotel. Both use the river,
although in different ways. The steel firm uses it as a receptacle for its waste, while
the hotel uses it to attract customers seeking water recreation. If these two facilities
have different owners, an efficient use of the water is not likely to result. Because
the steel plant does not bear the cost of reduced business at the resort resulting
from waste being dumped into the river, it is not likely to be very sensitive to that
cost in its decision making. As a result, it could be expected to dump too much
waste into the river, and an efficient allocation of the river would not be attained.
This situation is called an externality. An externality exists whenever the welfare
of some agent, either a firm or household, depends not only on his or her activities,
but also on activities under the control of some other agent. In the example, the
increased waste in the river imposed an external cost on the resort, a cost the steel
firm could not be counted upon to consider appropriately in deciding the amount
of waste to dump.
The effect of this external cost on the steel industry is illustrated in Figure 2.5,
which shows the market for steel. Steel production inevitably involves producing
pollution as well as steel. The demand for steel is shown by the demand curve D,
and the private marginal cost of producing the steel (exclusive of pollution control
and damage) is depicted as MC
p
. Because society considers both the cost of pollu-
tion and the cost of producing the steel, the social marginal cost function (MC
s
)
includes both of these costs as well.
If the steel industry faced no outside control on its emission levels, it would seek
to produce Q
m
. That choice, in a competitive setting, would maximize its private
producer surplus. But that is clearly not efficient, since the net benefit is maximized
at Q*, not Q
m
.
With the help of Figure 2.5, we can draw a number of conclusions about market
allocations of commodities causing pollution externalities:
1. The output of the commodity is too large.
2. Too much pollution is produced.

26 Chapter 2 The Economic Approach
FIGURE 2.5 The Market for Steel
3. The prices of products responsible for pollution are too low.
4. As long as the costs are external, no incentives to search for ways to yield less
pollution per unit of output are introduced by the market.
5. Recycling and reuse of the polluting substances are discouraged because
release into the environment is so inefficiently cheap.
The effects of a market imperfection for one commodity end up affecting the
demands for raw materials, labor, and so on. The ultimate effects are felt through
the entire economy.
Types of Externalities
External effects, or externalities, can be positive or negative. Historically, the terms
external diseconomy and external economy have been used to refer, respectively, to cir-
cumstances in which the affected party is damaged by or benefits from the external-
ity. Clearly, the water pollution example represents an external diseconomy.
External economies are not hard to find, however. Private individuals who preserve
a particularly scenic area provide an external economy to all who pass. Generally,
when external economies are present, the market will undersupply the resources.
One other distinction is important. One class of externalities, known as pecuniary
externalities, does not present the same kinds of problems as pollution does.
Pecuniary externalities arise when the external effect is transmitted through altered
prices. Suppose that a new firm moves into an area and drives up the rental price of
land. That increase creates a negative effect on all those paying rent and, therefore,
is an external diseconomy.
Price
(dollars
per unit)
Quantity
(units)
P*
P
m
0 Q* Q
m
MC
s
MC
p
D

27Externalities as a Source of Market Failure
Shrimp Farming Externalities in Thailand
In the Tha Po village on the coast of Surat Thani Province in Thailand, more than half
of the 1,100 hectares of mangrove swamps have been cleared for commercial
shrimp farms. Although harvesting shrimp is a lucrative undertaking, mangroves
serve as nurseries for fish and as barriers for storms and soil erosion. Following the
destruction of the local mangroves, Tha Po villagers experienced a decline in fish
catch and suffered storm damage and water pollution. Can market forces be
trusted to strike the efficient balance between preservation and development for
the remaining mangroves?
Calculations by economists Sathirathai and Barbier (2001) demonstrated that
the value of the ecological services that would be lost from further destruction
of the mangrove swamps exceeded the value of the shrimp farms that would take
their place. Preservation of the remaining mangrove swamps would be the
efficient choice.
Would a potential shrimp-farming entrepreneur make the efficient choice?
Unfortunately, the answer is no. This study estimated the economic value of
mangroves in terms of local use of forest resources, offshore fishery linkages, and
coastal protection to be in the range of $27,264–$35,921 per hectare. In contrast,
the economic returns to shrimp farming, once they are corrected for input
subsidies and for the costs of water pollution, are only $194–$209 per hectare.
However, as shrimp farmers are heavily subsidized and do not have to take into
account the external costs of pollution, their financial returns are typically
$7,706.95–$8,336.47 per hectare. In the absence of some sort of external control
imposed by collective action, development would be the normal, if inefficient,
result. The externalities associated with the ecological services provided by the
mangroves support a biased decision that results in fewer social net benefits, but
greater private net benefits.
Source
: Suthawan Sathirathai and Edward B. Barbier. “Valuing Mangrove Conservation in Southern
Thailand” CONTEMPORARY ECONOMIC POLICY, Vol. 19, No. 2 (April 2001), pp. 109–122.
EXAMPLE
2.2
This pecuniary diseconomy, however, does not cause a market failure because
the resulting higher rents are reflecting the scarcity of land. The land market pro-
vides a mechanism by which the parties can bid for land; the resulting prices reflect
the value of the land in its various uses. Without pecuniary externalities, the price
signals would fail to sustain an efficient allocation.
The pollution example is not a pecuniary externality because the effect is not
transmitted through prices. In this example, prices do not adjust to reflect the
increasing waste load. The damage to the water resource is not reflected in the steel
firm’s costs. An essential feedback mechanism that is present for pecuniary exter-
nalities is not present for the pollution case.
The externalities concept is a broad one, covering a multitude of sources of
market failure (Example 2.2 illustrates one). The next step is to investigate some
specific circumstances that can give rise to externalities.

28 Chapter 2 The Economic Approach
Improperly Designed Property
Rights Systems
Other Property Rights Regimes
2
Private property is, of course, not the only possible way of defining entitlements to
resource use. Other possibilities include state-property regimes (where the govern-
ment owns and controls the property), common-property regimes (where the
property is jointly owned and managed by a specified group of co-owners), and res
nullius or open-access regimes (in which no one owns or exercises control over the
resources). All of these create rather different incentives for resource use.
State-property regimes exist not only in former communist countries, but also
to varying degrees in virtually all countries of the world. Parks and forests, for
example, are frequently owned and managed by the government in capitalist as well
as in socialist nations. Problems with both efficiency and sustainability can arise in
state-property regimes when the incentives of bureaucrats, who implement and/or
make the rules for resource use, diverge from collective interests.
Common-property resources are those shared resources that are managed in com-
mon rather than privately. Entitlements to use common-property resources may be
formal, protected by specific legal rules, or they may be informal, protected by
tradition or custom. Common-property regimes exhibit varying degrees of
efficiency and sustainability, depending on the rules that emerge from collective
decision making. While some very successful examples of common-property
regimes exist, unsuccessful examples are even more common.
3
One successful example of a common-property regime involves the system of
allocating grazing rights in Switzerland. Although agricultural land is normally
treated as private property in Switzerland, grazing rights on the Alpine meadows
have been treated as common property for centuries. Overgrazing is protected by
specific rules, enacted by an association of users, which limit the amount of livestock
permitted on the meadow. The families included on the membership list of the asso-
ciation have been stable over time as rights and responsibilities have passed from
generation to generation. This stability has apparently facilitated reciprocity and
trust, thereby providing a foundation for continued compliance with the rules.
Unfortunately, that kind of stability may be the exception rather than the rule,
particularly in the face of heavy population pressure. The more common situation
can be illustrated by the experience of Mawelle, a small fishing village in Sri Lanka.
Initially, a complicated but effective rotating system of fishing rights was devised by
villagers to assure equitable access to the best spots and best times while protecting
the fish stocks. Over time, population pressure and the infusion of outsiders raised
demand and undermined the collective cohesion sufficiently that the traditional
rules became unenforceable, producing overexploitation of the resource and lower
incomes for all the participants.
2
This section relies on the classification system presented in Bromley (1991).
3
The two cases that follow, and many others, are discussed in Ostrom (1990).
29Improperly Designed Property Rights Systems
Res nullius property resources, the main focus of this section, can be exploited on
a first-come, first-served basis because no individual or group has the legal power
to restrict access. Open-access resources, as we shall henceforth call them, have given
rise to what has become known popularly as the “tragedy of the commons.”
The problems created by open-access resources can be illustrated by recalling the
fate of the American bison. Bison are an example of “common-pool” resources.
Common-pool resources are shared resources characterized by nonexclusivity and
divisibility. Nonexclusivity implies that resources can be exploited by anyone, while
divisibility means that the capture of part of the resource by one group subtracts it
from the amount available to the other groups. (Note the contrast between common-
pool resources and public goods, the subject of the next section.) In the early history of
the United States, bison were plentiful; unrestricted hunting access was not a problem.
Frontier people who needed hides or meat could easily get whatever they needed; the
aggressiveness of any one hunter did not affect the time and effort expended by other
hunters. In the absence of scarcity, efficiency was not threatened by open access.
As the years slipped by, however, the demand for bison increased and scarcity
became a factor. As the number of hunters increased, eventually every additional
unit of hunting activity increased the amount of time and effort required to
produce a given yield of bison.
Consider graphically how various property rights structures (and the resulting
level of harvest) affect the scarcity rent (in this case, equivalent to the economic
surplus received by consumers and producers), where the amount of rent is
measured as the difference between the revenues received from the harvest minus
the costs associates with producing that harvest. Figure 2.6 compares the revenue
and costs for various levels of harvest. In the top panel the revenue is calculated by
multiplying, for each level of hunting activity, the (assumed constant) price of bison
by the amount harvested. The upward sloping total cost curve simply reflects that
fact that increases in harvest effort result in higher costs. (Marginal cost is assumed
to be constant for this example.)
In terms of the top panel of Figure 2.6 the total surplus associated with any level
of effort is measured as the vertical difference between the total revenue curve and
the total cost curve for that level of harvest.
In the bottom panel the marginal revenue curve is downward sloping (despite
the constant price) because as the amount of hunting effort increases, the resulting
bison population size decreases. Smaller populations support smaller harvests per
unit of effort expended.
The efficient level of hunting activity in this model (E
1
) maximizes the surplus. This
can be seen graphically in two different ways. First, E
1
maximizes the vertical difference
between the two curves in the top panel. Second, in the bottom panel E
1
is the level
where the marginal revenue, which records the addition to the surplus from an addi-
tional unit of effort, crosses the marginal cost curve, which measures the reduction in
the surplus due to the additional cost of expending that last unit of effort. These are
simply two different (mathematically equivalent) ways to demonstrate the same out-
come. (The curves in the bottom panel are derived from the curves in the top panel.)
With all hunters having completely unrestricted access to the bison, the result-
ing allocation would not be efficient. No individual hunter would have an incentive

30 Chapter 2 The Economic Approach
to protect scarcity rent by restricting hunting effort. Individual hunters, without
exclusive rights, would exploit the resource until their total benefit equaled total
cost, implying a level of effort equal to (E
2
). Excessive exploitation of the herd
occurs because individual hunters cannot appropriate the scarcity rent; therefore,
they ignore it. One of the losses from further exploitation that could be avoided by
exclusive owners—the loss of scarcity rent due to overexploitation—is not part of
the decision-making process of open-access hunters.
Two characteristics of this formulation of the open-access allocation are worth
noting: (1) In the presence of sufficient demand, unrestricted access will cause
resources to be overexploited; (2) the scarcity rent is dissipated; no one is able to
appropriate the rent, so it is lost.
FIGURE 2.6 Bison Harvesting
Total
Benefits
or Cost
(dollars)
Marginal
Benefit
or Cost
(dollars
per unit)
Marginal
Benefit
Average
Benefit
Average Cost =
Marginal Cost
Total
Costs
Total
Benefits
E
1
Harvest
Effort
Harvest
Effort
E
2