Tan S.T. Finite Mathematics for the Managerial, Life, and Social Sciences
Подождите немного. Документ загружается.


EXAMPLE 1
Find the variance of the random variable X and of the random vari-
able Y whose probability distributions are shown in the following table. These are
the probability distributions associated with the histograms shown in Figure 9a–b.
xP(X x) yP(Y y)
1 .05 1 .2
2 .075 2 .15
3.2 3 .1
4 .375 4 .15
5 .15 5 .05
6.1 6 .1
7 .05 7 .25
Solution
The mean of the random variable X is given by
Therefore, using Equation (5) and the data from the probability distribution of X, we
find that the variance of X is given by
Next, we find that the mean of the random variable Y is given by
and so the variance of Y is given by
Note that Var(X) is smaller than Var(Y ), which confirms our earlier observations
about the spread (or dispersion) of the probability distribution of X and Y, respec-
tively.
Standard Deviation
Because Equation (5), which gives the variance of the random variable X, involves the
squares of the deviations, the unit of measurement of Var(X) is the square of the unit
of measurement of the values of X. For example, if the values assumed by the random
variable X are measured in units of a gram, then Var(X ) will be measured in units
involving the square of a gram. To remedy this situation, one normally works with the
square root of Var(X) rather than Var(X) itself. The former is called the standard devi-
ation of X.
5.2
1.1216 42
2
1.25217 42
2
1.15214 42
2
1.05215 42
2
Var1Y2 1.2211 42
2
1.15212 42
2
1.1213 42
2
4
1621.12 1721.252
m
Y
1121.22 1221.152 1321.12 1421.152 1521.052
1.95
1.1216 42
2
1.05217 42
2
1.375214 42
2
1.15215 42
2
Var1X2 1.05211 42
2
1.075212 42
2
1.2213 42
2
4
1621.12 1721.052
m
X
1121.052 1221.0752 1321.22 1421.3752 1521.152
442 8 PROBABILITY DISTRIBUTIONS AND STATISTICS
87533_08_ch8_p417-482 1/30/08 10:09 AM Page 442

Standard Deviation of a Random Variable X
The standard deviation of a random variable X denoted (pronounced
“sigma”), is defined by
(8)
where x
1
, x
2
, . . . , x
n
denote the values assumed by the random variable X and
p
1
P(X x
1
), p
2
P(X x
2
), . . . , p
n
P(X x
n
).
2p
1
1x
1
m 2
2
p
2
1x
2
m 2
2
p
p
n
1x
n
m 2
2
s 1Var1X2
EXAMPLE 2
Find the standard deviations of the random variables X and Y of
Example 1.
Solution
From the results of Example 1, we have Var(X) 1.95 and Var(Y ) 5.2.
Taking their respective square roots, we have
APPLIED EXAMPLE 3
Packaging Let X and Y denote the random
variables whose values are the weights of the brand A and brand B potato
chips, respectively (see page 441). Compute the means and standard deviations of
X and Y and interpret your results.
Solution
The probability distributions of X and Y may be computed from the
given data as follows:
The means of X and Y are given by
X
(.1)(15.8) (.2)(15.9) (.4)(16.0) (.2)(16.1)
(.1)(16.2)
16
Y
(.2)(15.7) (.1)(15.8) (.1)(15.9) (.1)(16.0)
(.2)(16.1) (.2)(16.2) (.1)(16.3)
16
⬇ 2.28
s
Y
15.2
⬇ 1.40
s
X
11.95
8.3 VARIANCE AND STANDARD DEVIATION 443
Brand A Brand B
Relative Frequency Relative Frequency
x of Occurrence P(X ⫽ x) y of Occurrence P(Y ⫽ y)
15.8 1 .1 15.7 2 .2
15.9 2 .2 15.8 1 .1
16.0 4 .4 15.9 1 .1
16.1 2 .2 16.0 1 .1
16.2 1 .1 16.1 2 .2
16.2 2 .2
16.3 1 .1
87533_08_ch8_p417-482 1/30/08 10:09 AM Page 443

Therefore,
Var(X) (.1)(15.8 16)
2
(.2)(15.9 16)
2
(.4)(16 16)
2
(.2)(16.1 16)
2
(.1)(16.2 16)
2
0.012
Var(Y) (.2)(15.7 16)
2
(.1)(15.8 16)
2
(.1)(15.9 16)
2
(.1)(16 16)
2
(.2)(16.1 16)
2
(.2)(16.2 16)
2
(.1)(16.3 16)
2
0.042
so the standard deviations are
The mean of X and that of Y are both equal to 16. Therefore, the average weight
of a package of potato chips of either brand is 16 ounces. However, the standard
deviation of Y is greater than that of X. This tells us that the weights of the pack-
ages of brand B potato chips are more widely dispersed about the common mean
of 16 than are those of brand A.
⬇ 0.20
10.042
s
Y
1Var 1Y2
⬇ 0.11
10.012
s
X
1Var 1X2
444 8 PROBABILITY DISTRIBUTIONS AND STATISTICS
Explore & Discuss
A useful alternative formula for
the variance is
2
E(X
2
)
2
where E(X
2
) is the expected
value of X
2
.
1. Establish the validity of the
formula.
2. Use the formula to verify the
calculations in Example 3.
Explore & Discuss
Suppose the mean weight of m packages of brand A potato chips is
1
and the standard
deviation from the mean of their weight distribution is
1
. Also suppose the mean weight of
n packages of brand B potato chips is
2
and the standard deviation from the mean of their
weight distribution is
2
.
1. Show that the mean of the weights of packages of brand A and brand B combined is
2. If
1
2
, show that the standard deviation from the mean of the combined-weight dis-
tribution is
3. Refer to Example 3, page 443. Using the results of parts 1 and 2, find the mean and the
standard deviation of the combined-weight distribution.
s a
ms
2
1
ns
2
2
m n
b
1/2
m
mm
1
nm
2
m n
Chebychev’s Inequality
The standard deviation of a random variable X may be used in statistical estima-
tions. For example, the following result, derived by the Russian mathematician P. L.
Chebychev (1821–1894), gives a bound on the proportion of the values of X lying
within k standard deviations of the expected value of X.
87533_08_ch8_p417-482 1/30/08 10:09 AM Page 444
Chebychev’s Inequality
Let X be a random variable with expected value and standard deviation .
Then the probability that a randomly chosen outcome of the experiment lies
between k and k is at least 1 (1/k
2
); that is,
(9)P 1m ks X m ks 2 1
1
k
2
To shed some light on this result, let’s take k 2 in Inequality (9) and compute
This tells us that at least 75% of the outcomes of the experiment lie within 2 standard
deviations of the mean (Figure 10). Taking k 3 in Inequality (9), we have
This tells us that at least 89% of the outcomes of the experiment lie within 3 standard
deviations of the mean (Figure 11).
EXAMPLE 4
A probability distribution has a mean of 10 and a standard deviation
of 1.5. Use Chebychev’s inequality to find a bound on the probability that an out-
come of the experiment lies between 7 and 13.
Solution
Here, 10 and 1.5. To determine the value of k, note that
k 7 and k 13. Substituting the appropriate values for and , we
find k 2. Using Chebychev’s Inequality (9), we see that a bound on the probabil-
ity that an outcome of the experiment lies between 7 and 13 is given by
—that is, at least 75%.
Note
The results of Example 4 tell us that at least 75% of the outcomes of the exper-
iment lie between 10 2 and 10 2—that is, between 7 and 13.
APPLIED EXAMPLE 5
Industrial Accidents Great Northwest Lumber
Company employs 400 workers in its mills. It has been estimated that X,
the random variable measuring the number of mill workers who have industrial
accidents during a 1-year period, is distributed with a mean of 40 and a standard
deviation of 6. Using Chebychev’s Inequality (9), find a bound on the probability
that the number of workers who will have an industrial accident over a 1-year
period is between 30 and 50, inclusive.
3
4
P 17 X 13 2 1 a
1
2
2
b
+
− 3
−
− 2
+ 2
+ 3
P 1m 3s X m 3s 2 1
1
3
2
1
1
9
8
9
⬇ .89
P 1m 2s X m 2s 2 1
1
2
2
1
1
4
.75
8.3 VARIANCE AND STANDARD DEVIATION 445
FIGURE 11
At least 89% of the outcomes fall within
this interval
− 2
−
+
+ 2
FIGURE 10
At least 75% of the outcomes fall within
this interval
87533_08_ch8_p417-482 1/30/08 10:09 AM Page 445

1. Compute the mean, variance, and standard deviation of the
random variable X with probability distribution as follows:
x 4 3 10 2 5
P(X x) .1 .1 .2 .3 .1 .2
2. James recorded the following travel times (the length of
time in minutes it took him to drive to work) on 10 con-
secutive days:
55 50 52 48 50 52 46 48 50 51
Calculate the mean and standard deviation of the random
variable X associated with these data.
Solutions to Self-Check Exercises 8.3 can be found on
page 450.
446
8 PROBABILITY DISTRIBUTIONS AND STATISTICS
Solution
Here, 40 and 6. We wish to estimate P(30 X 50). To
use Chebychev’s Inequality (9), we first determine the value of k from the
equation
k 30 or k 50
Since 40 and 6 in this case, we see that k satisfies
40 6k 30 and 40 6k 50
from which we deduce that . Thus, a bound on the probability that the num-
ber of mill workers who will have an industrial accident during a 1-year period is
between 30 and 50 is given by
—that is, at least 64%.
16
25
P 130 X 50 2 1
1
1
5
3
2
2
k
5
3
8.3 Exercises
8.3 Self-Check Exercises
8.3 Concept Questions
1. a. What is the variance of a random variable X?
b. What is the standard deviation of a random variable X?
2. What does Chebychev’s inequality measure?
In Exercises 1–6, the probability distribution of a random
variable X is given. Compute the mean, variance, and
standard deviation of X.
1. x 1234
P(X x) .4 .3 .2 .1
2. x 4 20 24
P(X x) .1 .2 .3 .1 .3
3. x 2 10 1 2
P(X x) 1/16 4/16 6/16 4/16 1/16
4. x 10 11 12 13 14 15
P(X x) 1/8 2/8 1/8 2/8 1/8 1/8
5. x 430 480 520 565 580
P(X x) .1 .2 .4 .2 .1
6. x 198 195 193 188 185
P(X x) .15 .30 .10 .25 .20
87533_08_ch8_p417-482 1/30/08 10:09 AM Page 446
8.3 VARIANCE AND STANDARD DEVIATION 447
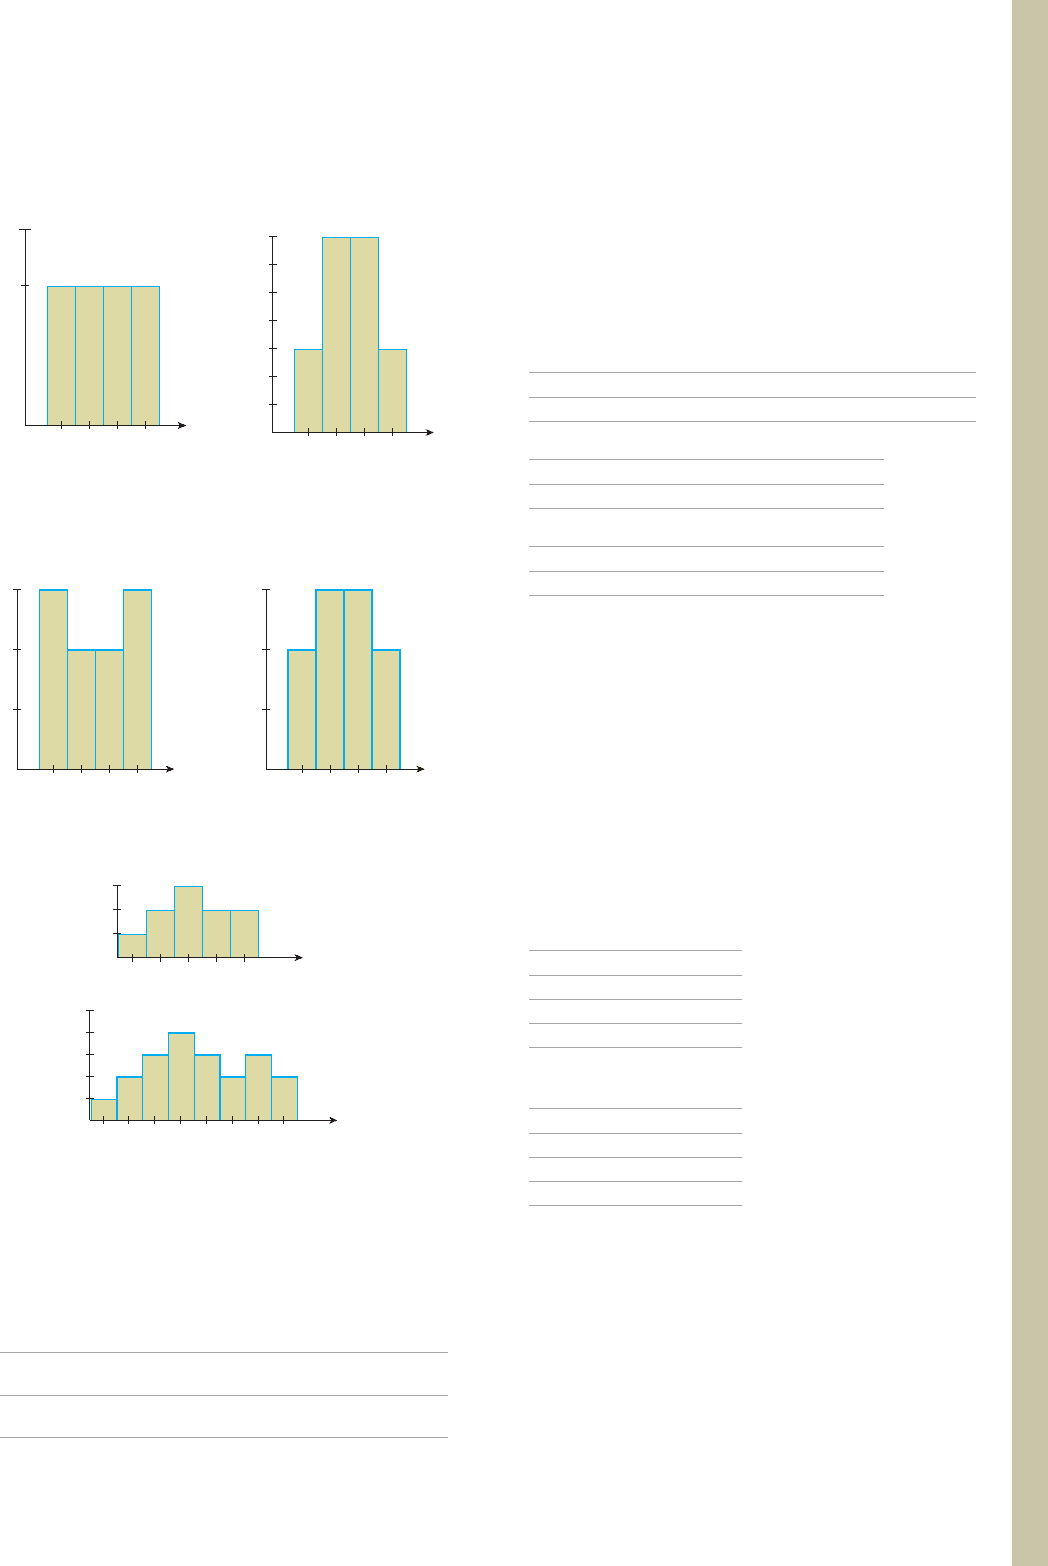
7. The following histograms represent the probability distri-
butions of the random variables X and Y. Determine by
inspection which probability distribution has the larger
variance.
(a) (b)
8. The following histograms represent the probability distri-
butions of the random variables X and Y. Determine by
inspection which probability distribution has the larger
variance.
(a) (b)
In Exercises 9 and 10, find the variance of the probabil-
ity distribution for the histogram shown.
9.
10.
11. An experiment consists of rolling an eight-sided die (num-
bered 1 through 8) and observing the number that appears
uppermost. Find the mean and variance of this experiment.
12. D
RIVING
A
GE
R
EQUIREMENTS
The minimum age require-
ment for a regular driver’s license differs from state to
state. The frequency distribution for this age requirement
in the 50 states is given in the following table:
Minimum
Age 15 16 17 18 19 21
Frequency of
Occurrence 1154281 1
x
.25
.20
.15
.10
.05
12345678
12345
.3
.2
.1
x
1234
y
.3
.2
.1
1234
x
.3
.2
.1
1234
y
.35
.15
1234
.25
x
a. Describe a random variable X that is associated with
these data.
b. Find the probability distribution for the random vari-
able X.
c. Compute the mean, variance, and standard deviation
of X.
13. B
IRTHRATES
The birthrates in the United States for the
years 1991–2000 are given in the following table. (The
birthrate is the number of live births/1000 population.)
Year 1991 1992 1993 1994
Birthrate 16.3 15.9 15.5 15.2
Year 1995 1996 1997
Birthrate 14.8 14.7 14.5
Year 1998 1999 2000
Birthrate 14.6 14.5 14.7
a. Describe a random variable X that is associated with
these data.
b. Find the probability distribution for the random vari-
able X.
c. Compute the mean, variance, and standard deviation
of X.
Source: National Center for Health Statistics
14. I
NVESTMENT
A
NALYSIS
Paul Hunt is considering two busi-
ness ventures. The anticipated returns (in thousands of dol-
lars) of each venture are described by the following proba-
bility distributions:
Venture A
Earnings Probability
20 .3
40 .4
50 .3
Venture B
Earnings Probability
15 .2
30 .5
40 .3
a. Compute the mean and variance for each venture.
b. Which investment would provide Paul with the higher
expected return (the greater mean)?
c. In which investment would the element of risk be less
(that is, which probability distribution has the smaller
variance)?
15. I
NVESTMENT
A
NALYSIS
Rosa Walters is considering investing
$10,000 in two mutual funds. The anticipated returns from
87533_08_ch8_p417-482 1/30/08 10:09 AM Page 447

price appreciation and dividends (in hundreds of dollars) are
described by the following probability distributions:
Mutual Fund A
Returns Probability
4.2
8.5
10 .3
Mutual Fund B
Returns Probability
2.2
6.4
8.4
a. Compute the mean and variance associated with the
returns for each mutual fund.
b. Which investment would provide Rosa with the higher
expected return (the greater mean)?
c. In which investment would the element of risk be less
(that is, which probability distribution has the smaller
variance)?
16. The distribution of the number of chocolate chips (x) in a
cookie is shown in the following table. Find the mean and
the variance of the number of chocolate chips in a cookie.
x 012
P(X x) .01 .03 .05
x 345
P(X x) .11 .13 .24
x 678
P(X x) .22 .16 .05
17. Formula (5) can also be expressed in the form
Find the variance of the distribution of Exercise 1 using
this formula.
18. Find the variance of the distribution of Exercise 16 using
the formula
19. H
OUSING
P
RICES
A survey was conducted by the market
research department of the National Real Estate Company
among 500 prospective buyers in a large metropolitan area
to determine the maximum price a prospective buyer
would be willing to pay for a house. From the data col-
lected, the distribution that follows was obtained. Compute
the mean, variance, and standard deviation of the maxi-
mum price x (in thousands of dollars) that these buyers
were willing to pay for a house.
Var1X2 1p
1
x
2
1
p
2
x
2
2
p
p
n
x
2
n
2 m
2
Var1X2 1p
1
x
2
1
p
2
x
2
2
p
p
n
x
2
n
2 m
2
Maximum Price
Considered, xP(X x)
280
290
300
310
320
350
380
400
450
20. A
VERAGE
R
ENT
A study of the records of 85,000 apartment
units in the greater Boston area revealed the following
data:
Year 2002 2003 2004 2005 2006
Average Rent, $ 1352 1336 1317 1308 1355
Find the average of the average rent for the 5 yr in ques-
tion. What is the standard deviation for these data?
Source: Northeast Apartment Advisors Inc.
21. O
CCUPANCY
R
ATE
A study of the records of 85,000 apart-
ment units in the greater Boston area revealed the follow-
ing data:
Year 2002 2003 2004 2005 2006
Occupancy
Rate, % 95.6 94.7 95.2 95.1 96.1
Find the average occupancy rate for the 5 yr in question.
What is the standard deviation for these data?
Source: Northeast Apartment Advisors Inc.
22. E
XAM
S
CORES
The following table gives the scores of 30
students in a mathematics examination:
Scores 90–99 80–89 70–79 60–69 50–59
Students 481242
Find the mean and the standard deviation of the distribu-
tion of the given data.
Hint: Assume that all scores lying within a group interval take the
middle value of that group.
23. B
OSTON
H
OMICIDES
The percentage of Boston homicide
cases solved each year from 2000 through 2006 is summa-
rized in the following table:
Year 2000 2001 2002 2003 2004 2005 2006
Percent 49 50 70 64 36 29 38
Find the average percent of Boston homicide cases solved
per year for 2000 through 2006. What is the standard devi-
ation for these data?
Source: Boston Police Department
5
500
55
500
90
500
90
500
70
500
85
500
75
500
20
500
10
500
448 8 PROBABILITY DISTRIBUTIONS AND STATISTICS
87533_08_ch8_p417-482 1/30/08 10:09 AM Page 448

24. M
ARITAL
S
TATUS OF
M
EN
The number of married men (in
thousands) between the ages of 20 and 44 in the United
States in 1998 is given in the following table:
Age 20–24 25–29 30–34 35–39 40–44
Men 1332 4219 6345 7598 7633
Find the mean and the standard deviation of the given data.
Hint: See the hint for Exercise 22.
Source: U.S. Census Bureau
25. M
AIL
D
ELIVERED
The total number of pieces of mail deliv-
ered (in billions) each year from 2002 through 2006 is
given in the following table:
Year 2002 2003 2004 2005 2006
Number 203 202 206 212 213
What is the average total number of pieces of mail deliv-
ered from 2002 through 2006? What is the standard devia-
tion for these data?
Source: U.S. Postal Service
26. TV
S IN THE
H
OME
In a survey, consumers were asked how
many television sets they have in their home. The results
are summarized in the following table:
TVs 12345
Respondents, % 13.9 26.5 28.6 14.8 16.2
Find the average number of TVs in the home of the respon-
dents. What is the standard deviation for these data?
Source: RBC Capital Markets
27. H
OURS
W
ORKED IN
S
OME
C
OUNTRIES
The number of aver-
age hours worked per year per worker in the United States
and five European countries in 2002 is given in the fol-
lowing table:
Great West
Country U.S. Spain Britain France Germany Norway
Average
Hours 1815 1807 1707 1545 1428 1342
Worked
Find the average of the average hours worked per worker
in 2002 for workers in the six countries. What is the stan-
dard deviation for these data?
Source: Office of Economic Cooperation and Development
28. A
MERICANS WITHOUT
H
EALTH
I
NSURANCE
The number of
Americans without health insurance, in millions, from
1995 through 2002 is summarized in the following table:
Year 1995 1996 1997 1998 1999 2000 2001 2002
Number 40.7 41.8 43.5 44.5 40.2 39.9 41.2 43.6
Find the average number of Americans without health
insurance in the period from 1995 through 2002. What is
the standard deviation for these data?
Source: U.S. Census Bureau
29. A
CCESS TO
C
APITAL
One of the key determinants of eco-
nomic growth is access to capital. Using 54 variables to cre-
ate an index of 1–7, with 7 being best possible access to
capital, Milken Institute ranked the following as the top ten
nations (although technically Hong Kong is not a nation) by
the ability of their entrepreneurs to gain access to capital:
Hong
Country Kong Netherlands U.K. Singapore Switzerland
Index 5.70 5.59 5.57 5.56 5.55
Country U.S. Australia Finland Germany Denmark
Index 5.55 5.31 5.24 5.23 5.22
Find the mean of the indices of the top ten nations. What is
the standard deviation for these data?
Source: Milken Institute
30. A
CCESS TO
C
APITAL
Refer to Exercise 29. Milken Institute
also ranked the following as the ten worst-performing
nations by the ability of their entrepreneurs to gain access
to capital:
Country Peru Mexico Bulgaria Brazil Indonesia
Index 3.76 3.70 3.66 3.50 3.46
Country Colombia Turkey Argentina Venezuela Russia
Index 3.46 3.43 3.20 2.88 2.19
Find the mean of the indices of the ten worst-performing
nations. What is the standard deviation for these data?
Source: Milken Institute
31. S
ALES OF
V
EHICLES
The seasonally adjusted annualized
sales rate for U.S. cars and light trucks, in millions of units,
for May 2003 through April 2004 are given in the follow-
ing tables:
2003
MJ JASOND
16.5 16.5 17.0 18.5 17.0 16.0 17.0 18.0
2004
JFMA
16.3 16.5 16.8 16.5
What is the average seasonally adjusted annualized sales rate
for U.S. motor vehicles for the period in question? What is
the standard deviation for these data?
Source: Autodata
8.3 VARIANCE AND STANDARD DEVIATION 449
87533_08_ch8_p417-482 1/30/08 10:09 AM Page 449

32. E
LECTION
T
URNOUT
The percent of the voting age popula-
tion who cast ballots in presidential elections from 1932
through 2000 are given in the following table:
Election 1932 1936 1940 1944 1948 1952 1956 1960 1964
Year
Turnout, % 53 57 59 56 51 62 59 59 62
Election 1968 1972 1976 1980 1984 1988 1992 1996 2000
Year
Turnout % 61 55 54 53 53 50 55 49 51
Find the mean and the standard deviation of the given data.
Source: Federal Election Commission
33. A probability distribution has a mean of 42 and a standard
deviation of 2. Use Chebychev’s inequality to find a bound
on the probability that an outcome of the experiment lies
between
a. 38 and 46. b. 32 and 52.
34. A probability distribution has a mean of 20 and a standard
deviation of 3. Use Chebychev’s inequality to find a bound
on the probability that an outcome of the experiment lies
between
a. 15 and 25. b. 10 and 30.
35. A probability distribution has a mean of 50 and a standard
deviation of 1.4. Use Chebychev’s inequality to find the
value of c that guarantees the probability is at least 96%
that an outcome of the experiment lies between 50 c and
50 c.
36. Suppose X is a random variable with mean and standard
deviation . If a large number of trials is observed, at least
what percentage of these values is expected to lie between
2 and 2 ?
37. P
RODUCT
R
ELIABILITY
The deluxe model hair dryer pro-
duced by Roland Electric has a mean expected lifetime of
24 mo with a standard deviation of 3 mo. Find a bound on
the probability that one of these hair dryers will last be-
tween 20 and 28 mo.
38. P
RODUCT
R
ELIABILITY
A Christmas tree light has an
expected life of 200 hr and a standard deviation of 2 hr.
a. Find a bound on the probability that one of these Christ-
mas tree lights will last between 190 hr and 210 hr.
b. Suppose 150,000 of these Christmas tree lights are used
by a large city as part of its Christmas decorations. Es-
timate the number of lights that are likely to require
replacement between 180 hr and 220 hr of use.
39. S
TARTING
S
ALARIES
The mean annual starting salary of a
new graduate in a certain profession is $52,000 with a stan-
dard deviation of $500. Find a bound on the probability
that the starting salary of a new graduate in this profession
will be between $50,000 and $54,000?
40. Q
UALITY
C
ONTROL
Sugar packaged by a certain machine has
a mean weight of 5 lb and a standard deviation of 0.02 lb.
For what values of c can the manufacturer of the machinery
claim that the sugar packaged by this machine has a weight
between 5 c and 5 c lb with probability at least 96%?
In Exercises 41 and 42, determine whether the statement
is true or false. If it is true, explain why it is true. If it is
false, give an example to show why it is false.
41. Both the variance and the standard deviation of a random
variable measure the spread of a probability distribution.
42. Chebychev’s inequality is useless when k 1.
450
8 PROBABILITY DISTRIBUTIONS AND STATISTICS
1. The mean of the random variable X is
(4)(.1) (3)(.1) (1)(.2)
(0)(.3) (2)(.1) (5)(.2)
0.3
The variance of X is
Var(X) (.1)(4 0.3)
2
(.1)(3 0.3)
2
(.2)(1 0.3)
2
(.3)(0 0.3)
2
(.1)(2 0.3)
2
(.2)(5 0.3)
2
8.01
The standard deviation of X is
s 1Var 1X2 18.01 ⬇ 2.83
2. We first compute the probability distribution of X from the
given data as follows:
Relative Frequency
x of Occurrence P(X x)
46 1 .1
48 2 .2
50 3 .3
51 1 .1
52 2 .2
55 1 .1
The mean of X is
(.1)(46) (.2)(48) (.3)(50)
(.1)(51) (.2)(52) (.1)(55)
50.2
8.3 Solutions to Self-Check Exercises
87533_08_ch8_p417-482 1/30/08 10:09 AM Page 450

The variance of X is
Var(X) (.1)(46 50.2)
2
(.2)(48 50.2)
2
(.3)(50 50.2)
2
(.1)(51 50.2)
2
(.2)(52 50.2)
2
(.1)(55 50.2)
2
5.76
from which we deduce the standard deviation
2.4
s 15.76
8.3 VARIANCE AND STANDARD DEVIATION 451
USING
TECHNOLOGY
Finding the Mean and Standard Deviation
The calculation of the mean and standard deviation of a random variable is facilitated
by the use of a graphing utility.
APPLIED EXAMPLE 1
Age Distribution of Company Directors A
survey conducted in 1995 of the Fortune 1000 companies revealed the
following age distribution of the company directors:
Age 20–24 25–29 30–34 35–39 40–44 45–49 50–54
Directors 1 6 28 104 277 607 1142
Age 55–59 60–64 65–69 70–74 75–79 80–84 85–89
Directors 1413 1424 494 159 62 31 5
Source: Directorship
Let X denote the random variable taking on the values 1 through 14, where 1 cor-
responds to the age bracket 20–24, 2 corresponds to the age bracket 25–29, and
so on.
a. Plot a histogram for the given data.
b. Find the mean and the standard deviation of these data. Interpret your results.
Solution
a. Enter the values of X as x
1
1, x
2
2, . . . , x
14
14 and the corresponding
values of Y as y
1
1, y
2
6, . . . , y
14
5. Then using the
DRAW
function
from the Statistics menu of a graphing utility, we obtain the histogram shown
in Figure T1.
b. Using the appropriate function from the Statistics menu, we find that
and x ⬇ 1.6378; that is, the mean of X is ⬇ 7.9 and the stan-
dard deviation is ⬇ 1.6. Interpreting our results, we see that the average age
of the directors is in the 55–59-year-old bracket.
x ⬇ 7.9193
FIGURE T1
The histogram for the given data, using
the viewing window [0, 16] [0, 1500]
(continued)
87533_08_ch8_p417-482 1/30/08 10:09 AM Page 451