Tan S.T. Finite Mathematics for the Managerial, Life, and Social Sciences
Подождите немного. Документ загружается.

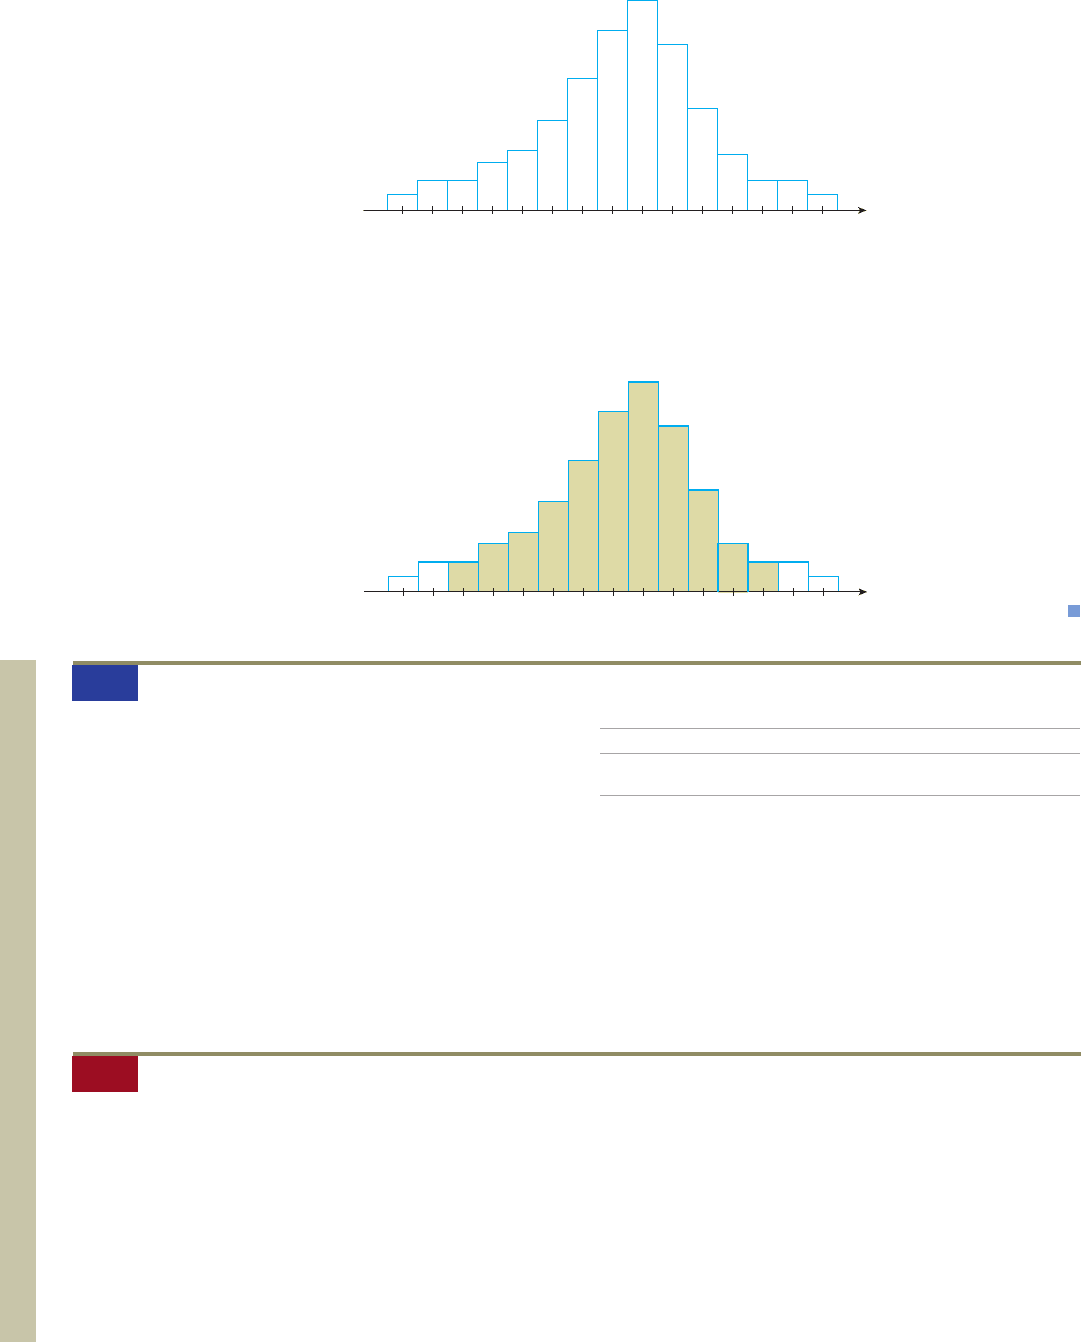
EXAMPLE 7
Suppose the probability distribution of a random variable X is repre-
sented by the histogram shown in Figure 4. Identify that part of the histogram whose
area gives the probability P(10 X 20).
Solution
The event (10 X 20) is the event consisting of outcomes related
to the values 10, 11, 12, . . . , 20 of the random variable X. The probability of this
event P(10 X 20) is therefore given by the shaded area of the histogram in
Figure 5.
x
8910 1
1 12 13 14 15 16 17 18 19 20 21 22
x
8910 1
1 12 13 14 15 16 17 18 19 20 21 22
422 8 PROBABILITY DISTRIBUTIONS AND STATISTICS
FIGURE 4
FIGURE 5
P(10 X 20)
1. Three balls are selected at random without replacement
from an urn containing four black balls and five white
balls. Let the random variable X denote the number of
black balls drawn.
a. List the outcomes of the experiment.
b. Find the value assigned to each outcome of the experi-
ment by the random variable X.
c. Find the event consisting of the outcomes to which a
value of 2 has been assigned by X.
2. The following data, extracted from the records of Dover
Public Library, give the number of books borrowed by the
library’s members over a 1-mo period:
Books 0 1 2 3 45678
Frequency of
Occurrence 780 300 412 205 98 54 57 30 6
a. Find the probability distribution of the random variable
X, where X denotes the number of books checked out
over a 1-mo period by a randomly chosen member.
b. Draw the histogram representing this probability distrib-
ution.
Solutions to Self-Check Exercises 8.1 can be found on
page 424.
8.1 Self-Check Exercises
8.1 Concept Questions
1. What is a random variable? Give an example.
2. Give an example of (a) a finite discrete random variable,
(b) an infinite discrete random variable, and (c) a continu-
ous random variable.
3. Suppose you are given the probability distribution for a
random variable X. Explain how you would construct a his-
togram for this probability distribution. What does the area
of each rectangle in the histogram represent?
87533_08_ch8_p417-482 1/30/08 10:09 AM Page 422
8.1 DISTRIBUTIONS OF RANDOM VARIABLES 423
1. Three balls are selected at random without replacement
from an urn containing four green balls and six red balls.
Let the random variable X denote the number of green balls
drawn.
a. List the outcomes of the experiment.
b. Find the value assigned to each outcome of the experi-
ment by the random variable X.
c. Find the event consisting of the outcomes to which a
value of 3 has been assigned by X.
2. A coin is tossed four times. Let the random variable X
denote the number of tails that occur.
a. List the outcomes of the experiment.
b. Find the value assigned to each outcome of the experi-
ment by the random variable X.
c. Find the event consisting of the outcomes to which a
value of 2 has been assigned by X.
3. A die is rolled repeatedly until a 6 falls uppermost. Let the
random variable X denote the number of times the die is
rolled. What are the values that X may assume?
4. Cards are selected one at a time without replacement from
a well-shuffled deck of 52 cards until an ace is drawn. Let
X denote the random variable that gives the number of
cards drawn. What values may X assume?
5. Let X denote the random variable that gives the sum of the
faces that fall uppermost when two fair dice are rolled.
Find P(X 7).
6. Two cards are drawn from a well-shuffled deck of 52 play-
ing cards. Let X denote the number of aces drawn. Find
P(X 2).
In Exercises 7–12, give the range of values that the ran-
dom variable X may assume and classify the random vari-
able as finite discrete, infinite discrete, or continuous.
7. X The number of times a die is thrown until a 2 appears
8. X The number of defective watches in a sample of eight
watches
9. X The distance in miles a commuter travels to work
10. X The number of hours a child watches television on a
given day
11. X The number of times an accountant takes the CPA
examination before passing
12. X The number of boys in a four-child family
13. The probability distribution of the random variable X is
shown in the accompanying table:
x 10 50 5101520
P(X x) .20 .15 .05 .1 .25 .1 .15
Find
a. P(X 10) b. P(X 5)
c. P(5 X 5) d. P(X 20)
14. The probability distribution of the random variable X is
shown in the accompanying table:
x 5 3 2023
P(X x) .17 .13 .33 .16 .11 .10
Find
a. P(X 0) b. P(X 3)
c. P(2 X 2)
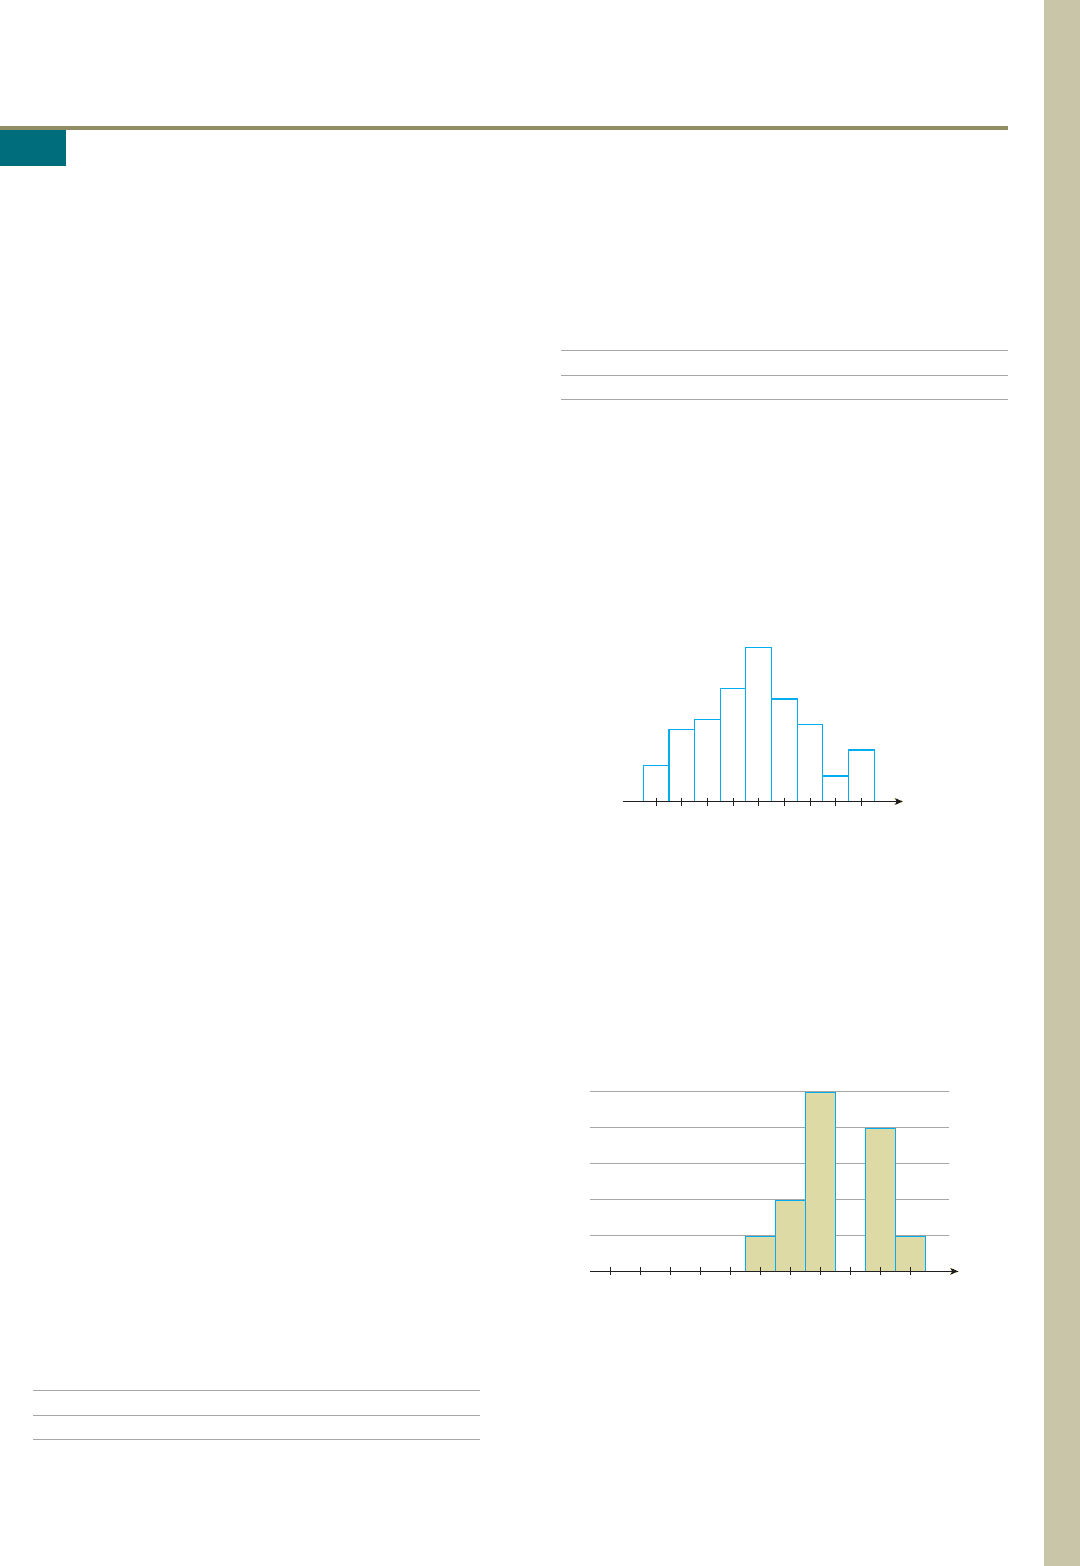
15. Suppose that the probability distribution of a random vari-
able X is represented by the accompanying histogram.
Shade that part of the histogram whose area gives the prob-
ability P(17 X 20).
16. E
XAMS
An examination consisting of ten true-or-false
questions was taken by a class of 100 students. The proba-
bility distribution of the random variable X, where X
denotes the number of questions answered correctly by a
randomly chosen student, is represented by the accompa-
nying histogram. The rectangle with base centered on the
number 8 is missing. What should be the height of this
rectangle?
17. Two dice are rolled. Let the random variable X denote the
number that falls uppermost on the first die, and let Y
denote the number that falls uppermost on the second die.
a. Find the probability distributions of X and Y.
b. Find the probability distribution of X Y.
012345678910
.25
.20
.15
.10
.05
x
12 13 14 15 16 17 18 19 20
x
8.1 Exercises
87533_08_ch8_p417-482 1/30/08 10:09 AM Page 423

18. D
ISTRIBUTION OF
F
AMILIES BY
S
IZE
A survey of 1000 fami-
lies was conducted by the Public Housing Authority in a
certain community to determine the distribution of families
by size. The results follow:
Family Size 2345678
Frequency of
Occurrence 350 200 245 125 66 10 4
a. Find the probability distribution of the random variable
X, where X denotes the number of persons in a ran-
domly chosen family.
b. Draw the histogram corresponding to the probability
distribution found in part (a).
19. W
AITING
L
INES
The accompanying data were obtained in a
study conducted by the manager of SavMore Supermarket.
In this study, the number of customers waiting in line at the
express checkout at the beginning of each 3-min interval
between 9 a.m. and 12 noon on Saturday was observed.
Customers 01 23 4
Frequency of
Occurrence 142714
Customers 5678910
Frequency of
Occurrence 810634 1
a. Find the probability distribution of the random variable
X, where X denotes the number of customers observed
waiting in line.
b. Draw the histogram representing the probability distri-
bution.
20. M
ONEY
M
ARKET
R
ATES
The interest rates paid by 30 finan-
cial institutions on a certain day for money market deposit
accounts are shown in the accompanying table:
Rate, % 6 6.25 6.55 6.56
Institutions 17 7 1
Rate, % 6.58 6.60 6.65 6.85
Institutions 1832
Let the random variable X denote the interest rate paid by
a randomly chosen financial institution on its money mar-
ket deposit accounts and find the probability distribution
associated with these data.
21. T
ELEVISION
P
ILOTS
After the private screening of a new tele-
vision pilot, audience members were asked to rate the new
show on a scale of 1 to 10 (10 being the highest rating).
From a group of 140 people, the following responses were
obtained:
Rating 123 4 5 6 7 8 9 10
Frequency of
Occurrence 1 4 3 11 23 21 28 29 16 4
Let the random variable X denote the rating given to the
show by a randomly chosen audience member. Find the
probability distribution associated with these data.
22. U.S. P
OPULATION BY
A
GE
The following table gives the
2002 age distribution of the U.S. population:
Group 1 2345 6
Age
(in years) Under 5 5–19 20–24 25–44 45–64 65 and over
Number (in
thousands) 19,527 59,716 18,611 83,009 66,088 33,590
Let the random variable X denote a randomly chosen age
group within the population. Find the probability distribu-
tion associated with these data.
Source: U.S. Census Bureau
In Exercises 23 and 24, determine whether the statement
is true or false. If it is true, explain why it is true. If it is
false, give an example to show why it is false.
23. Suppose X is a finite discrete random variable assuming
the values x
1
, x
2
, . . . , x
n
and associated probabilities p
1
,
p
2
, . . . , p
n
. Then p
1
p
2
p
n
1.
24. The area of a histogram associated with a probability dis-
tribution is a number between 0 and 1.
424
8 PROBABILITY DISTRIBUTIONS AND STATISTICS
8.1 Solutions to Self-Check Exercises
1. a. Using the accompanying tree diagram, we see that the
outcomes of the experiment are
S {BBB, BBW, BWB, BWW,
WBB, WBW, WWB, WWW}
87533_08_ch8_p417-482 1/30/08 10:09 AM Page 424
b. Using the results of part (a), we obtain the values assigned
to the outcomes of the experiment as follows:
Outcome BBB BBW BWB BWW
Value 32 2 1
Outcome WBB WBW WWB WWW
Value 21 1 0
c. The required event is {BBW, BWB, WBB}.
B
W
B
W
B
W
B
W
B
W
B
W
B
W
B B B
B B W
B W B
B W W
W B B
W B W
W W B
W W W
Outcomes
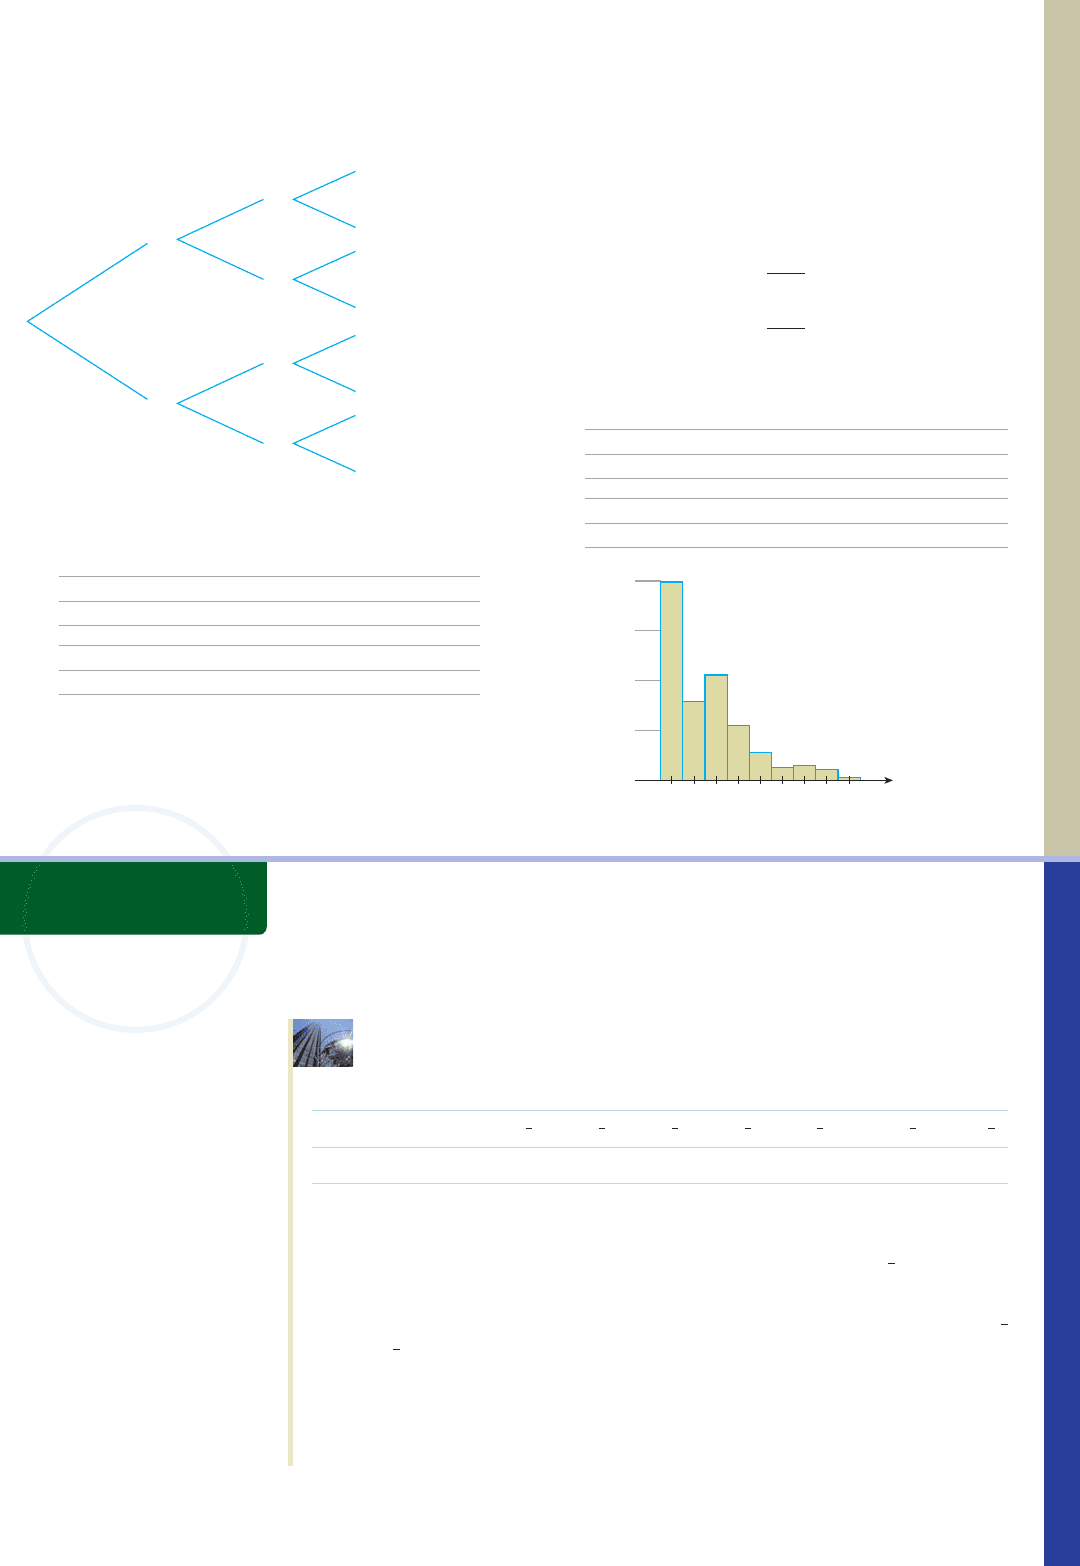
2. a. We divide each number in the bottom row of the given
table by 1942 (the sum of these numbers) to obtain the
probabilities associated with the random variable X
when X takes on the values 0, 1, 2, 3, 4, 5, 6, 7, and 8.
For example,
The required probability distribution and histogram
follow.
x 01234
P(X x) .402 .154 .212 .106 .050
x 5678
P(X x) .028 .029 .015 .003
b.
012345678
.4
.3
.2
.1
x
P1X 12
300
1942
⬇ .154
P1X 02
780
1942
⬇ .402
8.1 DISTRIBUTIONS OF RANDOM VARIABLES 425
Graphing a Histogram
Graphing Utility
A graphing utility can be used to plot the histogram for a given set of data, as illus-
trated by the following example.
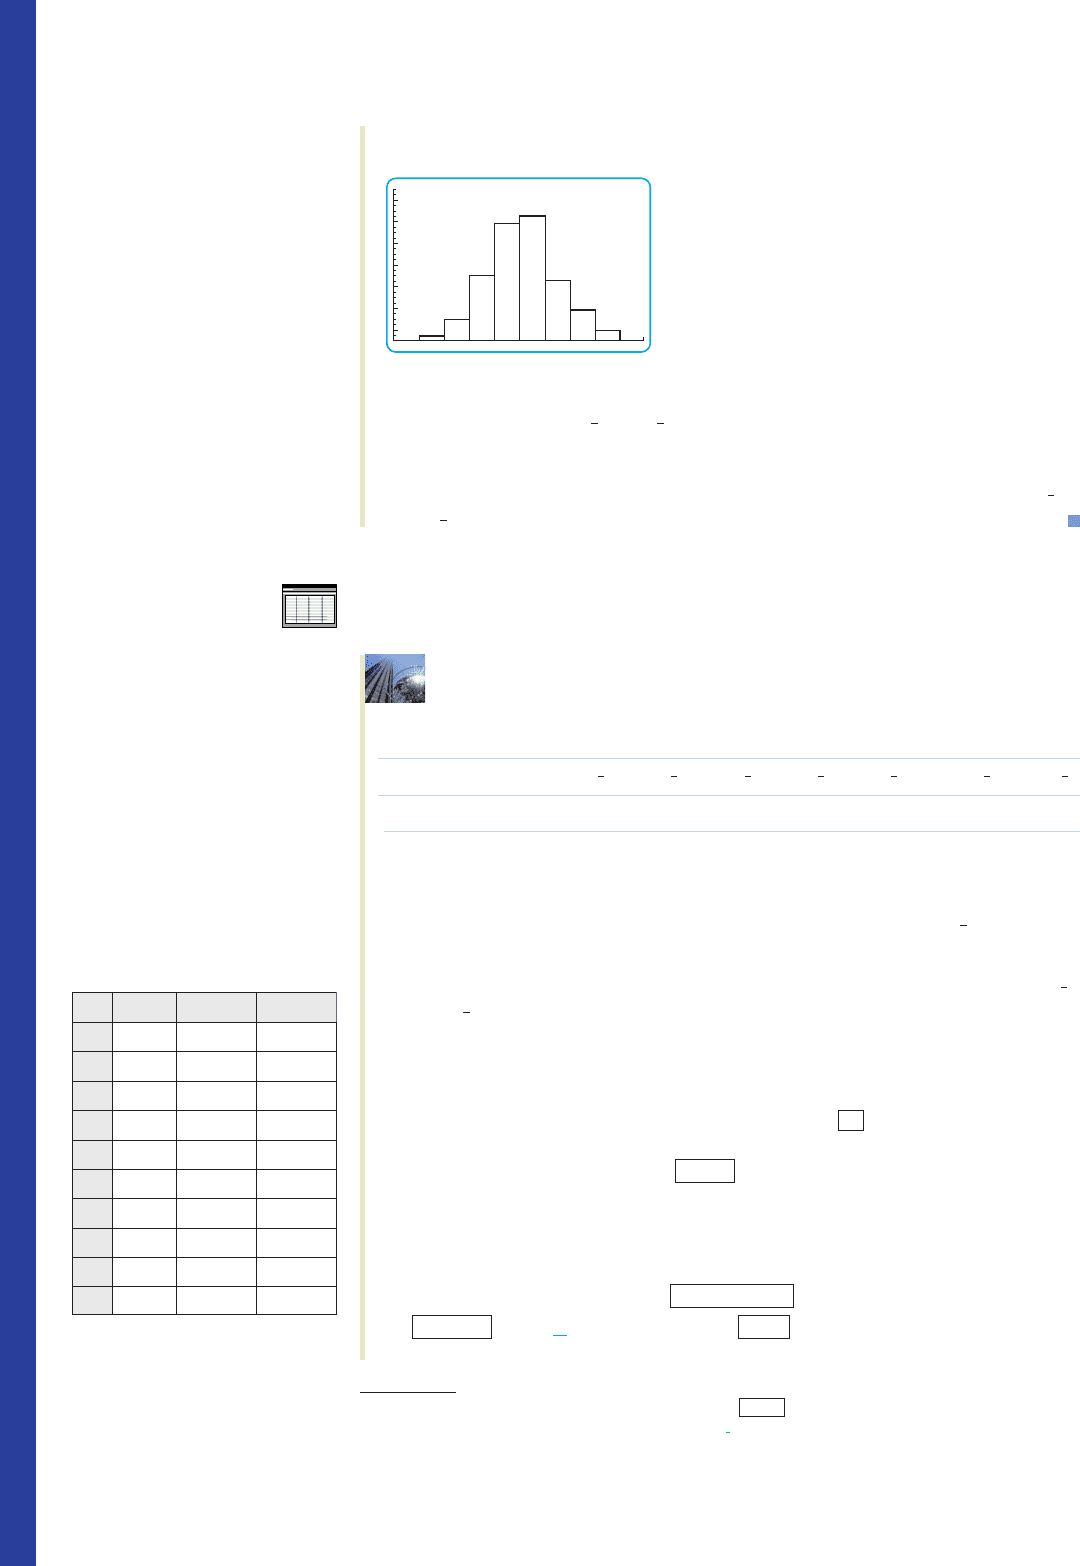
APPLIED EXAMPLE 1
A survey of 90,000 households conducted in
1995 revealed the following percentage of women who wear a shoe size
within the given ranges.
Shoe Size 5
Women, % 1 5 15 27 29 14 7 2
Source: Footwear Market Insights survey
Let X denote the random variable taking on the values 1 through 8, where 1 corre-
sponds to a shoe size less than 5, 2 corresponds to a shoe size of , and so on.
a. Plot a histogram for the given data.
b. What percent of women in the survey wear a shoe size within the ranges
or ?
Solution
a. Enter the values of X as x
1
1, x
2
2, . . . , x
8
8 and the corresponding
values of Y as y
1
1, y
2
5, . . . , y
8
2. Then using the
DRAW
function
8–8
1
2
7–7
1
2
5–5
1
2
10
1
2
10–10
1
2
9–9
1
2
8–8
1
2
7–7
1
2
6–6
1
2
5–5
1
2
(continued)
USING
TECHNOLOGY
87533_08_ch8_p417-482 1/30/08 10:09 AM Page 425
426 8 PROBABILITY DISTRIBUTIONS AND STATISTICS
from the Statistics menu, we draw the histogram shown in Figure T1.
b. The probability that a woman participating in the survey wears a shoe size
within the ranges or is given by
P(X 4) P(X 5) .27 .29 .56
This tells us that 56% of the women wear a shoe size within the ranges or
shoes.
Excel
Excel can be used to plot the histogram for a given set of data, as illustrated by the fol-
lowing example.
APPLIED EXAMPLE 2
A survey of 90,000 households conducted in
1995 revealed the following percentage of women who wear a shoe size
within the given ranges.
Shoe Size 5
Women, % 1 5 15 27 29 14 7 2
Source: Footwear Market Insights survey
Let X denote the random variable taking on the values 1 through 8, where 1 corre-
sponds to a shoe size less than 5, 2 corresponds to a shoe size of , and so on.
a. Plot a histogram for the given data.
b. What percent of women in the survey wear a shoe size within the ranges
or shoes?
Solution
a. Enter the given data in columns A and B onto a spreadsheet, as shown in Fig-
ure T2. Highlight the data in column B and select from the toolbar. The
sum of the numbers in this column (100) will appear in cell B10. In cell C2,
type =B2/100 and then press . To extend the formula to cell C9,
move the pointer to the small black box at the lower right corner of cell C2.
Drag the black that appears (at the lower right corner of cell C2) through
cell C9 and then release it. The probability distribution shown in cells C2 to
C9 will then appear on your spreadsheet. Then highlight the data in the
Probability column and select from the toolbar. Select
under C
hart type: and click twice. Under the Titles tab, enter
Histogram, X, and Probability in the appropriate boxes. Under the
NextColumn
Chart Wizard
Enter
兺
8–8
1
2
7–7
1
2
5–5
1
2
10
1
2
10–10
1
2
9–9
1
2
8–8
1
2
7–7
1
2
6–6
1
2
5–5
1
2
8–8
1
2
7–7
1
2
8–8
1
2
7–7
1
2
FIGURE T1
The histogram for the given data, using
the viewing window [0, 9] [0, 35]
Note: Boldfaced words/characters enclosed in a box (for example, ) indicate an action (click, select, or press) is
required. Words/characters printed blue (for example, Chart sub-t
ype:) indicate words/characters that appear on the screen.
Words/characters printed in a typewriter font (for example, =(—2/3)*A2+2) indicates words/characters that need to be typed
and entered).
Enter
X
AB C
Probability
1 0.01
2 0.05
3 0.15
4 0.27
5 0.29
6 0.14
7 0.07
8
1
2
3
4
5
6
7
8
9
10
0.02
Frequency
1
5
15
27
29
14
7
2
100
FIGURE T2
Completed spreadsheet for Example 2
87533_08_ch8_p417-482 1/30/08 10:09 AM Page 426

Legend tab, click the box to delete the check mark. Then click
. The histogram shown in Figure T3 will appear.
b. The probability that a woman participating in the survey wears a shoe size
within the ranges or is given by
P(X 4) P(X 5) .27 .29 .56
This tells us that 56% of the women wear a shoe size within the ranges or
.
8–8
1
2
7–7
1
2
8–8
1
2
7–7
1
2
12345678
0.35
0.3
0.25
0.2
0.15
0.1
0.05
0
Histogram
Probability
X
Finish
Show legend
8.2 EXPECTED VALUE 427
FIGURE T3
The histogram for the random
variable X
1. Graph the histogram associated with the data given in Ta-
ble 1, page 418. Compare your graph with that given in
Figure 1, page 421.
2. Graph the histogram associated with the data given in
Exercise 18, page 424.
3. Graph the histogram associated with the data given in
Exercise 19, page 424.
4. Graph the histogram associated with the data given in
Exercise 21, page 424.
TECHNOLOGY EXERCISES
8.2 Expected Value
Mean
The average value of a set of numbers is a familiar notion to most people. For exam-
ple, to compute the average of the four numbers
12, 16, 23, 37
we simply add these numbers and divide the resulting sum by 4, giving the required
average as
In general, we have the following definition.
12 16 23 37
4
88
4
22
Average, or Mean
The average, or mean, of the n numbers
x
1
, x
2
, . . . , x
n
is (read “x bar”), where
x
x
1
x
2
p
x
n
n
x
87533_08_ch8_p417-482 1/30/08 10:09 AM Page 427

(1)
10
#
22 11
#
92 12
#
162 13
#
122 14
#
82 15
#
62 16
#
42 17
#
22 18
#
12
60
⬇ 3.1
428 8 PROBABILITY DISTRIBUTIONS AND STATISTICS
APPLIED EXAMPLE 1
Waiting Times Refer to Example 6, Sec-
tion 8.1. Find the average number of cars waiting in line at the bank’s
drive-in teller at the beginning of each 2-minute interval during the period in
question.
Solution
The number of cars, together with its corresponding frequency of
occurrence, are reproduced in Table 7. Observe that the number 0 (of cars) occurs
twice, the number 1 occurs 9 times, and so on. There are altogether
2 9 16 12 8 6 4 2 1 60
numbers to be averaged. Therefore, the required average is given by
or approximately 3.1 cars.
Expected Value
Let’s reconsider the expression on the left-hand side of Equation (1), which gives the
average of the frequency distribution shown in Table 7. Dividing each term by the
denominator, the expression may be rewritten in the form
Observe that each term in the sum is a product of two factors; the first factor is the value
assumed by the random variable X, where X denotes the number of cars waiting in line,
and the second factor is just the probability associated with that value of the random
variable. This observation suggests the following general method for calculating the
expected value (that is, the average or mean) of a random variable X that assumes a
finite number of values from the knowledge of its probability distribution.
Note
The numbers x
1
, x
2
, . . . , x
n
may be positive, zero, or negative. For example,
such a number might be positive if it represents a profit and negative if it represents a
loss.
APPLIED EXAMPLE 2
Waiting Times Re-solve Example 1 by using
the probability distribution associated with the experiment, which is repro-
duced in Table 8.
Solution
Let X denote the number of cars waiting in line. Then the average
number of cars waiting in line is given by the expected value of X—that is, by
Expected Value of a Random Variable X
Let X denote a random variable that assumes the values x
1
, x
2
, . . . , x
n
with asso-
ciated probabilities p
1
, p
2
, . . . , p
n
, respectively. Then the expected value of X,
denoted by E(X), is given by
E(X) x
1
p
1
x
2
p
2
. . .
x
n
p
n
(2)
6
#
a
4
60
b 7
#
a
2
60
b 8
#
a
1
60
b
0
#
a
2
60
b 1
#
a
9
60
b 2
#
a
16
60
b 3
#
a
12
60
b 4
#
a
8
60
b 5
#
a
6
60
b
TABLE 7
Frequency of
Cars Occurrence
02
19
216
312
48
56
64
72
81
TABLE 8
Probability Distribution
xP(X ⫽ x)
0 .03
1 .15
2 .27
3 .20
4 .13
5 .10
6 .07
7 .03
8 .02
87533_08_ch8_p417-482 1/30/08 10:09 AM Page 428
which agrees with the earlier result.
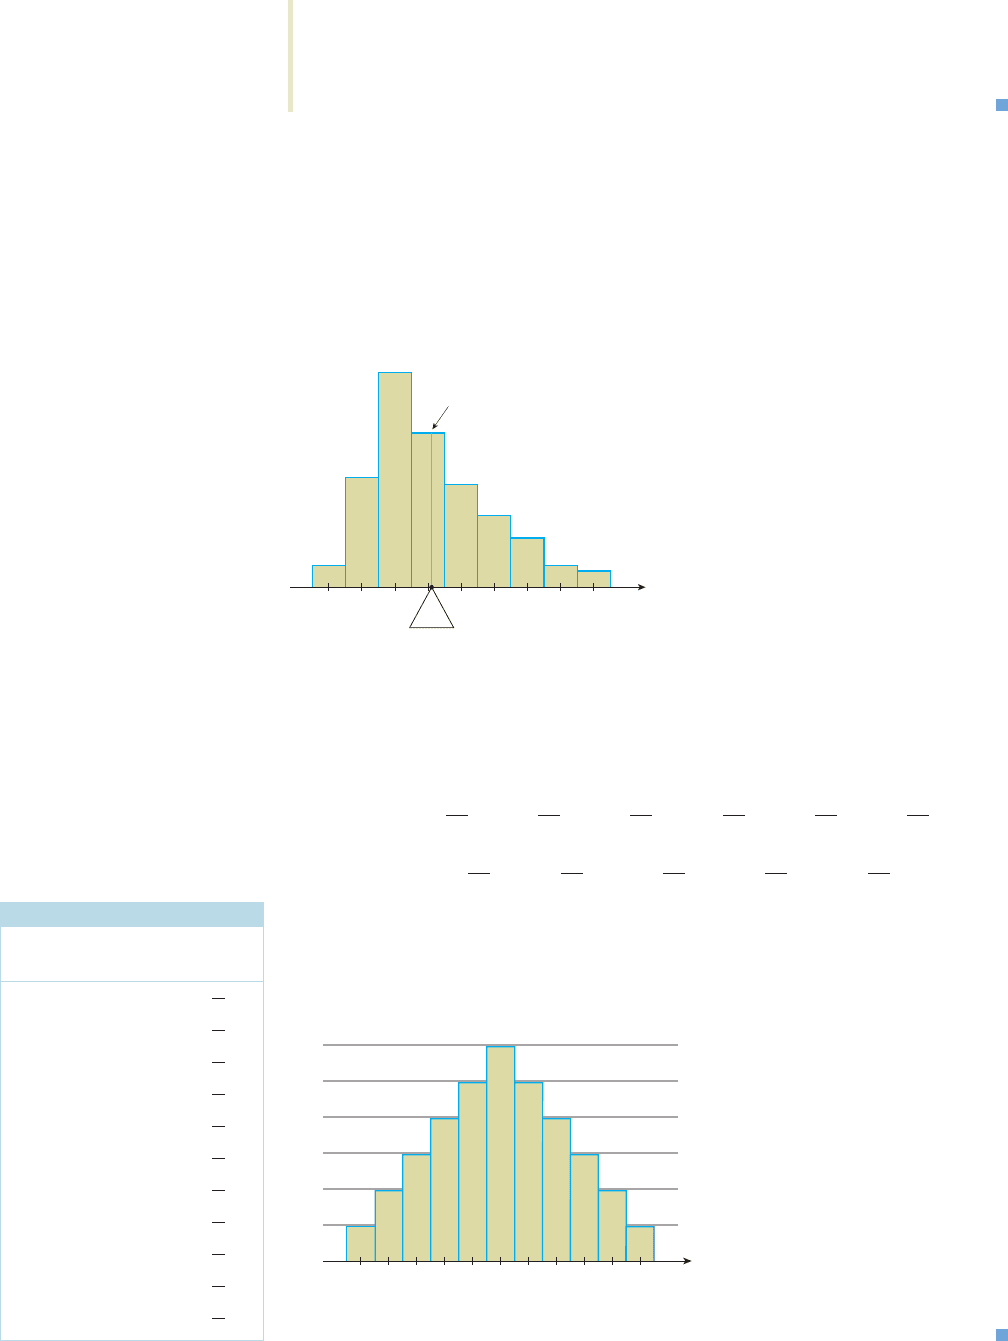
The expected value of a random variable X is a measure of the central tendency of the
probability distribution associated with X. In repeated trials of an experiment with ran-
dom variable X, the average of the observed values of X gets closer and closer to the
expected value of X as the number of trials gets larger and larger. Geometrically, the
expected value of a random variable X has the following simple interpretation: If a
laminate is made of the histogram of a probability distribution associated with a ran-
dom variable X, then the expected value of X corresponds to the point on the base of
the laminate at which the laminate will balance perfectly when the point is directly
over a fulcrum (Figure 6).
EXAMPLE 3
Let X denote the random variable that gives the sum of the faces that
fall uppermost when two fair dice are rolled. Find the expected value, E(X), of X.
Solution
The probability distribution of X, reproduced in Table 9, was found in
Example 5, Section 8.1. Using this result, we find
Note that, because of the symmetry of the histogram of the probability distribution
with respect to the vertical line x 7, the result could have been obtained by merely
inspecting Figure 7.
x
6/36
5/36
4/36
3/36
2/36
1/36
2345678910 1
1 12
7
8 a
5
36
b 9 a
4
36
b 10 a
3
36
b 11 a
2
36
b 12 a
1
36
b
E1X2 2 a
1
36
b 3 a
2
36
b 4 a
3
36
b 5 a
4
36
b 6 a
5
36
b 7 a
6
36
b
E(X
)
x
3.1 cars
1521.10 2 1621.072 1721.032 1821.022
E1X2 10210.32 1121.152 1221.272 1321.202 1421.132
FIGURE 6
Expected value of a random variable X
8.2 EXPECTED VALUE 429
FIGURE 7
Histogram showing the probability distribution for the sum of the
uppermost faces of two dice
TABLE 9
Probability Distribution
xP(X ⫽ x)
2
3
4
5
6
7
8
9
10
11
12
1
36
2
36
3
36
4
36
5
36
6
36
5
36
4
36
3
36
2
36
1
36
87533_08_ch8_p417-482 1/30/08 10:09 AM Page 429

The next example shows how we can use the concept of expected value to help us
make the best investment decision.
APPLIED EXAMPLE 4
Expected Profit A private equity group
intends to purchase one of two motels currently being offered for sale in a
certain city. The terms of sale of the two motels are similar, although the Regina
Inn has 52 rooms and is in a slightly better location than the Merlin Motor Lodge,
which has 60 rooms. Records obtained for each motel reveal that the occupancy
rates, with corresponding probabilities, during the May–September tourist season
are as shown in the following tables.
The average profit per day for each occupied room at the Regina Inn is $20,
whereas the average profit per day for each occupied room at the Merlin Motor
Lodge is $18.
a. Find the average number of rooms occupied per day at each motel.
b. If the investors’ objective is to purchase the motel that generates the higher
daily profit, which motel should they purchase? (Compare the expected daily
profit of the two motels.)
Solution
a. Let X denote the occupancy rate at the Regina Inn. Then the average daily
occupancy rate at the Regina Inn is given by the expected value of X—that is,
by
The average number of rooms occupied per day at the Regina is
(.8865)(52) ⬇ 46.1
or approximately 46.1 rooms. Similarly, letting Y denote the occupancy rate at
the Merlin Motor Lodge, we have
The average number of rooms occupied per day at the Merlin is
(.8240)(60) ⬇ 49.4
or approximately 49.4 rooms.
.8240
1.9521.092 11.0021.022
E1Y2 1.7521.352 1.8021.212 1.8521.182 1.9021.152
.8865
1.9521.232 11.0021.052
E1X2 1.8021.192 1.8521.222 1.9021.312
430 8 PROBABILITY DISTRIBUTIONS AND STATISTICS
Regina Inn
Occupancy Rate .80 .85 .90 .95 1.00
Probability .19 .22 .31 .23 .05
Merlin Motor Lodge
Occupancy Rate .75 .80 .85 .90 .95 1.00
Probability .35 .21 .18 .15 .09 .02
87533_08_ch8_p417-482 1/30/08 10:09 AM Page 430
b. The expected daily profit at the Regina is given by
(46.1)(20) 922
or $922. The expected daily profit at the Merlin is given by
(49.4)(18) ⬇ 889
or $889. From these results we conclude that the private equity group should
purchase the Regina Inn, which is expected to yield a higher daily profit.
APPLIED EXAMPLE 5
Raffles The Island Club is holding a fund-
raising raffle. Ten thousand tickets have been sold for $2 each. There will
be a first prize of $3000, 3 second prizes of $1000 each, 5 third prizes of $500
each, and 20 consolation prizes of $100 each. Letting X denote the net winnings
(that is, winnings less the cost of the ticket) associated with a ticket, find E(X).
Interpret your results.
Solution
The values assumed by X are (0 2), (100 2), (500 2), (1000 2),
and (3000 2)—that is, 2, 98, 498, 998, and 2998—which correspond, respec-
tively, to the value of a losing ticket, a consolation prize, a third prize, and so on.
The probability distribution of X may be calculated in the usual manner and
appears in Table 10. Using the table, we find
This expected value gives the long-run average loss (negative gain) of a holder
of one ticket; that is, if one participated in such a raffle by purchasing one ticket
each time, in the long run, one may expect to lose, on the average, 95 cents per
raffle.
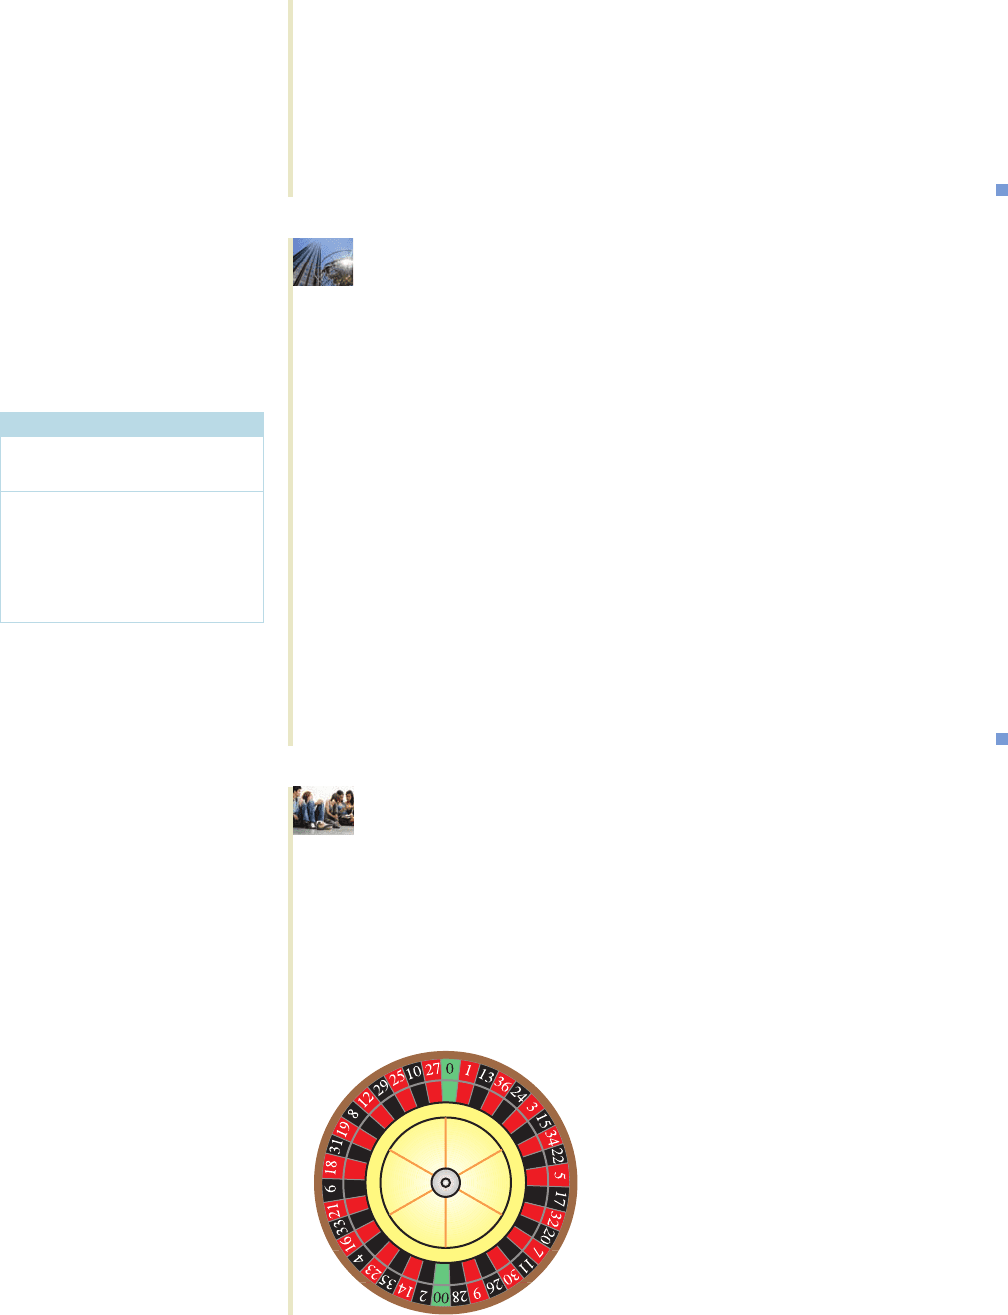
APPLIED EXAMPLE 6 Roulette
In the game of roulette as played
in Las Vegas casinos, the wheel is divided into 38 compartments num-
bered 1 through 36, 0, and 00. One-half of the numbers 1 through 36 are red,
the other half black, and 0 and 00 are green (Figure 8). Of the many types of
bets that may be placed, one type involves betting on the outcome of the color
of the winning number. For example, one may place a certain sum of money on
red. If the winning number is red, one wins an amount equal to the bet placed
and the amount of the bet is returned; otherwise, one loses the amount of the
bet. Find the expected value of the winnings on a $1 bet placed on red.
0.95
9981.00032 29981.0001 2
E1X2 1221.99712 981.00202 4981.0005 2
8.2 EXPECTED VALUE 431
TABLE 10
Probability Distribution for a Raffle
xP(X ⫽ x)
2 .9971
98 .0020
498 .0005
998 .0003
2998 .0001
FIGURE 8
Roulette wheel
87533_08_ch8_p417-482 1/30/08 10:09 AM Page 431