Sikalidis C. (ed.) Advances in Ceramics - Synthesis and Characterization, Processing and Specific Applications
Подождите немного. Документ загружается.

Microstructural Evolution in α-Al
2
O
3
Compacts During Laser Irradiation
399
dissociation and ablation of Al
2
O
3
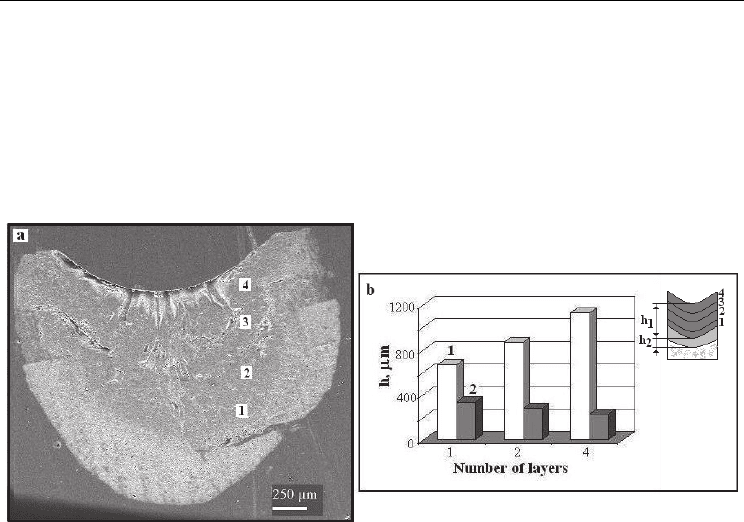
(Vlasova et al., 2010) the largest number of cavities and
channels form in the surface layers of tracks. As in a case of the one-layer tracks, with
decrease in v at a rather low power (P ~ 60–70 W), the thicknesses of the layers h
1
and h
2
increase. At a low traverse speed of the laser beam, a multilayered building-up of corundum
(layer h
1
) is accompanied by a decrease in the thickness of the sintered layer (h
2
). It is likely
that cause of this effect is the high thermal conductivity of corundum.
X-Ray measurements and EPR investigation of spectrum of Cr
3+
in polycrystalline Al
2
O
3
haven't revealed appreciable differences in different layers.
Fig. 5. Micrographs of channels formed in four-run treatment (a) and changes in the
maximal thicknesses of the recrystallized layer (1) and sintered layer (2) depending on the
number of backfills at (b). P = 70 W, v = 0.075 mm/s. 1–4 correspond to the numbers of
layers.
3.3 Laser surface treatment of powder pellets of Al
2
O
3
- xCr
2
O
3
(Kakazey et al., 2009)
For irradiation of pellets obtained by hydrostatic pressure at 5 GPa, the CO
2
-laser with P =
130 W, d = 0.3 mm, v = 0.7 mm/s were used. Three laser scannings of the same trace were
performed in a spiral motion with a step of 0.25 mm beginning from the center of a pellet.
During one-pass laser treatment of dense pellets, concave tracks also forms on their surfaces.
However, in this case, the depth of tracks is much smaller than that in the case irradiation of
loose powder specimens. The thickness (h
1
) of the formed ruby layer is ~0.3 mm even under
high-power irradiation (160–190 W). The thickness of the sintering zone is comparable or
slightly larger than the thickness of the recrystallization zone. On a chip of a track (Fig. 6),
we can see that a sintering zone transforms into a recrystallization zone and that corundum
crystallites increase in size as the distance to the surface of the track decreases. On the
surface of the track, cracks, boundaries of crystallites, and striation, which appears due to
the ablation of the track material, are present. So, the growth of crystallites occurs from the
lower layers of pellets to the surface. Crystallites are initially directed perpendicularly to the
surface of the track. However, as the distance to the surface decreases, crystallites begin to
deviate from vertical to horizontal direction. They take the bent shape and an identical
orientation, i.e., texturing that is set by the traverse of the laser beam occurs.
For the given case it was possible to carry out the x-ray analysis of the irradiated tracks
without destroying specimen. The XRD pattern of the initial sample is shown in Fig. 7 (1).

Advances in Ceramics - Synthesis and Characterization, Processing and Specific Applications
400
The positions and normalized intensities of their X-ray peaks are very close to those of X-ray
peaks for an ideal powder specimen consisting of the α-Al
2
O
3
and α-Cr
2
O
3
(JCPDS-
International Centre for Diffraction Data, 1999) (see Table 1). The XRD patterns of superficial
layer of different LP-samples (with different contents α-Cr
2
O
3
) are shown in Fig. 7 (2-6). The
normalized intensities of the LT samples (see Fig. 7 and Table 1) show the presence of the
following preferred orientations of α-Al
2
O
3
crystallites: [1010] in an α-Al
2
O
3
+ 0.1% α-Cr
2
O
3
sample; [116] in an α-Al
2
O
3
+ 0.5% α-Cr
2
O
3
sample; [116] and [113] in an α-Al
2
O
3
+ 1.0% α-
Cr
2
O
3
sample; [116] in an α-Al
2
O
3
+ 5.0% α-Cr
2
O
3
sample; [116] and [012] in an α-Al
2
O
3
+
10.0% α-Cr
2
O
3
sample. The normalized intensities of α-Cr
2
O
3
in LT α-Al
2
O
3
+ 10.0% α-Cr
2
O
3
sample show (Fig. 7) that the [110]-preferred orientation of α-Cr
2
O
3
crystallites take place.
2-Theta ( h k l) d(nm) I
theor
I
exp
Init.
10.0%
I
exp
LT
0.1%
I
exp
LT
0.5%
I
exp
LT
1.0%
I
exp
LT
5.0%
I
exp
LT
10.0%
25.568 ( 0 1 2) 0.3479 683 370 20 130 999
35.140 ( 1 0 4) 0.2552 999 840 < 10 250 65
37.763 ( 1 1 0) 0.2379 460 370 < 10 220 250
43.339 ( 1 1 3) 0.2085 961 999 40 550 220
46.183 ( 2 0 2) 0.1964 2.0 3.0 60 130
52.533 ( 0 2 4) 0.1740 467 470 10 270
57.482 ( 1 1 6) 0.1601 906 940 100 999 999 999 900
66.493 ( 2 1 4) 0.1404 343 340 85 50
68.181 ( 3 0 0) 0.1374 521 550 340
76.854 ( 1010) 0.1239 145 180 999
Table 1. Diffraction data for -Al
2
O
3
.
In the initial α-Al
2
O
3
+ nα-Cr
2
O
3
samples, only a weak broad EPR signal, which was due to
defect states of the α-Cr
2
O
3
phase, was registered at g ~ 1.9. In Fig. 8, the room-temperature
EPR spectra of laser-treated α-Al
2
O
3
+ nα-Cr
2
O
3
samples are shown. Some singularities (I—
IV at g
I
≈ 1.22, g
II
≈ 1.47, g
III
≈ 3.38, and g
IV
≈ 22) of different intensities and shape were
found in the EPR spectra.
The EPR spectra of Cr
3+
ions in the Al
2
O
3
lattice may be described by the axial spin
Hamiltonian
2
1
(1)
2
z
HgBSDS SS
(1)
with parameters g = 1.984 and D = 5.746 GHz (Manenkov & Prokhorov, 1955). In
polycrystalline samples the EPR spectrum represents a set of singularities (narrow signals)
which position is defined by expression
0
(,)
r
B
=
1
2
22 22
2
1
() ())
sin
rr
dB dB
dd
=0, (2)

Microstructural Evolution in α-Al
2
O
3
Compacts During Laser Irradiation
401
where (,)
r
B
is angular dependence of fine structure EPR-lines in crystal,
and
are
specify the spherical coordinates giving the relative orientation between direction of
magnetic field B and the crystal axes (Kliava, 1988). The EPR spectrum of Cr
3+
(singularities
I—III) in Al
2
O
3
polycrystalline samples is well known (Carman & Kroenke, 1968; de Biasi &
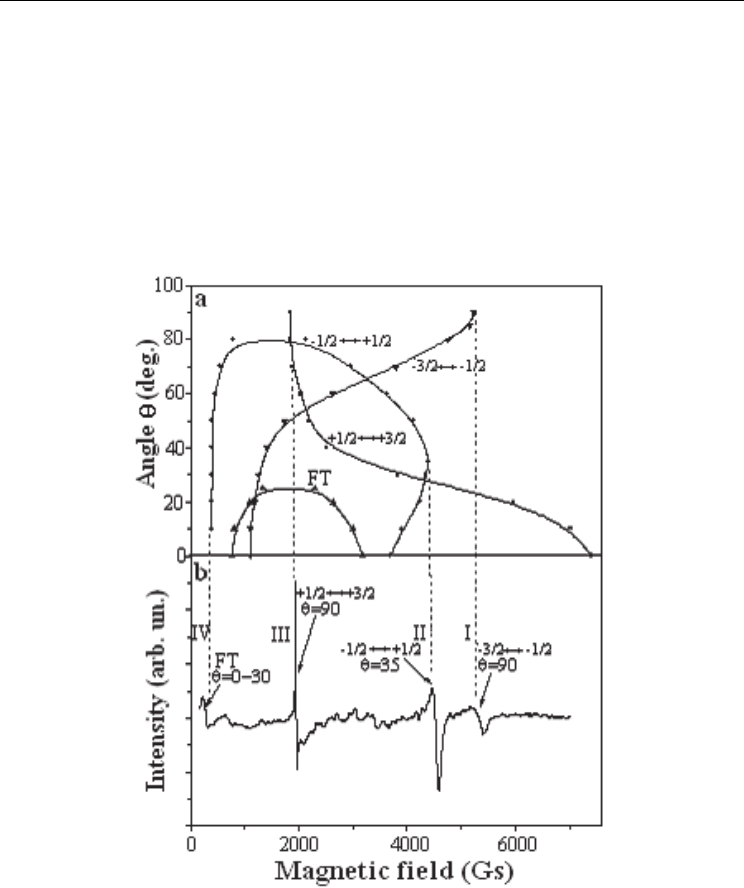
Rodrigues, 1985; O’Reilly & Maciver, 1962; Stone & Vickerman, 1971). In order to identify
signal IV, we compared the EPR spectrum for polycrystalline samples with an angular
dependence of EPR curves of Cr
3+
in ruby crystals (Fig. 8). In Fig. 9, we show that
singularities I, II, III, and IV correspond to the EPR transitions (Cr
3+
:Al
2
O
3
) -3/2 ↔ -1/2 (θ =
90°), -1/2 ↔ +1/2 (θ =35°), +1/2 ↔ +3/2 (θ =90°) and a forbidden transition (FT) (θ = 0 –
30°), respectively.
Fig. 6. Micrographs of the longitudinal section of channel. I VI corresponds from the
surface of channel to the bottom.

Advances in Ceramics - Synthesis and Characterization, Processing and Specific Applications
402
Fig. 7. X-ray diffraction patterns of -Al
2
O
3
+ n -Cr
2
O
3
samples before and after LT:
1 , n = 10 wt. %, initial; 2, n = 0.1%, LT; 3, n = 0.5%, 4, n = 1.0%, LT; 5, n = 5.0%, LT; 6, n =
10.0%, LT. The arrow in 1 and 6 diffraction patterns indicates the (110) peak of -Cr
2
O
3
.
Fig. 8. EPR spectra in -Al
2
O
3
+ n-Cr
2
O
3
laser treated samples. I - IV are designations of
singularities (see text). 2, samples with n = 0.1% after LT; 3, n = 0.5%, 4, n = 1.0%, LT; 5, n =
5.0%, LT; 6, n = 10.0%, LT.
Microstructural Evolution in α-Al
2
O
3
Compacts During Laser Irradiation
403
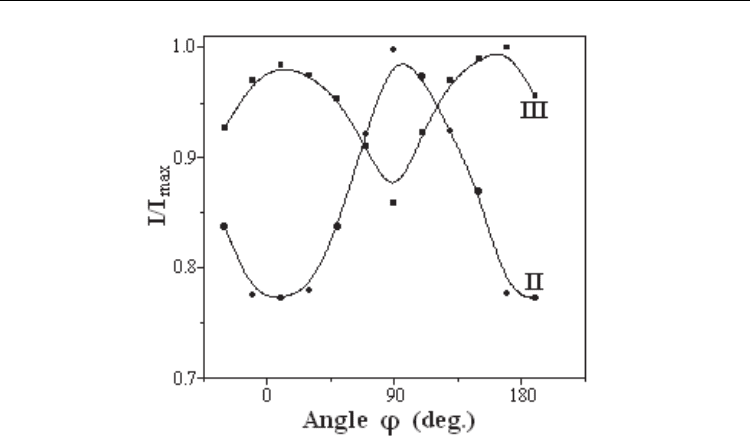
In Fig. 10, dependences of the amplitudes of singularities II and III on the angle φ between
the external magnetic field and a perpendicular to the LT surface of a sample are presented.
A decrease in the amplitude of the EPR singularity II and an increase in the amplitude of the
EPR singularity III are observed as the angle φ increases from 0 to 90°. An increase in the
amplitude of the EPR singularity II and a decrease in the amplitude of the EPR singularity
III are observed as the angle φ increases from 90 to 180° (Fig. 10).
Fig. 9. The observed angular dependence of the EPR spectrum of Cr
3+
ions in -Al
2
O
3
single
crystal (a) and EPR spectrum in an -Al
2
O
3
+0.1%-Cr
2
O
3
LT sample (b). I—IV are
designations of singularities.
Advances in Ceramics - Synthesis and Characterization, Processing and Specific Applications
404
Fig. 10. Variations the I/I
max
ratio for EPR-singularities II and III in an LT -Al
2
O
3
+ 0.1% -
Cr
2
O
3
specimen as functions of the angle φ between the external magnetic field and the
perpendicular to the LT-sample surface.
At n > 1 wt %, in the α-Al
2
O
3
+ nα-Cr
2
O
3
samples, decreases the amplitudes of singularities
I—IV, the appearance and an increase of a new signal A at g
≈ 1.98 are observed (Fig. 8). The
decreases of the amplitudes of the singularities I—IV is accompanied by increases peak-to-
peak line width and by the smearing of line. The width of signal A decreases with increasing
n (ΔB
A
is ~ 520 Gs for n = 1.0 wt %, ~ 380 Gs for n = 5.0 wt %, and ~ 320 Gs for n = 10.0 wt
%). The A signal intensity is nearly proportional to the α-Cr
2
O
3
on the amount in the initial
samples.
The initial samples consist of mechanical mixtures of α-Al
2
O
3
and α-Cr
2
O
3
particles. The
melting point of Al
2
O
3
is 2046 °C and the melting point of Cr
2
O
3
is 2334 °C. During high-
temperature laser treatment, the fully melting of the α-Al
2
O
3
particles and partially melting
of the α-Cr
2
O
3
particles occurs in the processed surface layer of sample (Fig. 6). The formed
Al
2
O
3
melt covers α-Cr
2
O
3
particles. In this case, α-Cr
2
O
3
particles dissolve gradually in the
α-Al
2
O
3
melt. However, as a result of the relatively short treatment, complete dissolution of
α-Cr
2
O
3
particles does not occur in the Al
2
O
3
melt (Fig. 7). At cooling, the directed
crystallization of the formed ceramic material takes place. In the wide class of ceramics, the
orientation of crystallites is not usually distributed randomly, as in the case of an ideal
powder sample. The observed differences in the preferred orientations of α-Al
2
O
3
crystallites in crystallized layers of different samples indicate some unsystematic character
of the preferred direction of crystallization. Though the [116] orientation, one of some
preferred orientations of crystallization, take place in LT α-Al
2
O
3
samples with 0.5%, 1.0%,
5.0% and 10.0% α-Cr
2
O
3
. In such surface layer the undissolved α-Cr
2
O
3
particles also show
the preferred orientation. Preferred orientations in surface crystallized layers and particles
Cr
2
O
3
in stiffening Al
2
O
3
melt may be connected with the anisotropic shape of initial
particles α-Al
2
O
3
and α-Cr
2
O
3
.

Microstructural Evolution in α-Al
2
O
3
Compacts During Laser Irradiation
405
During LT, the whole sample is subjected to the temperature influence. Parameters of the
influence in different regions of the samples are determined by their geometry, thermal
conductivity, etc. Dissolution of Cr
2
O
3
particles in α-Al
2
O
3
leads to appearance of the EPR
spectra of Cr
3+
centers in α-Al
2
O
3
. Let us consider the formation of EPR spectra at a spatial
homogeneous concentration distribution of paramagnetic centers (PC) in samples.
3.3.1 EPR Spectra at a homogeneous distribution of impurities in samples
In general, at low impurities concentration (c < 0.05%), the shape and width of an individual
EPR signal are determined by relaxation parameters. In this case, I is proportional to the
amount of PC in the specimen, i.e., to c. At higher concentration, dipole–dipole
broadening, which is proportional to the impurity content, manifests itself (Berger et al.,
1995; Kittel & Abrahams, 1953). By generalizing results of (Berger et al., 1995; Kittel &
Abrahams, 1953) for S = 3/2, we obtain
3
8
dd
c
Bg
d
(3)
where d is the shortest distance between paramagnetic ions, c is concentration in mole
percents. Note that ΔB
dd
is about 1000 Gs at chromium concentration in the sample of 15 mol
%. In complex EPR spectra different lines may have different widths ΔB
ind
, and their changes
with increasing ΔB
dd
require individual consideration. In groups of closely located lines (GL)
their overlapping occurs with increasing linewidth and a single signal (SS) forms. Note that the
signal assigned to the β
1
phase in (Carman & Kroenke, 1968; Stone & Vickerman 1971) is most
likely connected with the superposition of wider (than I—IV) curves in the central part of the
spectrum (see spectra 3 and 4 in Fig. 8 and curves for -1/2+1/2 and FT transitions in Fig. 9).
At c > 15 mol %, we should expect the exchange-interaction-related phenomena, which lead
to the exchange narrowing of dipolar broadening (Barnes, 1974). Thus, signal A (Fig. 8) is a
typical EPR signal in highly concentrated α-Al
2
O
3
+ nα-Cr
2
O
3
samples (β
N
phase (Carman &
Kroenke 1968; Stone & Vickerman 1971)). It is due to the development of dipole and
exchange (a mixture of ferromagnetic and antiferromagnetic) Cr
3+
— O — Cr
3+
interactions
(Stone & Vickerman 1971). And in α-Cr
2
O
3
, a final antiferromagnetic mechanism of
exchange interaction sets up.
From the performed analysis it follows that at a homogeneous distribution of the impurity,
as its content increases, the gradual transition from the spectrum of individual atoms to EPR
spectra of highly concentrated states occurs. The use of formula (2) and data of experimental
works (Carman & Kroenke, 1968; Knappwost & Gunsser, 1959; Poole & Itzel, 1964; Stone &
Vickerman 1971; Wenzel & Kim, 1965) makes it possible to construct a rough dependences
of changes in the linewidths of EPR signals in Cr
x
Al
2–x
O
3
samples at 0 ≤ x ≤ 2 (Fig. 11, the
solid curve for T ~ 400 K. For α-Cr
2
O
3
the Neel temperature is 307 K (McGuire et al., 1956).
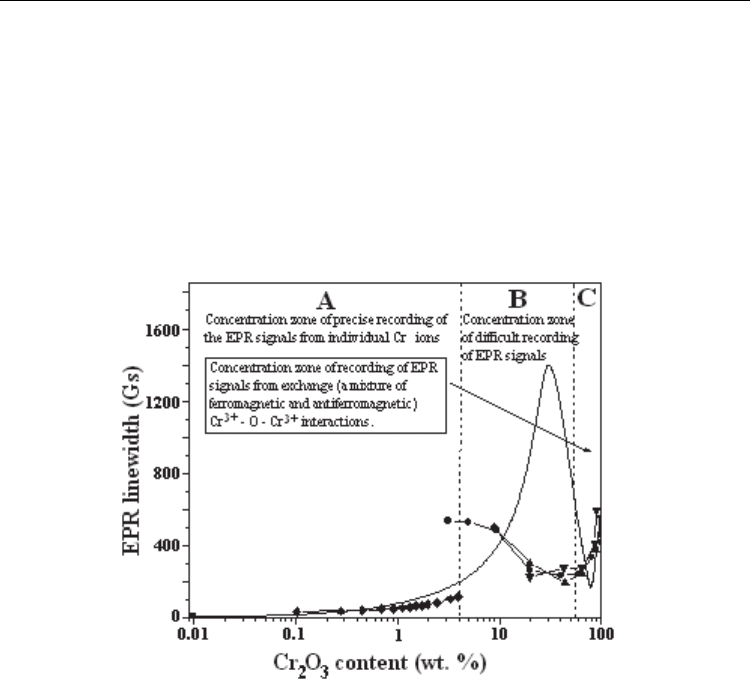
The case the concentration range from 0 to ~ 3.5 wt % of Cr
2
O
3
(zone A) is favorable for
precise recording the EPR spectra from individual PC. The case the concentration of PC range
from 3.5 wt % to 55.0 wt % (zone B) is unfavorable for precise recording EPR spectra due to
large widths of signals. The case the concentration of PC range from 55.0 wt % to 100.0 wt %
(zone C) is favorable for recording EPR spectra from exchange-related complexes.
3.3.2 EPR Spectra at an inhomogeneous distribution of impurities in specimens
The discrepancies between measured and calculated values for the linewidths or the
simultaneous existence of two or more EPR spectra, which are characteristic for different
Advances in Ceramics - Synthesis and Characterization, Processing and Specific Applications
406
concentration states of impurities, indicate an inhomogeneous distribution of impurities in
the samples. Thus, the recording of two distinctly different EPR spectra, namely, from
individual Cr
3+
ions (signals I - IV) and the signal from highly concentrated states of Al
2-
х
Cr
х
O
3
(signal А) (Fig. 8) shows the high degree of inhomogeneity of distribution of the
chromium in our samples. Note that, in most works on the EPR investigation of the -Al
2
O
3
+ n-Cr
2
O
3
samples with even a small value of n, a similar situation can be observed
(Carman & Kroenke, 1968; O’Reilly & Maciver, 1962). This indicates that the preparation of
-Al
2-х
Cr
х
O
3
samples with a homogeneous distribution of chromium impurities by solid-
state synthesis is an intricate problem.
Fig. 11. The dependence of the EPR linewidth on the amount of -Cr
2
O
3
in -Cr
x
Al
2-x
O
3
samples for T = 400 K (100wt % of -Cr
2
O
3
corresponds chromium concentration in the
sample of 40 mol %). The solid curves is a dependence of the linewidth for a homogeneous
distribution of a chromium impurity in the samples; (●) — experimental data of (Stone &
Vickerman 1971); (
◆) data of (de Biasi & Rodrigues 1985); (▼) data of (Wertz & Bolton
1972); (▲) data of (Kittel & Abrahams, 1953); (■) data of (Berger et al., 1995). A is the
concentration zone of precise recording of the EPR signals from individual Cr
3+
ions; B is the
concentration zone of difficult recording of EPR signals; C is the concentration zone of
recording of EPR signals from exchange (a mixture of ferromagnetic and antiferromagnetic)
Cr
3+
- O - Cr
3+
interactions.
3.3.3 Diffusion processes in -Al
2
O
3
+ n-Cr
2
O
3
during laser treatment
The process of dissolution of the -Cr
2
O
3
particles in the Al
2
O
3
melt is diffusion of surface
chromium atoms in the volume of the melt. As result, the chromium diffusion profile (i.e., a
smooth curve of the concentration c vs. distance, r) around undissolved -Cr
2
O
3
particles are
formed
Microstructural Evolution in α-Al
2
O
3
Compacts During Laser Irradiation
407
0
2
x
r
CCerfc
Dt
(4)
where D is the diffusion coefficient, t is the heat treatment time (Akulova, 1986). From this
expression it follows that the impurities are inhomogeneously distributed in the sample.
Thus, each registered EPR spectrum of such a sample is a superposition of signals from Cr
3+
ions located in different concentration states of the sample (from 0 to 100 wt % of Cr
2
O
3
).
From this standpoint, the manifestation of one or another features of the spectra (e.g., the
presence or the absence of singularities I—IV and a signal A) reflects a certain statistics of
the Cr
3+
concentration distribution in the sample. To determine the statistics, not only
individual singularities, but the whole spectrum must be processed. Note that in the
formation of narrow singularities, the zones of the sample with a low local content of the
impurity play the main role. The zones with с ≤ 1.0 mol % play particular role in this respect.
In the case when diffusion profiles of the nearest -Cr
2
O
3
particles are not overlapped, the
shape of the spectra is independent of their amount (n) in the samples, and the spectrum
intensity is proportional to n.
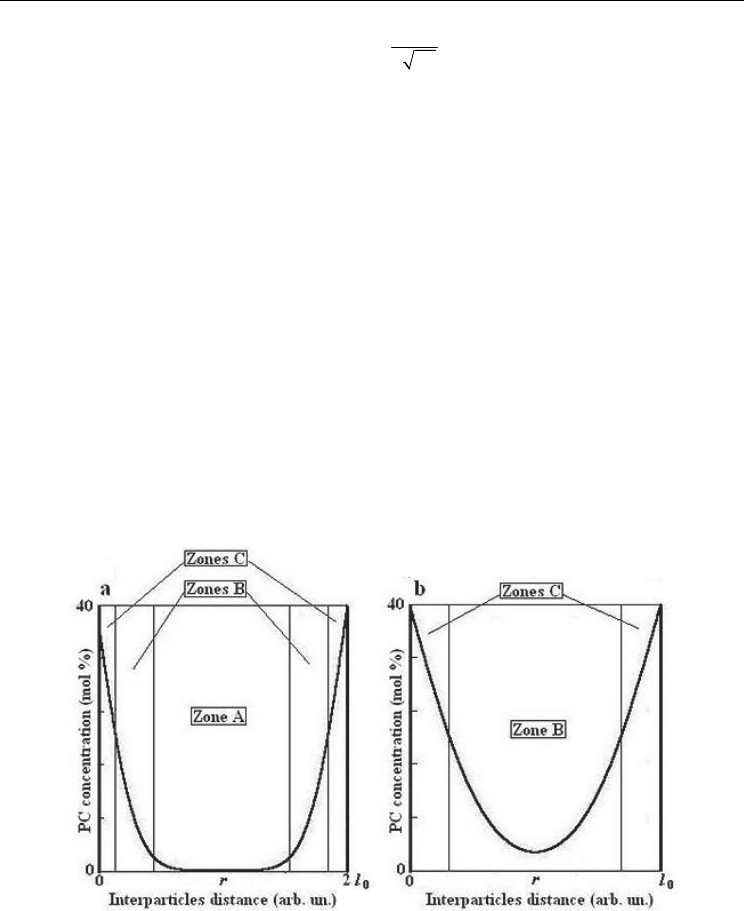
A change in the shape of the EPR spectrum with increasing n (Fig. 8) indicates the
overlapping of the chromium diffusion zones of the nearest -Cr
2
O
3
particles. In Fig. 12, a
scheme of overlapping of the diffusion profiles about the nearest -Cr
2
O
3
particles
depending on their on the amount (i.e., on the change in the distance l between them) in the
samples is shown. From Fig. 12, it is seen that the decrease in l is accompanied by a
decreasing in the volume of the low-concentration zones A in the samples. The volume of
the high-concentration zones C located near -Cr
2
O
3
particles is nearly proportional to the
amount of these particles in the specimen.
Fig. 12. Scheme of overlapping of concentration diffusion profiles between the nearest -
Cr
2
O
3
particles depending on the distance between them: a — the interparticle distance is 2l
0
(in arb. un.); b — the interparticle distance is l
0
(in arb. un.). A is the concentration zone of
precise recording of the EPR signals from individual Cr
3+
ions; B is the concentration zone of
difficult recording of the EPR signals; C is the concentration zone of recording of the EPR
signals from exchange (a mixture of ferromagnetic and antiferromagnetic) Cr
3+
- O - Cr
3+
interactions.

Advances in Ceramics - Synthesis and Characterization, Processing and Specific Applications
408
These analyses explain the nature of changes in the observed EPR spectra. At small values of
n (insignificant overlapping of diffusion zones), the low-concentration regions (с ~ 0.5 mol
%) occupy the maximal volume of the specimen. Though the total content of the impurity in
these zones is insignificant, due to small widths of curves, we observe clear intensive
singularities, on the background of which a weak and wide signal from high-concentration
regions is poorly distinguishable. As n increase, the diffusion zones of the nearest particles
begin to overlap. It favors a decrease in the volume of low-concentration zone. The
amplitudes of singularities I - IV decrease, and the amplitude of the signal А continues to
increase proportionally to n.
Angular dependences of the amplitudes of singularities II and III (Fig. 10) confirm the
textured character of the samples after the laser beam surface treatment (Kakazey et al.,
2002). However, relatively small changes in the amplitudes of these signals (for φ = 0 and
90°, they range from ~ 15 % to ~ 20 %) indicate that the Сr
3+
ions located both in the strongly
textured surface layer and in the part of the sample which is not textured take part in the
formation of these singularities. This part includes regions of the sample adjacent to the
surface layer. The temperature of these regions was lower than the melting point of Al
2
O
3
,
but it was sufficient to cause the local sintering and different types of diffusion processes.
Obtained results show that the melting of the surface layers of pressed -Al
2
O
3
+ n-Cr
2
O
3
samples take place during the performed laser treatment. In such a layer the Al
2
O
3
melt
covers the α-Cr
2
O
3
particles. The α-Cr
2
O
3
particles dissolve gradually in Al
2
O
3
with the
formation of a number of α-Cr
x
Al
2–x
O
3
mutual solid solutions throughout the composition
range from x = 0 to x = 2. Complete dissolution of α-Cr
2
O
3
in Al
2
O
3
does not occur. During
cooling of the sample the crystallization of the α-Al
2
O
3
layer take place. The crystallized
layer show preferred orientation, which is different in different samples. In the surface layer
the undissolved α-Cr
2
O
3
particles also acquire preferred orientation, the direction of which
does not coincide with the direction of the preferred crystallization of α-Al
2
O
3
. Dissolution
of Cr
2
O
3
particles in α-Al
2
O
3
leads to appearance of the EPR spectra of Cr
3+
centers in α-
Al
2
O
3
. Analysis of changes of width singularities and the shape of the EPR spectra with an
increasing of content of paramagnetic centers shows that the distribution of chromium
impurities in α-Al
2
O
3
is determined by the diffusion laws. This distribution is
inhomogeneous and depends on the amount of -Cr
2
O
3
particles in the samples.
The observed EPR spectra reflect the statistics of the inhomogeneous concentration
distribution of the Cr impurity in the samples. To determine the statistics of the
concentration distribution of the impurity in the sample on the basis of EPR data, a
computer analysis of the whole spectrum, rather than an analysis of individual singularities,
must be performed.
3.4 Laser synthesis of crystalline Al
2
O
3
:Cr
3+
rods (Vlasova, Kakazey, et al., 2010)
It is necessary to expect that the decreasing of laser beam surface scanning velocity lead to
the increasing of the heat energy absorbed by molten layer and the increasing of it width
and depth at cross section (Rastogi & Asundi, 2011; Ready, 2001; Shishkovskii, 2009; Weber,
1994). Thus conditions of crystallization of a melt improves. In turn, it supposes the
possibility of use of a superficial laser fusion for obtaining crystalline samples from
polycrystalline objects (from pressings, ceramics and others).
Cylindrical ceramic specimens were irradiated with an LTN-103 continuous-action
Nd
3+
:YAG facility (Russia) using a wave length = 1064 µm. The diameter of the laser spot