Short T.A. Electric Power Distribution Handbook
Подождите немного. Документ загружается.


558 Electric Power Distribution Handbook
exceeded a voltage THD of 5% (less than 5% of exceeded 4%; 87% had THD
less than 2.5%) (Govindarajan et al., 1991). A few of the sites had current
distortion exceeding IEEE 519 standards. In a large survey of locations on
the Sierra Pacific Power Company, voltage THD averaged 1.59%, and current
THD averaged 5.3% (Etezadi-Amoli and Florence, 1990).
Some work has been done to investigate the impact of new harmonic loads
on the harmonic distortion. Compact fluorescent lights with electronic bal-
lasts, heat pumps and air conditioners with adjustable-speed drives, com-
puters, and electric vehicle battery chargers are some of the loads that could
drive up harmonics. Pileggi et al. (1993) predicted that if every home used
two or three electronically ballasted fluorescent lights, voltage distortion may
exceed 5%. This is hard to believe, but it does make us consider the impact
of future electronic loads. Dwyer et al. (1995) also came to similar conclu-
sions: modest numbers of electronic compact fluorescent lights (50 W per
house) can raise the voltage distortion above 5%, especially if feeder capac-
itors create resonances that amplify the harmonics. It helps that multiple
single-phase loads have some phase-angle cancellation; harmonic loads do
not necessarily sum linearly (Mansoor et al., 1995).
In the northeastern U.S., Emanuel et al. (1995) predict rising levels of
harmonic distortion based on predictions of increased use of adjustable-
speed drives, electronic fluorescent lights, computer loads, and other non-
linear loads. They predict that more nonlinear loads can add as much as
0.3% per year to the voltage THD under the worst-case scenario. A limited
number of measurements by the same group of researchers over a 10-year
time period found that harmonic voltages have increased at a rate of about
0.1% per year (it takes 10 years for the THD to increase by a percentage
point) (Nejdawi et al., 1999).
Penetrations of air conditioners driven by adjustable-speed drives to 10 to
20% can raise voltage THD levels above 5% (Gorgette et al., 2000; Thallam
et al., 1992). In another study, Bohn (1996) predicted that electric-vehicle
battery charger penetration levels as low as 5% could increase voltage THD
above 5%, especially on weak systems. In both of these cases, investigators
found wide differences in equipment designs. Some generate much more
harmonics than others. For example, some adjustable-speed drives with more
sophisticated rectifier sections cause much less harmonics than standard
rectifiers. As electronic loads grow, utilities must involve themselves in set-
ting guidelines to limit the harmonics introduced by end-use equipment.
Finding the source of harmonics can be tricky — IEEE 519A provides two
ways to track down harmonics (IEEE P519A draft 7, 2000):
1. Time variations — If harmonics are intermittent, correlating the time
variations of the voltage or current harmonics with the operation
time of facilities or of specific equipment can identify the harmonic
producer.
2. Monitoring with capacitor banks off — In a radial circuit with no capac-
itors, harmonic sources inject current that flows back to the power
1791_book.fm Page 558 Monday, August 4, 2003 3:20 PM
(C) 2004 by CRC Press LLC
Other Power Quality Issues 559
source; following the current leads to the source of the harmonics.
If capacitors are present, resonances can mask the true source of
harmonics.
11.3.1 Resonances
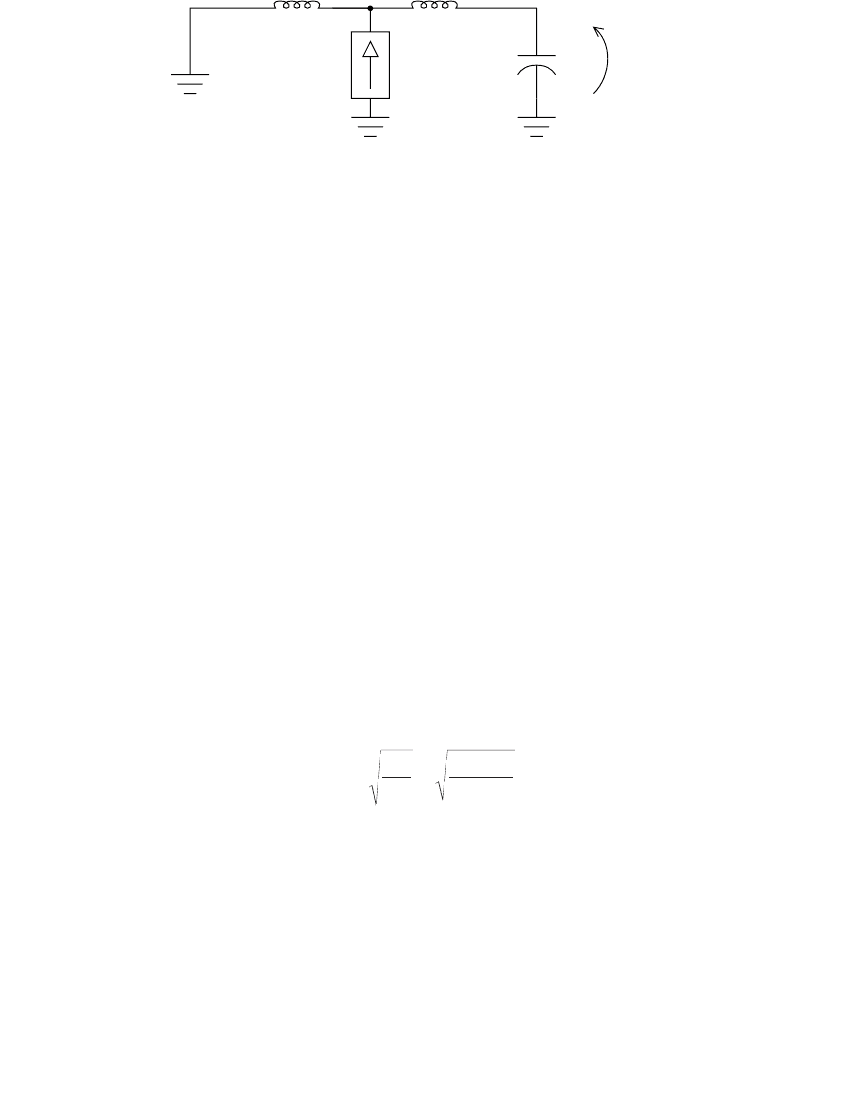
When harmonics cause problems, capacitors are often a contributing factor.
Capacitors can cause resonances that amplify harmonics. Harmonic prob-
lems often show up first at capacitor banks, where harmonics cause fuse
operations or even capacitor failure. Most problems with severe harmonics
are found in industrial facilities where capacitors resonate against the system
impedance. Utility resonances are infrequent but sometimes cause problems.
A capacitor on a distribution circuit will resonate against the inductance
back to the system source (including the line impedances and transformer
impedances). At the resonant frequency, the circuit amplifies harmonics
injected into the circuit (see Figure 11.14).
The resonance point between the capacitor and the system for the scenario
in Figure 11.14 (this is the same frequency that the system will ring at during
a switching surge) is
where
n = order of the harmonic (multiples of the fundamental frequency)
X
C
= line-to-ground reactance of one phase of the capacitor bank at
nominal frequency
X
L
= X
L1
+ X
L2
= system reactance at nominal frequency
MVA
SC
= three-phase short-circuit MVA at the point where the capacitor is
applied
Mvar = three-phase Mvar rating of the capacitor
FIGURE 11.14
Harmonic resonance.
Harmonic load injected
along the circuit
Impedance upstream of
the harmonic load
High voltage
distortion
Source
X
L1
X
L2
I
n
V
C
X
C
n
X
X
MVA
Mvar
C
L
sc
==
1791_book.fm Page 559 Monday, August 4, 2003 3:20 PM
(C) 2004 by CRC Press LLC
560 Electric Power Distribution Handbook
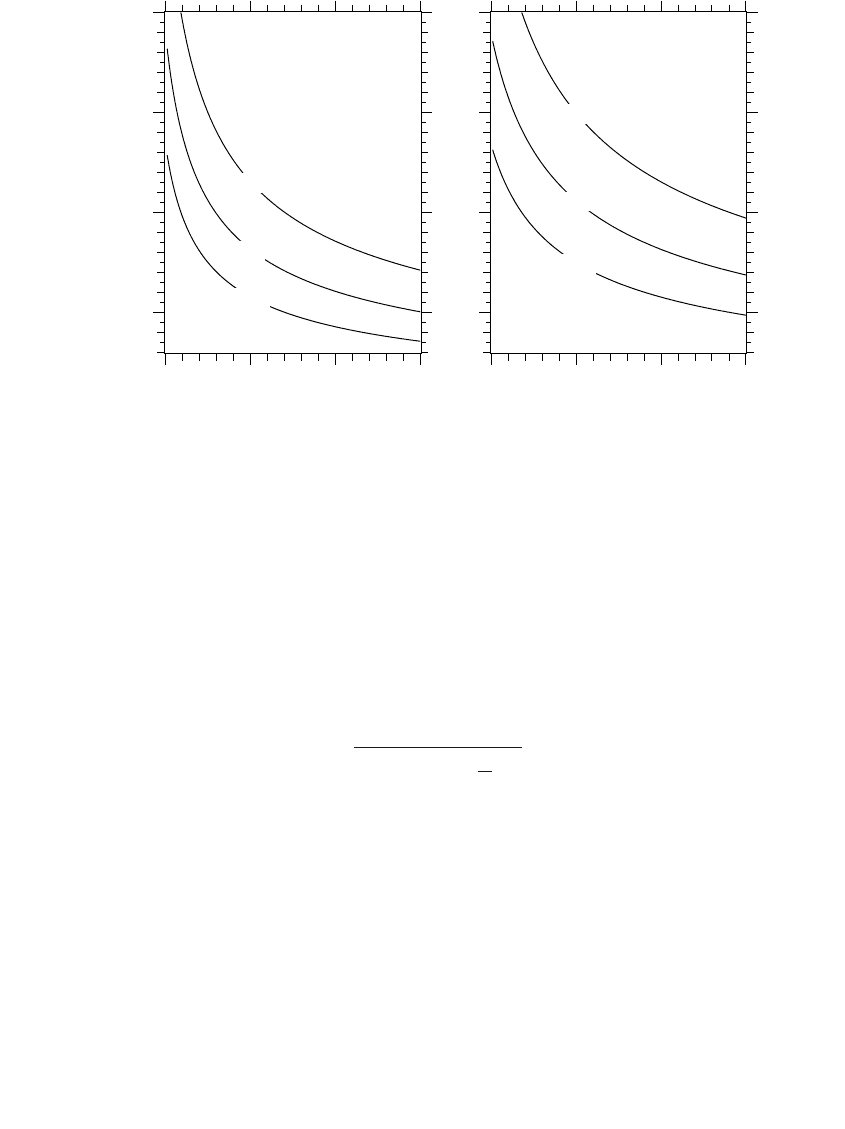
If a nonlinear load injects a harmonic frequency equal to the system’s
resonant point, it can create significant harmonic voltages. Common problem
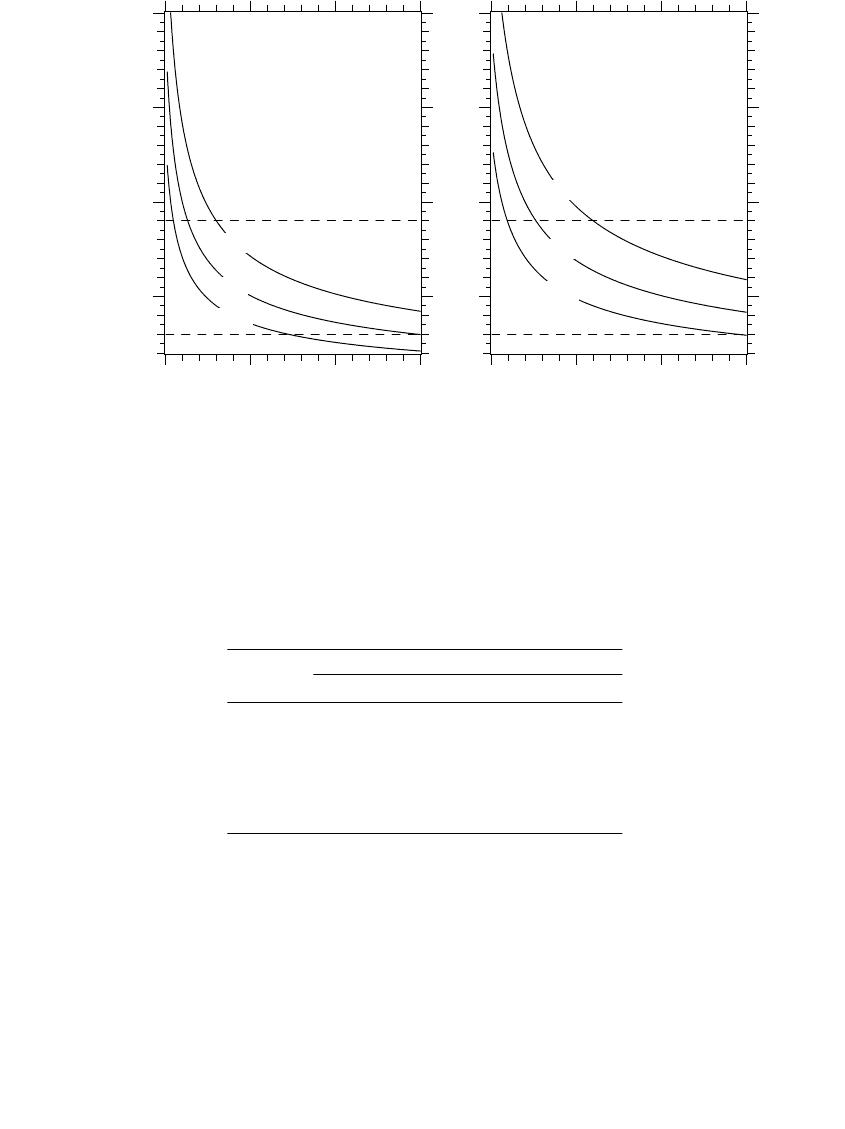
frequencies for resonances are n = 5, 7, 11, and 13. Larger capacitors lower
the resonant point to where it is more likely to cause problems. For 15-kV
class systems, resonances are possible at common capacitor locations for 600
to 1200-kvar banks (see Figure 11.15). For the single-capacitor circuit in
Figure 11.14, the voltage distortion at the capacitor is:
where I
n
is the nth harmonic current. The worst conditions are when the
harmonic source is right at the capacitor or downstream of the capacitor (X
L2
is small). Harmonics injected further upstream are amplified less. This sim-
plification ignores the resistance of the line and the resistance of the loads.
Both reduce the peak magnitude.
Multiple capacitors on a circuit create multiple resonant points that can
require more sophisticated analysis. For complicated circuits, especially with
capacitor banks, a harmonic analysis program helps identify problems and
try out solution options. A harmonic program models multiple harmonic
sources at different locations; the solution shows the harmonic current flows
FIGURE 11.15
Resonant frequency vs. capacitor size (in kvar) and location for balanced, positive-sequence
resonances (500-kcmil AAC).
1200
600
300
0 5 10 15
5
10
15
20
2400
1200
600
0 5 10 15
5
10
15
20
Capacitor location, miles
Resonant frequency, n
12.47 kV
Capacitor location, miles
24.94 kV
V
XX
nX nX
n
X
I
C
CL
LL C
n
=
+-
1
12
1
1791_book.fm Page 560 Monday, August 4, 2003 3:20 PM
(C) 2004 by CRC Press LLC
Other Power Quality Issues 561
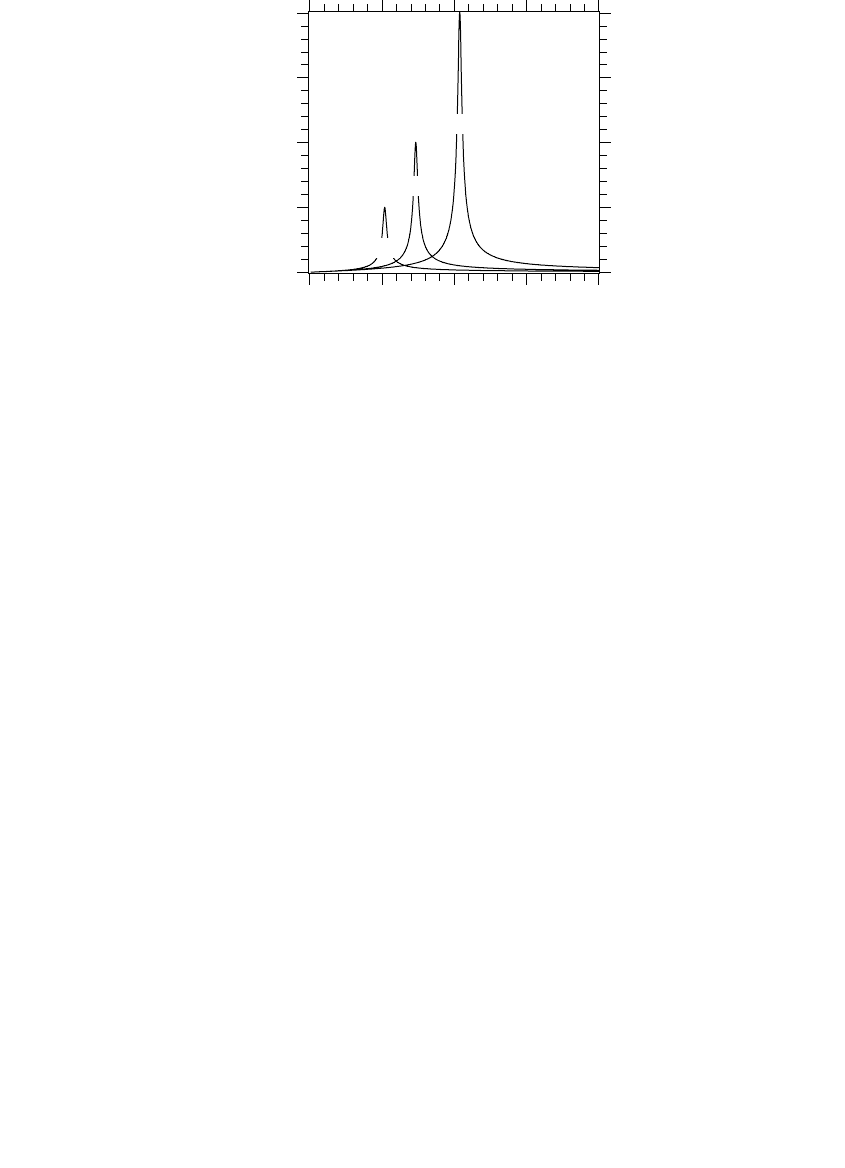
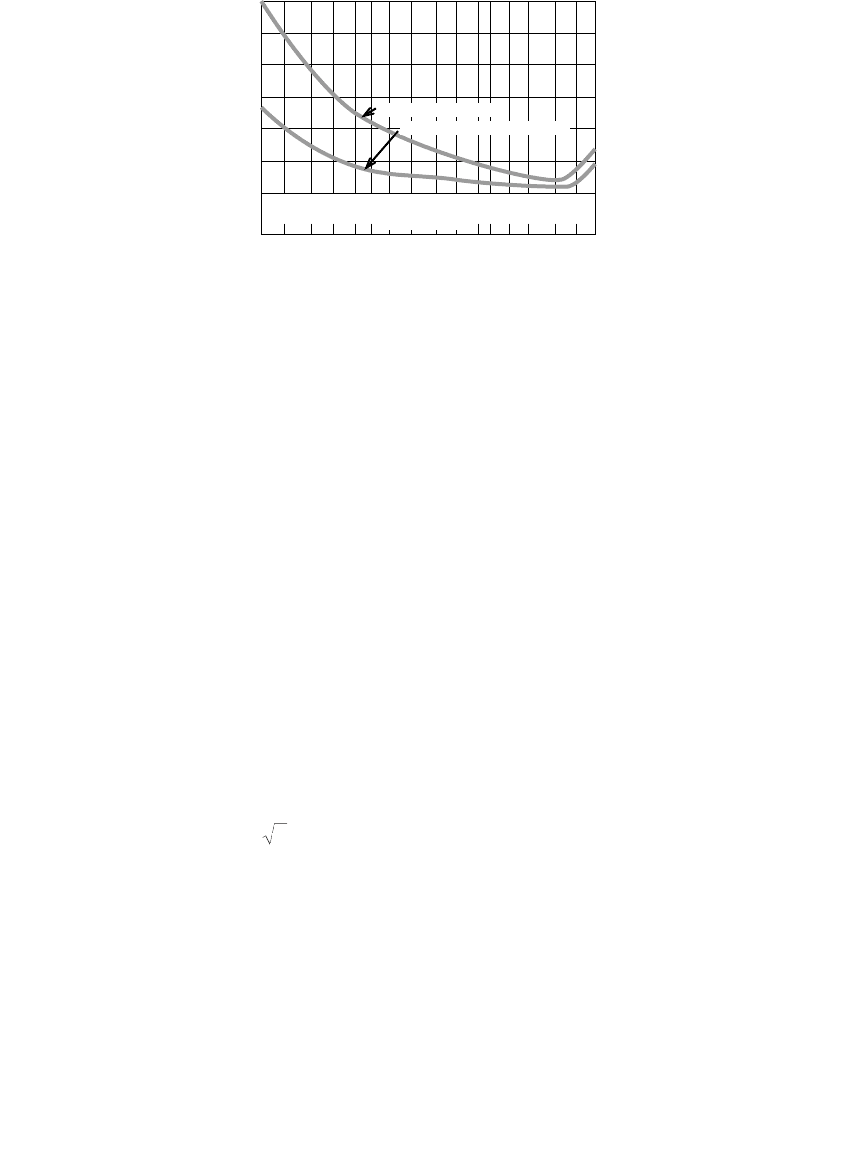
and the harmonic voltages. Another tool, the frequency scan — a plot of the
impedance at a location vs. frequency — helps identify system resonances
that appear as peaks in the scan (see Figure 11.16).
Distribution systems rarely need solutions to harmonics because typical
voltage distortion levels are so low. When problems arise, specific harmonic
producers or specific resonant conditions are often to blame. For offending
producers, we can enforce harmonic standards. Where resonances occur, the
solutions include:
• Relocate or remove capacitors — The easiest solution is to disconnect
the capacitors that form the resonant circuit. Relocating capacitors
or changing their size can also shift the resonant point enough to
ease problems.
• Harmonic filters — While rarely done, tuned filters, consisting of a
capacitor in series with an inductor, absorb harmonics near their
tuned frequency. The best location for filters is closest to the har-
monic producers. If harmonic producers are distributed, filters
located near the center of the line can absorb some of the harmonics.
Applying filters requires study to ensure that additional resonances
are not created.
11.3.2 Telephone Interference
Current flowing through distribution conductors induces voltage along par-
allel conductors, both power conductors and communication conductors.
On low-voltage communication lines, induced voltages can interfere with
FIGURE 11.16
Harmonic scans for various size capacitors (shown in kvar) applied on a 12.47-kV circuit 6
miles from the substation.
1200
600
300
0 5 10 15 20
0
500
1000
1500
2000
Frequency in multiples of the fundamental
Impedance, W
1791_book.fm Page 561 Monday, August 4, 2003 3:20 PM
(C) 2004 by CRC Press LLC
562 Electric Power Distribution Handbook
communication signals, particularly on telephone circuits. Telephone inter-
ference is less common than in the past, primarily because telephone com-
panies use more immune circuits with shielded cables or fiber optics. Open-
wire communication lines are the most susceptible to interference. Interfer-
ence depends on the offending current magnitude, the distance between
conductors, and the length that the circuits run in parallel.
Harmonics increase the likelihood of telephone interference. Higher fre-
quencies introduce noise that transfers more readily through telephone
equipment and is more easily heard. Telephone influence factors (TIF) weight
harmonics differently, depending on frequency. Figure 11.17 shows TIF
weighting factors with frequency. This curve is based on the response of the
telephone equipment (mainly the handset) and human perception of differ-
ent frequencies. The most sensitive frequency is near 2600 Hz (n = 43).
Lower-order harmonics scaling as far down as the third harmonic can inter-
fere with telephone and other communication circuits. The total TIF for
either voltage or current is a weighted factor at each harmonic relative to
the total rms current:
where
X
t
= total rms voltage or current
X
f
= single-frequency rms current or voltage at frequency f
W
f
= single-frequency TIF weighting at frequency f
FIGURE 11.17
Telephone interference factor weights (W
f
) with frequency.
0 1000 2000 3000 4000
0
5
10
Frequency, Hz
Telephone influence factor (x10
3
)
TIF
XW
X
ff
t
=
Ê
Ë
Á
ˆ
¯
˜
Â
2
1791_book.fm Page 562 Monday, August 4, 2003 3:20 PM
(C) 2004 by CRC Press LLC

Other Power Quality Issues 563
TIF is a factor that indicates the harmonic content weighted by frequency;
TIF is like THD but scales each harmonic according to its relative interference
capability. Because interference depends on current magnitudes as well as
harmonic content, interference potential is often described in terms of the
product of current and the telephone influence factor, I · T, where I is the
rms current in amperes, and T is the TIF. Table 11.3 shows guidelines for
I · T from IEEE 519.
Harmonics in the ground return path are much more likely to interfere
with communication circuits. Balanced third and ninth harmonics as well
as other multiples of three (the triplens or triples) are zero-sequence frequen-
cies. These currents generally add in the neutral. Because zero-sequence
circuit impedances are higher than positive-sequence impedances, zero-
sequence resonances can arise with smaller capacitor banks than for posi-
tive-sequence resonances. Figure 11.18 shows capacitor locations that cause
zero-sequence resonances that force more current into the ground-return
path. Table 11.4 shows locations where capacitors resonate for zero-sequence
third harmonics.
While the triplen harmonics are most likely to interfere with communica-
tions circuits, other common harmonics such as the fifth or seventh can cause
trouble. Although the fifth and seventh harmonics are not naturally zero-
sequence currents, if the harmonic components on each of the three phases
are unbalanced, the unbalanced portion of harmonics will flow in the ground.
Telephone interference problems are usually solved by the telephone com-
pany in cooperation with the electric utility involved. Solutions are often
trial-and-error; harmonic load-flow models can help test out solutions. The
normal utility-side solutions are (IEEE Std. 776-1992; IEEE Std. 1137-1991;
IEEE Working Group, 1985):
• Change size — For problems involving a resonance, increasing or
decreasing the size of a bank can shift the resonant point enough to
ease interference problems. The easiest solution is to disconnect the
bank that is contributing to the problem. This is also a good first
step to quantify the role of the capacitor bank in the interference.
TABLE 11.3
Balanced I · T Guidelines between Overhead Power Circuits
and Overhead Telephone Circuits
Classification I · T
Levels most unlikely to cause interference £ 10,000
a
Levels that might cause interference 10,000–25,000
Levels that probably will cause interference > 25,000
a
For some areas that use a ground return for either telephone or
power circuits, this value may be as low as 1500.
Source: IEEE Std. 519-1992. Copyright 1993 IEEE. All rights reserved.
1791_book.fm Page 563 Monday, August 4, 2003 3:20 PM
(C) 2004 by CRC Press LLC
564 Electric Power Distribution Handbook
• Balancing — Balancing harmonic loads between phases reduces the
ground return current. In cases of long single-phase runs, we can
upgrade the line to a two-phase line to reduce ground currents. Note
that this will not help with the third-harmonic currents.
• Move the bank — Moving a capacitor can change a resonant point
enough to stop interference problems. On some circuits, one can
also move the capacitor away from the telephone circuits having
problems.
FIGURE 11.18
Resonant frequency vs. capacitor size (in kvar) and location for zero-sequence resonances (500-
kcmil AAC, X
0
= 1.9W/mile).
Table 11.4
Capacitor Location in Miles from the Substation
Where a 3rd-Harmonic Zero-Sequence Resonance
Occurs for the Given Size Capacitor (for 500-kcmil
AAC with X
0
= 0.3605W/1000 ft)
kvar
System Voltage, kV
4.8 12.47 24.94 34.5
600 2.1 14.8 59.8
900 1.3 9.7 39.6 76.2
1200 1.0 7.2 29.5 56.9
1800 4.7 19.4 37.6
2400 14.4 27.9
4800 6.8 13.4
1200
600
300
0 5 10 15
5
10
15
20
2400
1200
600
0 5 10 15
5
10
15
20
Capacitor location, miles
Resonant frequency, n
12.47 kV
Capacitor location, miles
24.94 kV
1791_book.fm Page 564 Monday, August 4, 2003 3:20 PM
(C) 2004 by CRC Press LLC

Other Power Quality Issues 565
• Unground the bank — A floating-wye connection has no connection
to the ground, so the connection blocks zero-sequence harmonic
currents. Two-bushing capacitor units are necessary for floating the
wye point (unless the utility floats the capacitor tanks and deals with
the safety issues that accompany that practice).
• Add a neutral filter — While not a common solution, a tuned reactor
in the ground path of a wye-connected capacitor bank is invisible
to positive and negative sequences, but it changes the zero-sequence
resonant frequency of a distribution feeder and often eliminates the
resonant problem. As another approach, on a bank close to the
harmonic source, one could also tune the filter to drain the offending
harmonics (so they do not flow back along the electric/phone lines).
• Add a grounding bank — Grounding banks can change zero-sequence
impedances to shift resonances or shift current flows away from
parallel utility/communication runs to avoid interference. They also
provide a low-impedance path for zero-sequence characteristic cur-
rents to flow. A zig-zag bank can be added, or existing floating-wye
– delta connections can be converted to grounded wye – delta.
On the communications side, several solutions are possible: conversion to
more immune circuits such as fiber optics or shielded conductors. 60-Hz
rejection filters, drainage coils between conductor pairs to reduce induced
voltages, and neutralizing transformers which add a voltage opposing the
induced voltages. Finally, if the interference can be traced to major harmonic
producers, the offending producer can be turned off or harmonics can be
filtered at the source.
11.4 Flicker
Light flicker is due to rapidly changing loads that cause fluctuation in the
customer’s voltage. Even a small change in voltage can cause noticeable
lamp flicker. Flicker is an irritation issue. Flicker does not fail equipment;
flicker does not disrupt sensitive equipment; flicker does not disrupt pro-
cesses. Flickering lights or televisions or computer monitors annoy end users.
Annoying lamp flicker occurs when rapid changes in load current cause
the power system voltage to fluctuate. Sawmills, irrigation pumps, arc weld-
ers, spot welders, elevators, laser printers — all can rapidly change their
current draw. In arc furnaces, arcs fluctuate wildly from cycle to cycle,
continuously flickering the voltage. When starting, motors draw significant
inrush, five or six times their normal current, possibly depressing the voltage
for tens of seconds. Some loads like elevators turn on and off repeatedly. All
of these fluctuating load changes can cause flicker.
1791_book.fm Page 565 Monday, August 4, 2003 3:20 PM
(C) 2004 by CRC Press LLC
566 Electric Power Distribution Handbook
Susceptibility to flicker depends on the stiffness of the supply system. So,
flicker is more common on lower-voltage systems and at the ends of long
circuits.
Both magnitude and frequency of fluctuations affect flicker perceptions.
People are most sensitive to flicker that changes from two to ten times per
second, and flicker is visible up to about 35 Hz. The most common flicker
reference curve that has been developed is the GE flicker curve based on
tests by General Electric and several utilities around 1930 (General Electric
GET-1008L) and republished in the IEEE Red Book (IEEE Std. 141-1993). [See
Walker (1979) for comparison with other flicker curves.] An IEEE survey
found that 69% of utilities were using the GE curve (Seebald et al., 1985).
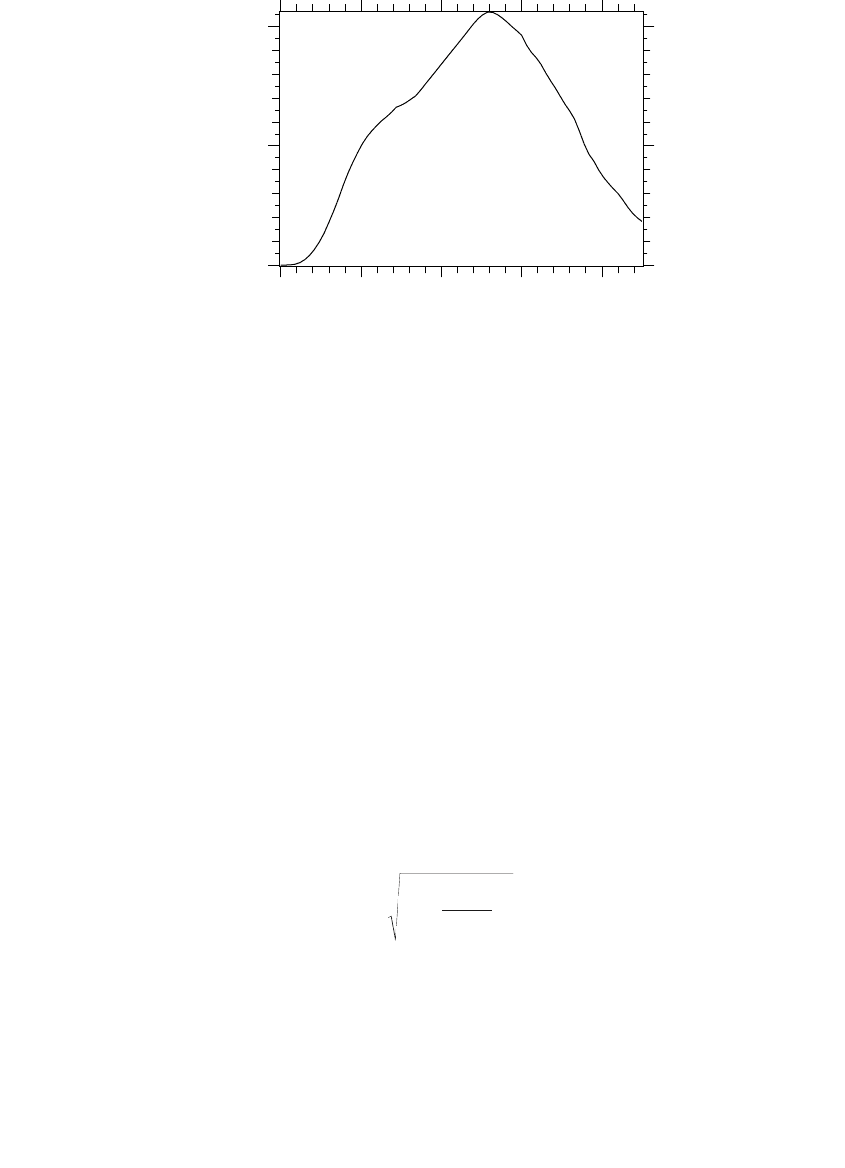
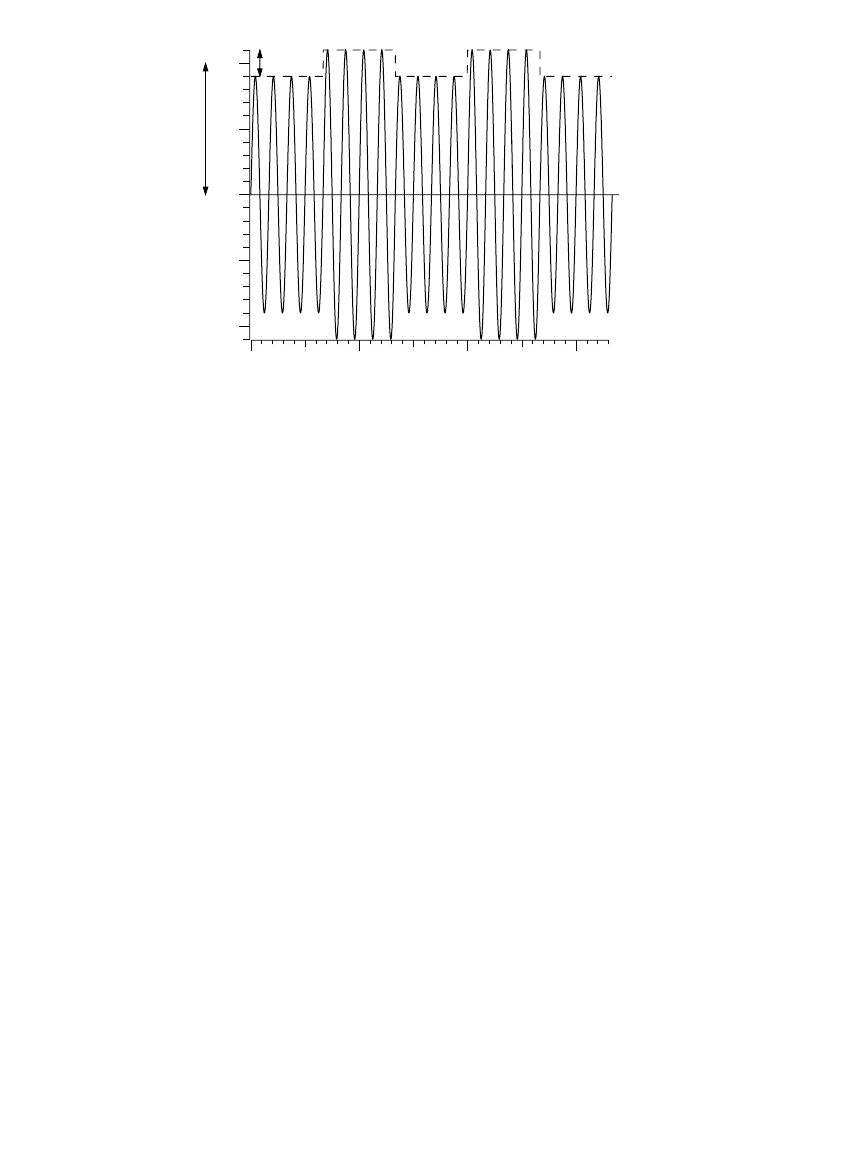
The GE curve shows both a “threshold of perception” and a “threshold of
irritation” (see Figure 11.19). The GE flicker curve is based on square-wave
changes to the supply voltage at the frequencies indicated. Load changes
that are more gradual than a stepped square wave result in less noticeable
flicker; the eye–brain response is more sensitive to rapid light changes (up
to a point). The flicker curve is based on a change in voltage (DV) relative
to the steady-state voltage (V) (see Figure 11.20). Both DV and V are best
represented by rms quantities; mixing rms, peak, or peak-to-peak quantities
gives errors of 2 or . The frequency of the changes is also confusing, even
for changes that are regular and periodic. The GE flicker curve is based on
the number of dips per minute or second or hours. Some other curves or
criteria are based on the number of changes per unit of time (frequency of
changes are twice the frequency of dips).
The flicker tendency of different lights varies significantly:
• Smaller incandescent bulbs — Smaller filaments cool more quickly, so
their light output changes more for a given fluctuation. Higher-
voltage bulbs also have smaller filaments, so they flicker less.
FIGURE 11.19
GE flicker curve. (From IEEE Std. 141-1993. Copyright 1994 IEEE. All rights reserved.)
6
5
4
3
2
1
0
FREQUENCY OF DIPS
MINUT ES SECONDS
TIME BETWEEN DIPS
DIPS PER HOUR DIPS PER MINUTE DIPS PER SECOND
BORDERLINE OF VISIB ILIT Y OF F LICK ER
BORDERLINE OF IRRIT AT ION
12 51020301 2 51020 30 1 2 5 10 20
30 12 6 3 2 1 30 12 6 3 2 1 . 3 . 2 .05
2
1791_book.fm Page 566 Monday, August 4, 2003 3:20 PM
(C) 2004 by CRC Press LLC
Other Power Quality Issues 567
• Dimmers — Some electronic dimmers greatly increase voltage flicker,
especially at low-light settings (EPRI PEAC Brief No. 25, 1995).
Flicker on some dimmed lights is equivalent to the same flicker on
undimmed lights with double the voltage fluctuation.
• Fluorescent lights — Whether magnetic or electronically ballasted,
fluorescent lights normally flicker less for a given voltage input,
some by a factor of over five (voltage changes on a fluorescent light
need to be five times greater to cause the same level of flicker per-
ception on an incandescent light). This is not always the case though;
some fluorescent lights flicker as much as incandescent lights, and
there is no general rule to identify whether a fluorescent light is
sensitive. Fluorescent light ouput depends on the point on wave
where the phosphors ignites, so peak voltage affects fluorescent
lights more than rms-voltage changes.
While lights receive the most attention, voltage fluctuations can also cause
televisions and computer monitors to waver.
Because flicker is based on human perception, it is an inexact science. Some
people are more sensitive than others. Younger people are more sensitive.
Flicker is more noticeable in quiet, low-light settings. In addition, the steady-
state voltage during the time of the fluctuation impacts flicker — lower
nominal voltages lead to less flicker; a 5% reduction in voltage reduces
perceived flicker by 5% (EPRI PEAC Brief No. 36, 1996). Flicker is more
noticeable with side vision (peripheral vision) than with straight-ahead
FIGURE 11.20
Characterizing the magnitude and frequency of voltage changes.
0.0 0.1 0.2 0.3
-1.0
-0.5
0.0
0.5
DV
V
0.5
1.0
Time, seconds
7.5 dips per second or
15 fluctuations per second
1791_book.fm Page 567 Monday, August 4, 2003 3:20 PM
(C) 2004 by CRC Press LLC