Sha W., Malinov S. Titanium Alloys: Modelling of Microstructure, Properties and Applications
Подождите немного. Документ загружается.

Surface gas nitriding: phase composition and microstructure 433
alloy nitrided at 850, 950 (Fig. 16.12b,d,f) and 1050 °C has a similar,
inhomogeneous microstructure. These temperatures are all above the β-transus
temperature of Ti-10V-2Fe-3Al.
The thickness of the nitrided layer increases with the increase of temperature
and time. The maximal thickness of the nitrided layer for this alloy varies
between 100 and 350 µm.
16.11
Continued
•α-Ti • α-Ti (N) ↓ TiO
2
¤ β-Ti ⇓ TiN
5 h
3 h
1 h
0 h
30 35 40 45 50 55 60 65 70 75
2θ (°)
(b)
Intensity (c.p.s.)
4000
3500
3000
2500
2000
1500
1000
500
0
← {101}
⇐ {111}
•
{002}
← {111}
⇐ {200}
← {211}
← {220}
⇐ {220}
⇐
⇐
⇐
⇐
•
{100}
⇐
⇐
•
•
•
•
•
⇐
¤ {211}
←
←
←
←
←
¤ {220}
•
{101}
•
{102}
•
{110}/←
•
{103}
⇐ {311}
•
• •
•
•
/ ←{002}
•
⇐
•
/ ←
•
•
¤ {110}
•
•
←
•
←
•
← {200}
←
←
← {112}
←
•
← {310}
← {210}
←
←
Titanium alloys: modelling of microstructure434
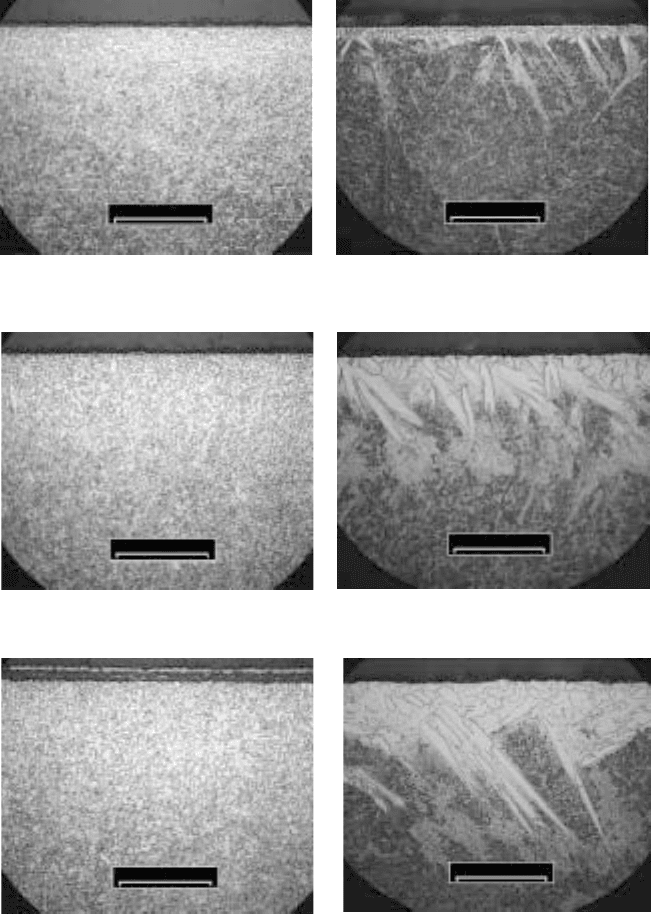
16.12
Microstructure of Ti-10V-2Fe-3Al after gas nitriding at 750 and
950 °C for 1, 3 and 5 hours. (a) 750 °C, 1 h; (b) 950 °C, 1 h; (c) 750 °C,
3 h; (d) 950 °C, 3 h; (e) 750 °C, 5 h; (f) 950 °C, 5 h.
100 µm
100 µm
(e) (f)
100 µm
100 µm
(c) (d)
(a) (b)
100 µm
100 µm
Surface gas nitriding: phase composition and microstructure 435
16.6
ββ
ββ
β21s
16.6.1 Physical appearance change
Before nitriding, the colour of the β21s alloy is silver-grey. After nitriding at
850 °C, it turns grey. After nitriding at 950 °C for 1 and 3 hours, the alloy
appears white. After 5 hours at 950 °C, the alloy is grey. From the X-ray
analyses (the following section), TiN is formed on the nitrided surface and
hence a golden colour should appear. However, the surface of the nitrided
layer is white or grey in colour. The colour of the nitrided alloy may be due
to the contribution of other phases appearing on the surface layer.
16.6.2 X-ray diffraction analysis
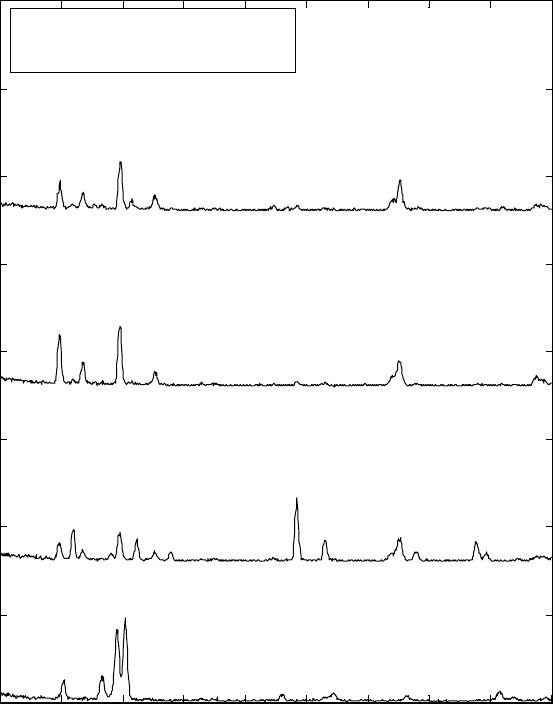
Diffraction patterns for this alloy without nitriding are shown in Figs. 3.3,
6.6 and 6.7, and in Malinov et al. (2002). Though not quantitative, the
changes of relative proportions of the different phases present in the surface
can be seen from the changes in the relative intensities of the various peaks
(Fig. 16.13). For example, comparing the three diffraction patterns from the
alloy nitrided at 950 °C (Fig. 16.13b), there is little TiN in the alloy nitrided
for 1 hour. The amount of TiO
2
, however, appears to be the highest after 1
hour nitriding, decreasing at 3 hours but increasing again after 5 hours. In
addition, the amount of the NbN
0.9
phase appears to decrease with increasing
nitriding time. In the binary alloy phase diagram of the N–Nb system, above
500 °C, NbN (cubic structure) should be present. From the diffraction results,
the NbN
0.9
phase is present instead of NbN, but the NbN
0.9
phase in the X-
ray analysis software database may refer to the same phase as the NbN phase
in the phase diagram.
Between 1 hour with evacuation and 1 hour without evacuation (850 °C),
the phases present are similar, so nitrogen purging appears to have the same
effect regardless of pre-evacuation.
At 950 °C, higher amounts of the oxide and the nitride are formed than at
850 °C. Despite the high nitrogen concentration in the nitriding process,
rutile (TiO
2
) and possibly Ti
6
O were detected. Ti
6
O has the same diffraction
lines as α-Ti.
16.6.3 Microstructure using optical microscopy
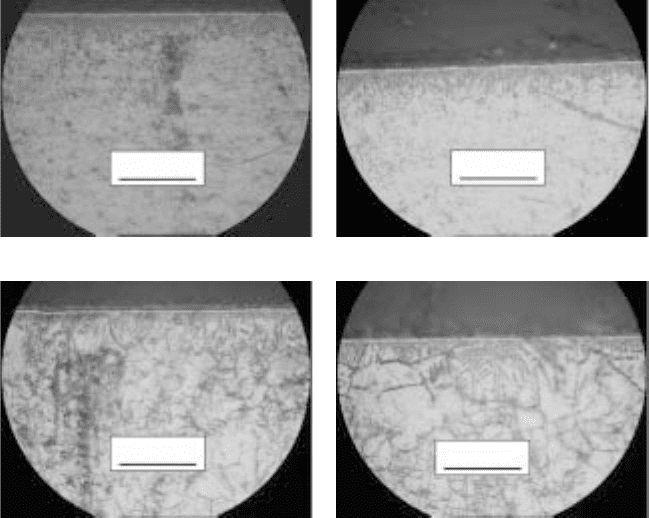
Needle-like microstructure forms at the exposed top surface (Fig. 16.14).
The needles are acicular α phase formed from the high temperature β phase
upon cooling. Grain size increases with increase in the nitriding time, as
shown in the micrographs.

Titanium alloys: modelling of microstructure436
⇓ TiN ↓ TiO
2
← {101}
⇐ {111}
⇐ {200}
← {111}
← {210}
{101}α
{110}β
{002}α
{100}α
vacuum
1 h
1 h
3 h
5 h
30 40 50
2
θ
(°)
(a)
22500
10000
2500
0
10000
2500
0
10000
2500
0
10000
2500
0
Counts
16.13
X-ray diffraction patterns of β21s after gas nitriding at
(a) 850 °C, where ‘vacuum’ refers to evacuation of the nitriding
chamber before the start of nitriding, and (b) 950 °C, where, for
clarity, only the peaks additional to those appearing in (a) are
indexed.

Surface gas nitriding: phase composition and microstructure 437
16.13
Continued
NbN
0.9
{200}
← {200}
1 h
3 h
5 h
30 40 50
2
θ
(°)
(b)
10000
0
40000
10000
0
10000
2500
0
Counts
NbN
0.9
{111}
←
Titanium alloys: modelling of microstructure438
(a) (b)
50 µm 50 µm
50 µm
50 µm
(c) (d)
16.14
Optical micrographs of β21s after gas nitriding at 850 °C. (a) 1
h with evacuation; (b) 1 h without evacuation; (c) 3 h; (d) 5 h.
Similar to the microstructures of the alloy nitrided at 850 °C, a needle-
liked structure forms at 950 °C (Fig. 16.15). Comparing with the alloy nitrided
at 850 °C, the grain sizes are larger after nitriding at 950 °C, due to faster
grain growth at the higher temperature.
16.6.4 Microstructure using scanning
electron microscopy
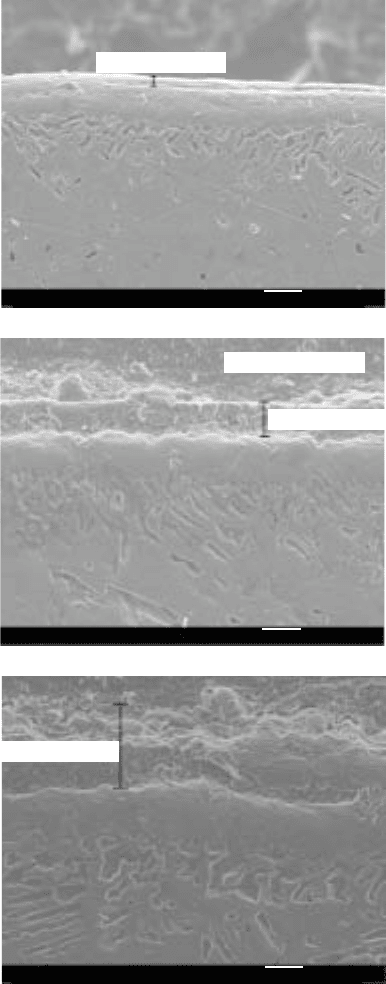
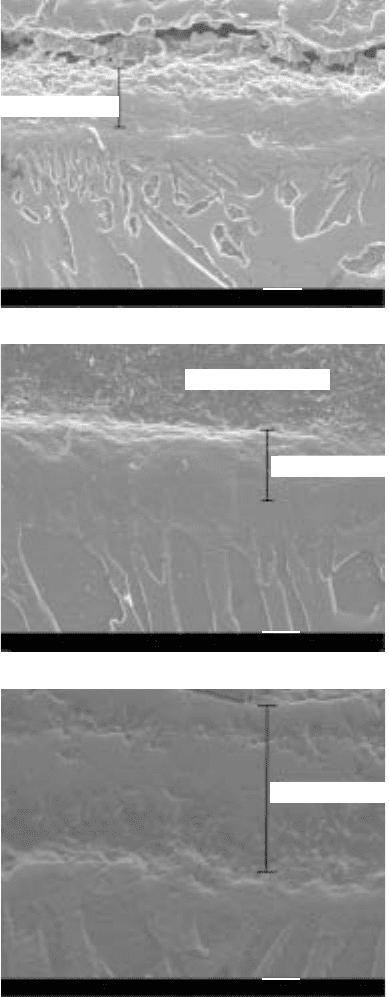
At high magnification, using a low acceleration voltage (2.5 kV) gives much
better image quality (Fig. 16.16) compared with using the more traditional
~15 kV, a feature of the field emission gun (FEG) SEM. The compound layer
is clearly shown.
There is some difference in morphology and appearance of the compound
layer between this alloy (Fig. 16.17) and the Ti-6Al-2Sn-4Zr-2Mo alloy
studied before (Section 16.3). The compound layer in the β21s alloy appears
better adhered to the substrate (compare Fig. 16.17c and Fig. 16.5b).

Surface gas nitriding: phase composition and microstructure 439
16.15
Optical micrographs of β21s after gas nitriding at 950 °C. (a) 1 h; (b) 3 h; (c) 5 h.
(a)
50 µm
(b)
50 µm
50 µm
(c)
Titanium alloys: modelling of microstructure440
QUB SEI 2.5kV X7,500 1µm WD 9.2mm
Compound layer
Mounting medium
Compound layer
QUB SEI 2.5kV X7,500 1µm WD 9.5mm
Compound layer
QUB SEI 2.5kV X7,500 1µm WD 9.3mm
16.16
High magnification scanning electron micrographs of β21s after
gas nitriding at 850 °C. (a) 1 h; (b) 3 h; (c) 5 h.
(c)
(a)
(b)
Surface gas nitriding: phase composition and microstructure 441
Compound layer
QUB SEI 2.5kV X7,500 1µm WD 9.7mm
Compound layer
QUB SEI 2.5kV X7,500 1µm WD 9.8mm
Mounting medium
Compound layer
QUB SEI 2.5kV X7,500 1µm WD 9.2mm
16.17
High magnification scanning electron micrographs of β21s after
gas nitriding at 950 °C. (a) 1 h; (b) 3 h; (c) 5 h.
(c)
(a)
(b)

Titanium alloys: modelling of microstructure442
The surface compound layer shown in these images contains TiN and
TiO
2
phases identified in X-ray diffraction. A detailed profiling work is
shown earlier in this chapter.
The depth of nitrogen penetration in the diffusion layer in β and TiAl
alloys is smaller than in α or α + β alloys, indicating a less strong hardening
effect. This is demonstrated in Chapter 17.
16.7 Timetal 205
16.7.1 X-ray diffraction analysis
The main phases on the surface after nitriding are TiN and TiO
2
(Fig. 16.18b
compared with Fig. 16.18a), in addition to the titanium α and β phases. The
presence of oxygen in the nitriding system is revealed by the formation of
TiO
2
phase. Comparing 730 °C (Fig. 16.18b) and 830 °C (Fig. 16.18c), the
higher nitriding temperature causes increases in TiN and TiO
2
intensities.
16.7.2 Microstructure using optical microscopy
In the cross-sectional optical micrographs, the effect of nitriding at first sight
appears as streaks or patches of dark areas as shown in Fig. 16.19a–c, its
extent and depth increasing with increasing nitriding time. Such dark areas
occupy the entire surface, but extend to the depth of the samples only along
certain paths, indicating a type of diffusion-channel functioning. This diffusion
argument is substantiated by the very visible increasing dark areas and the
frequency of the strips with increasing nitriding time.
30 35 40 45 50
2θ (°)
(a)
Counts
16000
14000
12000
10000
8000
6000
4000
2000
0
{100}α
{110}β
{101}α
16.18
X-ray diffraction patterns of Timetal 205 alloy. (a) Untreated; (b)
nitrided at 730 °C; (c) nitrided at 830 °C.
