Schlick T. Molecular Modeling and Simulation: An Interdisciplinary Guide
Подождите немного. Документ загружается.

15.4. Data Compression and Cluster Analysis 543
where the matrices U (n ×n)andV (m ×m) are orthogonal, i.e., UU
T
= I
n×n
and VV
T
= I
m×m
. The matrix Σ (n × m) contains at most m nonzero entries
(σ
i
, i =1, ···,m), known as the singular values,inthefirstm diagonal elements:
Σ=
⎛
⎜
⎜
⎜
⎜
⎜
⎜
⎜
⎜
⎜
⎜
⎜
⎜
⎝
σ
1
000··· ··· ··· 0
0 σ
2
00··· ··· ··· 0
00··· σ
r
··· ······ 0
.
.
.
0000··· ······ σ
m
0000000 0
.
.
.
0000··· ······ 0
⎞
⎟
⎟
⎟
⎟
⎟
⎟
⎟
⎟
⎟
⎟
⎟
⎟
⎠
(15.23)
where
σ
1
≥ σ
2
≥ ...≥ σ
r
...≥ σ
m
≥ 0 .
The columns of U , namely u
1
,...,u
n
,aretheleft singular vectors;thecolumns
of V , namely v
1
,...,v
m
,aretheright singular vectors. In addition, r = rank of
A = number of nonzero singular values. Thus if r m, a rank-r approximation
of A is natural. Otherwise, we can set k to be smaller than r by neglecting the
singular values beyond a certain threshold.
Low-Rank Approximation
The rank-k approximation to A can be obtained by noting that A can be written
as the sum of rank-1 matrices:
A =
r
j=1
σ
j
u
j
v
T
j
. (15.24)
The rank-k approximation, A
k
, is simply formed by extending the summation
in eq. (15.24) from 1 to k instead of 1 to r. In practice, this means storing k left
singular vectors and k right singular vectors. This matrix A
k
can also be written as
A
k
=
k
j=1
σ
j
u
j
v
T
j
= UΣ
k
V
T
(15.25)
where
Σ
k
= diag (σ
1
,...,σ
k
, 0,...,0) .
This matrix is closest to A in the sense that
A − A
k
= σ
k+1
for the standard Euclidean norm.
Recall that we can express each Xi as:
Row i of (A)=(A
T
e
i
)
T
,
544 15. Similarity and Diversity in Chemical Design
where e
i
is an n × 1 unit vector with 1 in the ith component and 0 elsewhere.
Using the decomposition of eq. (15.24), we have:
A
T
e
i
=
r
j=1
σ
j
v
j
u
T
j
e
i
=
r
j=1
(σ
j
u
j
i
) v
j
.
The SVD transforms this row vector to [(A
k
)
T
e
i
]
T
,where:
(A
k
)
T
e
i
=
k
j=1
(σ
j
u
j
i
) v
j
. (15.26)
Projection
This transformation can be used to project a vector onto the first k principal com-
ponents. That is, the projection matrix P
k
=
k
j=1
[v
j
v
T
j
] maps a vector from m
to k dimensions. For example, for k =2,wehave:
P
2
A
T
e
i
=
r
j=1
(v
1
v
T
1
+ v
2
v
T
2
)(σ
j
u
j
i
) v
j
=(σ
1
u
1
i
) v
1
+(σ
2
u
2
i
) v
2
. (15.27)
Thus, this projection maps the m-dimensional row vector Xi onto the two-
dimensional (2D) vector Yi with components σ
1
u
1
i
and σ
2
u
2
i
. This mapping
generalizes to a projection onto the k-dimensional space where k m:
Yi
k
=(σ
1
u
1
i
,σ
2
u
2
i
, ···,σ
k
u
k
i
) . (15.28)
15.4.3 Relation Between PCA and SVD
It can be shown that the eigenvectors {v
i
} of the covariance matrix (eq. (15.14))
coincide with the right eigenvectors {v
i
} defined above when the second scaling
(eq. (15.6)) is applied to the database matrix. Recall that this scaling makes all
columns have zero means and a variance of unity.
Moreover, the left SVD vectors {u
i
} can be related to the singular values {σ
i
}
and PC vectors {Yi} of eq. (15.15)by
u
i
= Av
i
/σ
i
= Yi/σ
i
. (15.29)
Therefore, we can use the SVD factorization as defined above (eq. (15.22)) to
compute the PCs {Yi} of the covariance matrix C. The SVD approach is more
efficient since formulation of the covariance matrix is not required.
The algorithm ARPACK [728] can compute the first k PCs, saving signifi-
cant storage. It requires an order O(nk) memory and O(nm
2
) floating point
operations.
15.4. Data Compression and Cluster Analysis 545
15.4.4 Data Analysis via PCA or SVD and Distance Refinement
The SVD or the PCA projection is a first step in database visualization. The
second step refines this projection so that the original Euclidean distances {δ
ij
}in
the m-dimensional space are closely related to the corresponding distances {d
ij
}
in the reduced, k-D space. Here,
δ
ij
≡||Xi − Xj||
and
d
ij
≡||Yi−Yj||
for all i, j, where the vectors {Y
i
} are the k-D vectors produced by SVD defined
by eq. (15.28).
Projection Refinement
This distance refinement is a common task in distance geometry refinement of
NMR models. In the NMR context, a set of interatomic distances is given and
the objective is to find the 3D coordinate vector (the molecular structure) that
best fits the data. Since such a problem is typically overdetermined — there are
O(n
2
) distances but only O(n) Cartesian coordinates for a system of n atoms —
an optimal approximate solution is sought.
For example, optimization work on evolutionary trees [1001] solved an iden-
tical mathematical problem in an unusual context that is closely related to the
molecular similarity problem here. Specifically, the experimental distance-data
in evolutionary studies reflect complex factors rather than simple spatial dis-
tances (e.g., interspecies data arise from immunological studies which compare
the genetic material among taxa and assign similarity scores). Finding a 3D evo-
lutionary tree by the distance-geometry approach, rather than the conventional 2D
tree which conveys evolutionary linkages, helps identify subgroup similarities.
Distance Geometry
The distance-geometry problem in our evolutionary context can be formulated as
follows. We are given a set of pairwise distances with associated lower and upper
bounds:
{l
ij
≤ δ
ij
≤ u
ij
}, for i, j =1, 2,...,n,
where each δ
ij
is a target interspecies distance with associated lower and upper
bounds l
ij
and u
ij
, respectively, and n is the number of species. Our goal is to
compute a 3D “tree” for those species based on the measured distance/similarity
data.
This distance geometry problem can be reduced to finding a coordinate vector
Y that minimizes the objective function
E(Y )=
i<j
ω
ij
d
2
ij
(Y ) −δ
2
ij
2
, (15.30)

546 15. Similarity and Diversity in Chemical Design
where d
ij
(Y ) is Euclidean distance between points i and j in the vector Y ,and
the {ω
ij
} are appropriately-chosen weights.
In the combinatorial chemistry context, we use the same function E(Y ) where
Y is the vector of 2n components, listing the 2D projections of each compound in
turn. Details of this data clustering approach are described in [1399, 1402]. Mini-
mization can be performed so that the high-dimensional distance relationships are
approximated.
Besides the value of the objective function (eq. (15.30)), a useful measure of
the distance approximation in the low-dimensional space is the percentage of
intercompounddistances {i, j}(out of n(n−1)/2) that are within a certain thresh-
old of the original distances. We first define the deviations from the targets by a
percentage η so that
|d(Yi,Yj) − δ
ij
|≤ηδ
ij
when δ
ij
>d
min
,
d(Yi,Yj) ≤ ˜ when δ
ij
≤ d
min
, (15.31)
where η, ˜, and d
min
are given small positive numbers less than one. For example,
η =0.1 specifies a 10% accuracy; the other values may be set to small positive
numbers such as d
min
=10
−12
and ˜ =10
−8
. The second case above (very
small original distance) may occur when two compounds in the datasets are highly
similar.
With this definition, the total number T
d
of the distance segments d(Yi,Yj)
satisfying eq. (15.31) can be used to assess the degree of distance preservation
of our mapping. We define the percentage ρ of the distance segments satisfying
eq. (15.31)as
ρ =
T
d
n(n − 1)/2
× 100 . (15.32)
The greater the ρ value (the maximum is 100), the better the mapping and the
more information that can be inferred from the projected views of the database
compounds.
This minimization procedure (projection refinement) is quite difficult for scaled
datasets. Experiments with several chemical datasets of size 58 to 27255 com-
pounds show that the percentage of distances satisfying a threshold deviation ρ
of 10% (eq. (15.31)) is in the range of 40% [1399, 1402]. Nonetheless, these low
values can be made close to 100% with projections onto 10-dimensional space.
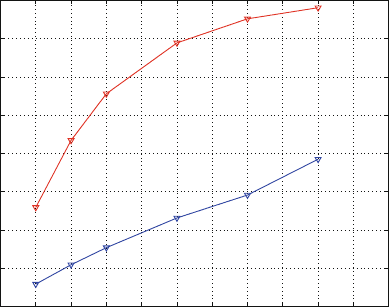
This is illustrated in Figure 15.4, which shows the percentage of distances sat-
isfying eq. (15.31)forη =0.1 as a function of the projection dimension for a
database ARTF.
A similar improvement can be achieved with larger tolerances η (e.g., distances
that are within 25% of the original values rather than 10%) [1399, 1402].
15.4.5 Projection, Refinement, and Clustering Example
As an illustration, consider the model database ARTF of 402 compounds and
m = 312 descriptors containing eight chemical subgroups. We have analyzed this
15.4. Data Compression and Cluster Analysis 547
database by performing 2D and 3D projections based on the SVD factorization
followed by minimization refinement by TNPACK [1121,1122,1397] for perfor-
mance assessment in terms of accuracy as well as visual analysis of the compound
interrelationships.
From Figure 15.4 we note that the refinement stage that follows the SVD pro-
jection is important for increasing the accuracy in every dimension. Namely, the
accuracy is increased by 25–40% in this example.
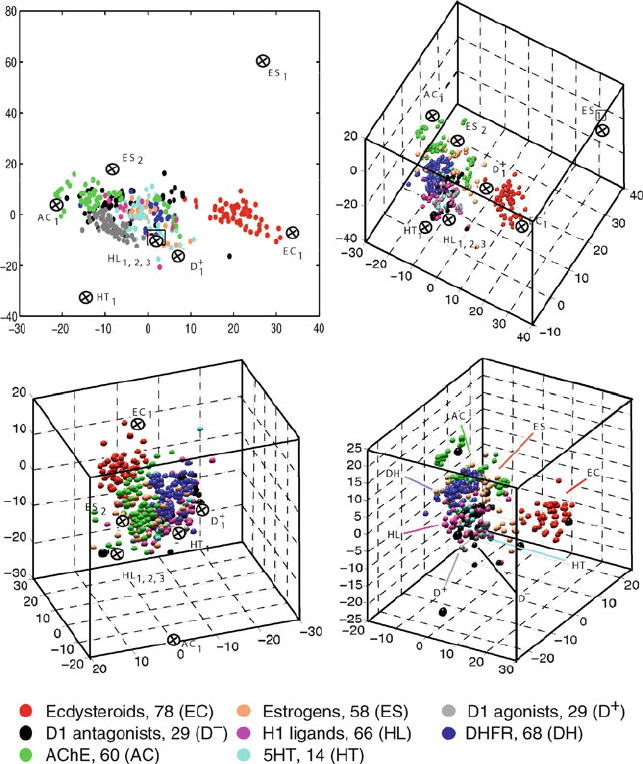
The 2D and 3D projection patterns obtained for ARTF in Figure 15.5 show
the utility of such a projection approach. The resemblance between the 2D and
3D views is evident, and the various 3D views offer different perspectives of the
intercompound relationships.
We note that clusters corresponding to individual pharmacological subsets ap-
pear very close to each other, though partial overlap of clusters is evident. The
ecdysteroid group forms a diverse but separate set of points. The estrogen class
is also clustered and somewhat separate from the others. The strong overlap of
the three clusters corresponding to D1 agonists, D1 antagonists,andH1 receptor
ligands is reasonable given the relative chemical similarity of these compounds:
all act at receptors of the same pharmacological class (i.e., G-protein coupled re-
ceptors). Thus, such data compression and visualization techniques can be used
as a quick analysis tool of the database structure.
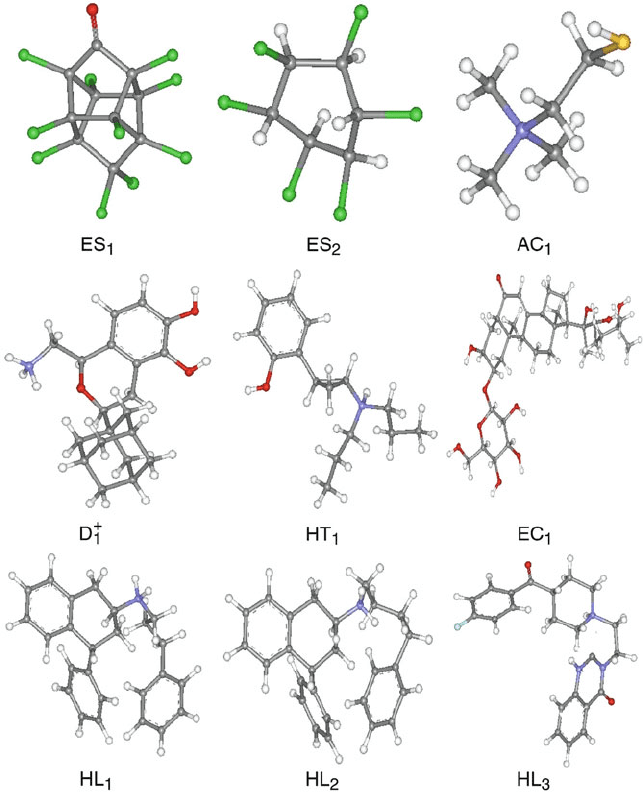
The chemical structures in Figure 15.6 reveal that compounds that are nearer
in the projection are more closely related than those that are distant; this is seen
when compounds are compared both within the same subgroup and within dif-
ferent subgroup. For example, the two labeled estrogen representatives that are
1 2 3 4 5 6 7 8 9 10 11 12
20
30
40
50
60
70
80
90
100
SVD alone
SVD/TNPACK
Projection dimension (low)
Percentage ρ
Figure 15.4. Performance of the SVD and SVD/minimization protocols for the ARTF
chemical database in terms of the percentage of distances satisfying eq. (15.31)forη =0.1
(reflecting 10% distance deviations) as a function of the projection dimension [1399,1402].
548 15. Similarity and Diversity in Chemical Design
Figure 15.5. Two and three-dimensional projections of the chemical database ARTF of 402
compounds composed of the eight chemical subgroups ecdysteroids (EC), estrogens (ES),
D1 agonists (D
+
), D1 antagonists (D
−
), H1 ligands (HL), DHFR inhibitors (DH), AchE
inhibitors (AC), and 5HT ligands (HT) using the projection/refinement SVD/TNPACK
approach [1399, 1402]. Three views are shown for the 3D projection. The accuracy of the
2D projection is about 46% and that of the 3D is 63% (with η =0.1); see eq. (15.31). The
2D projection was obtained by refining the 3D projection. The nine chemical structures
labeled in the projections are drawn in Figure 15.6.
15.4. Data Compression and Cluster Analysis 549
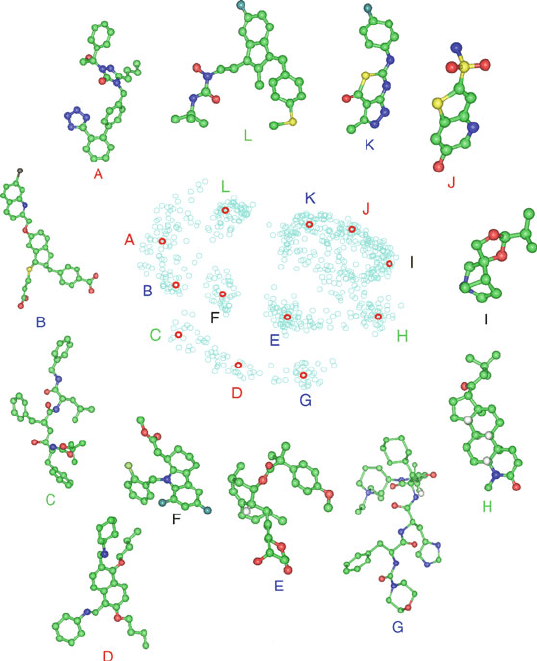
Figure 15.6. Selected chemical structures from the ARTF projection shown in Figure 15.5
reveal similarity of nearby structures and dissimilarity of distant compounds.
distant in the projection appear chemically quite different, while the three clus-
tered H1 ligands appear similar to each other and perhaps to the nearby D1 agonist
representative.
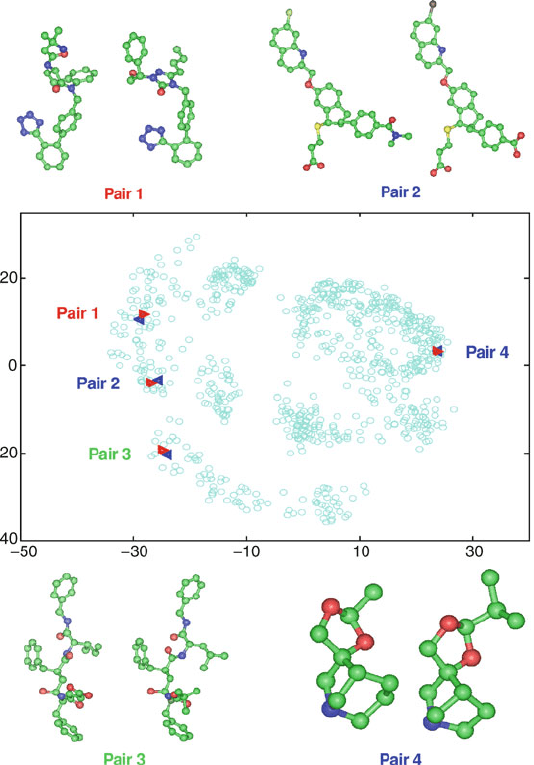
An example of a database projection in 2D by the alternative PCA ap-
proach followed by distance refinement is shown in Figures 15.7 and 15.8
for 832 compounds from the MDL Drug Data Report (MDDR) database us-
ing topological indices. (This work was performed in collaboration with Merck
550 15. Similarity and Diversity in Chemical Design
Figure 15.7. 2D projection using PCA for 832 compounds in the MDDR database showing
the similarity of four compound pairs that are near in the projection.
Research Laboratories). The accuracy of this projection (the percentage of dis-
tances satisfying eq. (15.31)forη =0.1) is only 0.2% after PCA and 24.8% after
PCA/TNPACK. Figure 15.7 shows that compounds close in the projection appear
similar, and Figure 15.8 shows that more distantly related compounds tend to be
different. Without knowing the grouping of these compounds according to bioac-
tivity, the clusters identified in Figure 15.8 suggest a ‘diversity subset’ consisting
of a few members from each cluster.
The approach described here appears promising, but further work is required to
make the technique viable for very large databases.
15.5. Future Perspectives 551
Figure 15.8. 2D projection using PCA for 832 compounds in the MDDR database showing
the diversity of compounds that represent different clusters in the projection (distinguished
by letters). A representative subset may thus consist of one or only a few members from
each cluster.
15.5 Future Perspectives
Similarity and diversity sampling of combinatorial chemistry libraries is a field
in its infancy. The choice of descriptors as well as metrics used to define simi-
larity and diversity are empirical and perhaps application dependent. Thus, many
challenges remain for future developments in the field, and the added involvement
of mathematical scientists and new approaches borrowed from allied disciplines
might be fruitful.
Developments are needed for formulation of descriptor sets, rigorous mathe-
matical frameworks for their analysis, and efficient algorithms for very large-scale
problems based on statistics, cluster analysis, and optimization. The algorithmic
552 15. Similarity and Diversity in Chemical Design
challenge of manipulating large datasets might also explain the tendency toward
smaller and focused libraries [555]; still, as argued in [621], this assumed defeat
is premature!
The central assumption of structure/activity relationships of course remains a
challenge to validate, develop, and further apply.
More broadly, structure-based drug design is likely to increase in importance as
many more protein targets are identified and synthesized [1301], and as modeling
programs improve in their ability to predict binding affinities of certain ligands
(e.g., peptide-like) that share chemical groups with macromolecules, the focus
of many biomodeling packages. The difficulty in determining membrane protein
structures continues to be a limitation since membrane receptors are important
pharmacological targets.
While perhaps not the dominant technique, it is clear that structure-based drug
design will be an important component of drug modification and optimization af-
ter available leads have been generated. The search for the needle in the haystack
(i.e., a successful drug) will likely be guided by the steady light generated by
computer modeling. And, with additional genetic and genomic screening, disease
treatment is likely to move forward to a new phase of greater scientific precision
and success.