Pugnaire F.I. Valladares F. Functional Plant Ecology
Подождите немного. Документ загружается.


M
2
¼ M
1
e
RGR(t
2
t
1
)
,
where M
1
and M
2
are the plant masses at time t
1
and t
2
, respectively. The RGR in this
equation indicates the dry mass increment per unit dry mass, which is already present in the
plant per unit time. For a more detailed discussion on the background of RGR see Box 3.1.
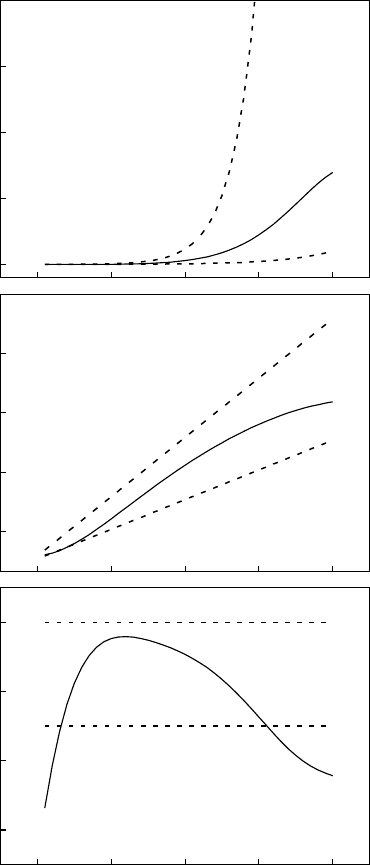
Originally, Blackman thought of RGR as a physiological constant, which would be
characteristic for a given species under given conditions. However, a constant RGR implies
that plants grow exponentially throughout their life (Figure 3.1). In reality, plants hardly
ever show a true exponential growth phase, as RGR changes continuously with ontogeny
(Hunt and Lloyd 1987, Robinson 1991, Poorter and Pothmann 1992). During germination
there is a gradual transition from growth dependent on seed reserves to complete autotrophy.
When plants get older and larger, the upper leaves start to shade lower leaves. Moreover,
larger plants have to allocate more resources away from the assimilating parts of leaves and
roots and invest more in support tissue, especially in stems. Consequently, RGR decreases
with size and time (Figure 3.1). Does this imply that the concept of RGR can only be used in
the seedling stage, during what is often termed the ‘‘exponential growth phase?’’ Mathemati-
cally, there is no requirement for RGR to be constant, because it is a parameter that can be
used as a quantification of growth at any point in time, even if growth is not strictly
exponential. It can also be used as an average over a given time period (Evans 1972) or a
given mass trajectory. Therefore, as long as one is convinced that the growth of the plants
under study is somehow proportional to the plant biomass already present, RGR is the most
appropriate parameter to use. However, it is not a parameter fully independent of plant size!
In the field, where plants experience a fluctuating environment, growth is restricted by
a continuously changing array of abiotic factors (light, temperature, nutrients, and water)
and affected by biotic interactions (competitors, herbivores, pathogens, but also
BOX 3.1 (continued)
Relative Growth Rate
Note that RGR can be interpreted graphically as the slope of the line that connects the
ln-transformed dry masses of plants at several harvesting times (Figure 3.1b). Because of
the ln-transformation, the numerator has no dimension; therefore RGR has the unit ‘day
1
’. As
RGR values were based on plant masses, rather than on leaf area or another parameter of plant size,
units could be expressed as g g
1
day
1
(gram increase per gram dry mass present and per unit of
time). These numbers are generally low, and therefore we use ‘mg g
1
day
1
’ as the unit of expression.
In the previously given example, plant A has an RGR of 693 mg g
1
day
1
,whereasBhas
an RGR of 95 mg g
1
day
1
. We thus conclude that plant A is more efficient in terms of growth than
B. (It may be surprising at first sight that plant A, that doubles its mass in 24 h, has an RGR less than
1000 mg g
1
day
1
. The reason for this is that the assumption underlying Equation 3.4 is that extra
biomass, produced during the beginning of the day, is immediately deployed to fix new C and
minerals, leading to compounding growth.)
There are two additional points to which we want to draw attention. First, the dry mass of the
whole plant is generally taken as the basis for the RGR calculation. However, RGRs have also been
calculated on the basis of fresh weight, shoot weight, leaf area, or leaf number. As long as plant
growth is in steady state, that is, as long as there are no changes in the dry mass: fresh mass ratio,
allocation, morphology, leaf size, and so on, the RGR values expressed in several ways should be
equal. Second, plants with a low RGR can still achieve a large biomass when they start with a high
seed mass or grow over prolonged periods of time (see Equation 3.4). For a discussion on various
approaches for the experimental design in growth analysis and details on calculations see Causton
and Venus (1981), Hunt (1982), Poorter and Garnier (1996), Hoffmann and Poorter (2002).
Francisco Pugnaire/Functional Plant Ecology 7488_C003 Final Proof page 70 30.4.2007 7:56pm Compositor Name: DeShanthi
70 Functional Plant Ecology
symbionts). In comparing species (or genotypes) it is of interest to know their genetic
potential or growth achieved in the absence of constraining factors. Such a goal is difficult
to achieve. It would require knowledge about the exact combination of factors that enables
fastest growth for each species. Even if such a goal could be technically achieved, it would
have the drawback of comparing species that had been grown in more or less different
environments. The practical solution has been to choose a set of conditions that is close to
0
(a)
(b)
(c)
500
1000
1500
2000
0
3
6
9
12
0 10203040
0
100
200
300
HL
300
150
Mass (mg)
HL
150
300
ln (mass)
HL
150
300
RGR (mg g
−1
day
−1
)
Time (da
y
s)
FIGURE 3.1 Time course in (a) total plant mass, (b) ln-transformed values of total plant mass,
and (c) RGR of a theoretical plant population growing continuously with an RGR of 150 or 300
(dashed lines) mg g
1
day
1
, and experimental data on a population of Holcus lanatus. (Continuous line
marked HL; adapted from Hunt, R. and Lloyd, P.S., New Phytol., 106, 235, 1987.) All populations had
a similar starting mass at day 0.
Francisco Pugnaire/Functional Plant Ecology 7488_C003 Final Proof page 71 30.4.2007 7:56pm Compositor Name: DeShanthi
Ecological Significance of Inherent Variation in Relative Growth Rate and Its Components 71

optimal for growth of most species and technically achievable (Grime and Hunt 1975).
Growth rate is then measured for relatively small and young plants over rather short time
intervals (10–20 days), and without interference from other plants. The RGR value
obtained in this way is considered to be RGR
max
. These values are not absolute, because
they depend on ontogeny as well as growth conditions. However, with the exception of
very low nutrient levels (Shipley and Keddy 1988) or light levels (Mahmoud and Grime
1974), RGR ranking remains rather similar (see Poorter et al. 1995, Biere et al. 1996 for
nutrients; Hunt and Cornelissen 1997, Poorter and Van der Werf 1998 for light). There-
fore, ranking of species for RGR
max
does not change strongly across experiments and can
be used in a relative way to order species on the fast–slow continuum. However, there is
variability in such relative rankings across experiments, with correlation coefficients
approximately 0.6 (Table 3.2). Part of this variation is probably caused by imprecisions
related to RGR determinations, especially in larger screening programs with a limited
number of plants harvested per species (Poorter and Garnier 1996).
What do RGR
max
values obtained in the laboratory tell about plant growth in the field?
With respect to light, field-grown plants generally experience stronger fluctuations in instant-
aneous irradiance, and higher levels of total quantum input, when considered over the whole
growing season (Garnier and Freijsen 1994). However, RGR does not strongly depend on the
total daily quantum input above 20 mol m
2
day
1
(Poorter and Van der Werf 1998), a value
quite often reached in growth chambers. Temperature is often lower in the field, especially
during vegetative growth in temperate climates. With respect to nutrients, conditions are
generally far more limiting in the field. Moreover, plants in the field encounter competition
TABLE 3.2
Correlation Coefficients
G75 P89 P and O H97 V98
G75 – 0.77 0.55 0.66 0.57
P89 8 – 0.98 – –
P and O 23 7 – 0.73 0.76
H97 30 – 13 – 0.62
V98 33 – 13 13 –
Sources: Data are from Grime, J.P. and Hunt, R., J. Ecol., 63, 393, 1975.
(G75; 130 species), Poorter, H., Causes and Consequences of Variation in
Growth Rate and Productivity of Higher Plants, H. Lambers, M.L.
Cambridge, H. Konings, and T.L. Pons, eds, SPB Academic Publishing,
The Hague, 1989 (P89; 9 species), Poorter, H. and Remkes, C., Oecologia,
83, 553, 1990 supplemented with data from Van der Werf, A., van Nuenen,
M., Visser, A.J., and Lambers, H., Physiol. Plant., 89, 563, 1993; Den
Dubbelden, K.C. and Verburg, R.W., Plant Soil, 184, 341, 1996 and van
Arendonk, J.J.C.M. (unpublished results), which were all grown under
identical conditions (P&O; 47 species), Hunt, R. and Cornelissen, J.H.C.,
New Phytol., 135, 395, 1997 (H97; 43 species), and from Van der Werf, A.,
Geerts, R.H.E.M., Jacobs, F.H.H., Korevaar, H., Oomes, M.J.M., and de
Visser, W., Inherent Variation in Plant Growth. Physiological Mechanisms
and Ecological Consequences, H. Lambers, H. Poorter, and M. van
Vuuren, eds, Backhuys Publishers, Leiden, 1998 (V98; 71 species).
Note:RGR
max
values of herbaceous species shared by some larger-scale
comparative experiments (upper right part) and number of species in
common on which the correlation coefficient is based (lower left part). Only
those correlations are given when seven or more species were in common.
Francisco Pugnaire/Functional Plant Ecology 7488_C003 Final Proof page 72 30.4.2007 7:56pm Compositor Name: DeShanthi
72 Functional Plant Ecology
and other biotic interactions. Consequently, there is a large difference between the RGR
max
,
as measured in the lab, and RGR of plants in the field (reviewed by Garnier and Freijsen
1994, see also Villar 1998, 2005). Although we expect some relationship between the relative
ranking in laboratory and field, data are too scarce for a proper evaluation. In this chapter,
we treat RGR
max
more as a representation of a complex of traits than as a predictor of
growth rate under natural conditions. This aspect is discussed further in the sections on
pages 73–76 and 84–90.
RGR
MAX
AND PLANT ECOLOGY
RGR
MAX
AND PLANT DISTRIBUTION
Bradshaw et al. (1964) were among the first to establish a relationship between the RGR
max
of
wild species, as measured under laboratory conditions, and the characteristics of the habitat
they originated from. Others followed, but generally the number of species was rather low
(less than 10) to infer strong conclusions. Grime and Hunt (1975) determined RGR
max
of 130
species from England and classified them according to habitat. Fast-growing species were
found relatively more often in fertile habitats, whereas species with a low potential growth
rate tended to occupy infertile habitats. It is not always easy and straightforward to quanti-
tatively classify a specific habitat along a fertility scale. A semiquantitative approach has been
used by Ellenberg, who assigned so-called ‘‘N-numbers’’ to a wide range of species from
Central Europe (Ellenberg 1988). The higher the value, the higher the fertility of the habitats
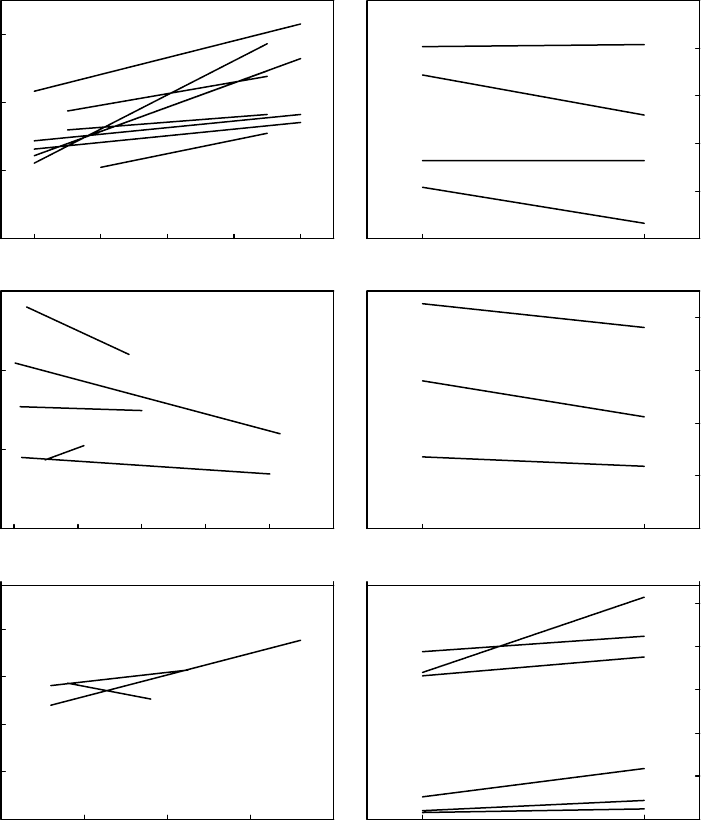
in which such a species would generally occur. Plotting RGR
max
data of herbaceous peren-
nials against the N-number of Ellenberg generally yields positive relationships (Figure 3.2a).
A positive relation between RGR
max
and nutrient availability is also likely for woody species
(Cornelissen et al. 1998). However, annuals seem to have a high RGR
max
independent of soil
fertility (Fichtner and Schulze 1992).
Is inherent variation in potential RGR of species also related to other environmental
gradients? Evidence is less well-documented than in the case of nutrient availability. Alpine
species have lower RGR
max
under laboratory conditions than lowland species (Figure 3.2b).
Dry (Rozijn and Van der Werf 1986, Figure 3.2c) or saline habitats (Figure 3.2d) harbor
species that grow more slowly under optimal conditions, and the same relation between
RGR
max
and plant occurrence was found for sites with heavy metal pollution (Wilson
1988, Verkleij and Prast 1989). Disturbance regime may also be a source of variation in
RGR
max
: annuals that have to complete their life cycle in periodically disturbed habitats,
display a higher RGR
max
than congeneric perennials from more stable habitats (Garnier
1992), and species from early stages of secondary succession tend to have higher RGR
max
than those from more advanced stages (Gleeson and Tilman 1994, Vile et al. 2006). The
intensity of trampling has also been identified as selecting for species with different RGR
max
:
plants from trampled places have a lower RGR
max
than those from nontrampled sites (Figure
3.2e). Finally, when determined at relatively high-light levels, species from strongly shaded
habitats have a lower RGR than those from light-exposed environments. In most of the cases
shown in Figure 3.2b through Figure 3.2f, however, it seems that differences in RGR
max
between species from favorable and unfavorable habitats are not as clear as in the case of
species adapted to habitats differing in fertility.
RGR
MAX
AND ECOSYSTEM PRODUCTIVITY
Most of this chapter focuses on the comparison between plant species. However, in recent
years there has been much attention for ecosystem functioning and a possible link with
species composition. The fact that inherently fast-growing species are more often found in
Francisco Pugnaire/Functional Plant Ecology 7488_C003 Final Proof page 73 30.4.2007 7:56pm Compositor Name: DeShanthi
Ecological Significance of Inherent Variation in Relative Growth Rate and Its Components 73
13579
0
100
200
300
0 500 1000 1500 2000 2500
0
100
200
300
0 500 1000 1500 2000
0
30
60
90
120
150
0
100
200
300
400
0
50
100
150
200
250
0
50
100
150
200
250
9
8
4
7
3
2
1
5
6
(a)
N-availability
1
2
4
5
3
(b)
RGR (mg g
–1
day
–1
)
Altitude (m)
(c)
Rainfall (mm
y
ear
–1
)
3
2
1
High
Low
Low
(e)
Trampling
4
3
2
1
HighLow
(d)
Salt
3
1
2
5
6
4
1
3
2
High
(f)
Li
g
ht
FIGURE 3.2 RGR
max
of species originating from habitats differing in: (a) Nutrient availability, as
indicated by the N-number of Ellenberg; (b) Altitude, in meters above sea level; (c) Rainfall; (d)
Salt concentration; (e) Trampling intensity; and (f) Light intensity. Each study is represented by a
regression line. Numbers refer to the following studies: A: data from (1) Rorison, I.H., New Phytol., 67,
913, 1968; (2) Grime, J.P. and Hunt, R., J. Ecol., 63, 393,1975; (3) Boorman, L.A., J. Ecol., 70, 607, 1982;
(4) Poorter, H., Causes and Consequences of Variation in Growth Rate and Productivity of Higher
Plants, H. Lambers, M.L. Cambridge, H. Konings, and T.L. Pons, eds, SPB Academic Publishing,
The Hague, 1989; (5) Poorter, H. and Remkes, C., Oecologia, 83, 553, 1990; (6) Reiling, K. and Davison,
A.W., New Phytol., 120, 29, 1992; (7) Stockey, A. and Hunt, R., J. Appl. Ecol., 31, 543, 1994; (8) Van der
Werf, A., Geerts, R.H.E.M., Jacobs, F.H.H., Korevaar, H., Oomes, M.J.M., and de Visser, W., Inherent
Variation in Plant Growth. Physiological Mechanisms and Ecological Consequences, H. Lambers,
H. Poorter, and M. van Vuuren, eds, Backhuys Publishers, Leiden, 1998; and (9) Schippers P.
and Olff, H., Plant Ecol., 149, 219, 2000; B: data from (1) Woodward, F.I., New Phytol., 82, 385,
1979; (2) Woodward, F.I., New Phytol., 96, 313, 1983; (3) Graves, J.D. and Taylor, K.,
New Phytol., 104, 681, 1986; (4) Atkin, O.K. and Day, D.A., Aust.J.PlantPhysiol., 17, 517, 1990; and
Francisco Pugnaire/Functional Plant Ecology 7488_C003 Final Proof page 74 30.4.2007 7:56pm Compositor Name: DeShanthi
74 Functional Plant Ecology
nitrogen-rich habitats (sensu Ellenberg 1988), and nitrogen-rich habitats often show a higher
productivity, makes it likely that there is in this case a positive correlation between ecosystem
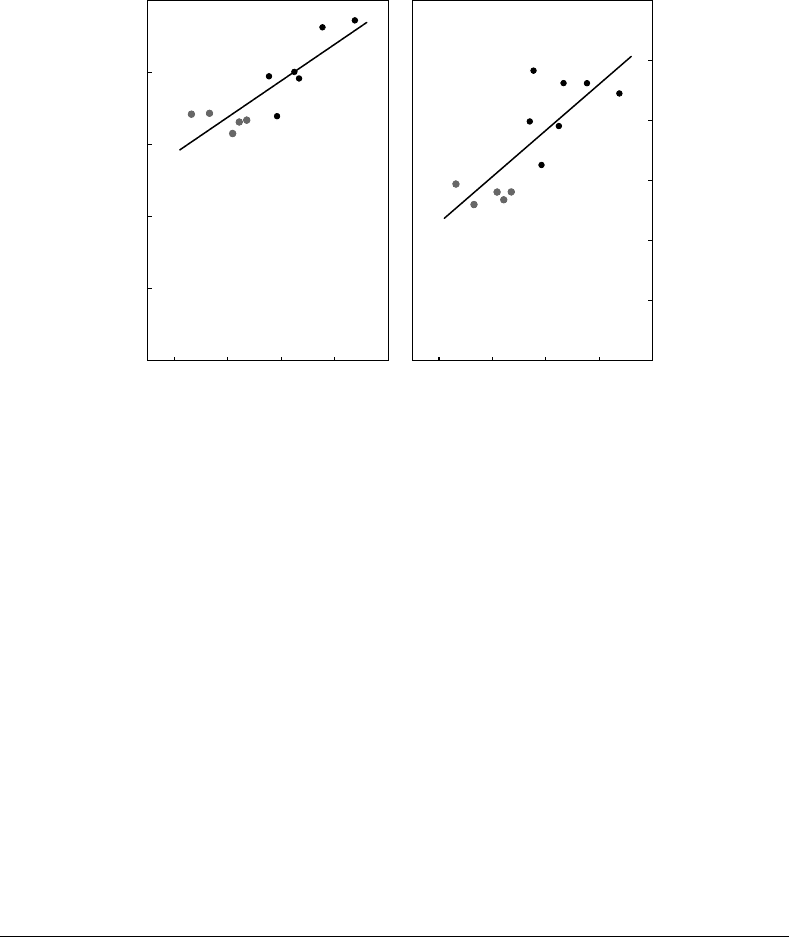
behavior and the RGR of the composing species as determined in the laboratory. Vile et al.
(2006) tested this correlation in a Mediterranean habitat, following secondary succession in
abandoned vineyards. The aboveground net primary productivity, expressed per gram of
biomass present at the beginning of the growing season, varied fourfold between sites and
was negatively correlated with field age. The decrease in productivity was correlated with a
change in species composition, such that species more abundantly present at later succes-
sional stages were those that were showing lowest RGR
max
in growth room experiments
(Figure 3.3a).
FIGURE 3.2 (continued) (5) Atkin, O.K., Botman, B., and Lambers, H., Funct. Ecol., 10, 698, 1996a; C:
data from (1) Mooney, H.A., Ferrar, P.J., and Slatyer, R.O., Oecologia, 36, 103, 1978; (2) Wright, F.I.
and Westoby, M., J. Ecol., 98, 85, 1999; and (3) Warren and Adams, Oecologia, 144, 373, 2005; D: data
from (1) Ball, M.C., Aust. J. Plant Physiol., 15, 447, 1988; (2) Van Diggelen, J., A Comparative Study on
the Ecophysiology of Salt Marsh Halophytes, PhD Thesis, Free University, Amsterdam, 1988; (3)
Schwarz and Gale, J. Exp. Bot., 35, 193, 1984 and (4) Ishikawa S.I. and Kachi, N., Ecol. Res., 15,
241, 2000; E: data from (1) Dijkstra, P. and Lambers, H., New Phytol., 113, 283, 1989; (2) Meerts, P. and
Garnier, E., Oecologia, 108, 438, 1996; and (3) Kobayashi, T., Ikeda, H., and Hori, Y., Plant Biol.,1,
445, 1999; F: data from (1) Pons, T.L., Acta Botanica Neerl., 26, 29, 1977; (2) Corre
´
, W.J., Acta Botanica
Neerl., 32, 49, 1983a; (3) Corre
´
, W.J., Acta Botanica Neerl., 32, 185, 1983b; (4) Kitajama, K., Oecologia,
98, 419, 1994; (5) Osunkoya, O.O., Ash, J.E., Hopkins, M.S., and Graham, A.W., J. Ecol., 82, 149, 1994;
and (6) Poorter, L., Funct. Ecol., 13, 396, 1999.
2
(a) (b)
46810
0
50
100
150
200
250
246810
0
5
10
15
20
25
30
RGR
avg
(mg g
−1
day
−1
)
SANPP (m
g
g
−1
da
y
−1
) SANPP (m
g
g
−1
da
y
−1
)
SLA
avg
(m
2
kg
−1
)
FIGURE 3.3 (a) Aggregated RGR
max
and (b) aggregated SLA of plant species grown in the field plotted as a
function of the specific aboveground net primary productivity (aboveground RGR) of 12 abandoned
vineyards at different stages of secondary succession. Laboratory-derived data of the species present in
the succession were averaged according to the proportion of biomass they represented in the field. (From
Vile, D., Shipley, B., and Garnier, E., Ecol. Lett., 9, 1061, 2006 and Garnier, E., Cortez, J., Bille
´
s, G., Navas,
M.-L., Roumet, C., Debussche, M., Laurent, G., Blanchard, A., Aubry, D., Bellman, A., Neill, C., and
Toussaint, J.-P., Ecology, 85, 2630, 2004.)
Francisco Pugnaire/Functional Plant Ecology 7488_C003 Final Proof page 75 30.4.2007 7:56pm Compositor Name: DeShanthi
Ecological Significance of Inherent Variation in Relative Growth Rate and Its Components 75

RGR
MAX
AND PLANT STRATEGIES
We have shown earlier that in a variety of cases, there is a link between the potential growth
rate of a species and its occurrence in a given habitat. As such, RGR
max
forms one of the
cornerstones in the plant strategy theory formulated by Grime (1979). According to this
theory, plant strategies are shaped by the possible combinations of two factors experienced by
plants: stress and disturbance. Stress in this sense is defined as the extent to which a
combination of environmental variables retards growth (e.g., low nutrient availability, low
or high temperature, low water availability). Disturbance is defined as the degree of physical
disruption of the plant’s biomass (e.g., grazing, trampling). Species from habitats with a high
degree of stress and a low degree of disturbance are called ‘‘stress-tolerators.’’ They are
generally perennials with a low RGR
max
(Figure 3.4). Species from sites with a high disturb-
ance but with low stress are called ‘‘ruderals’’. They are mostly annuals that have a high
RGR
max
, enabling them to complete their life cycle quickly. This would ensure that seeds are
produced before a disturbance event takes place, which kills the plant. Habitats in which both
stress and disturbance are low are favorable for plant growth. According to the plant strategy
theory, these are sites where a strong competition between plants is expected; consequently
species that thrive here are called ‘‘competitors’’. They are generally perennials, and also have
a high RGR
max
. Sites with a high level of both stress and disturbance (volcanoes, nutrient-
poor and strongly drifting sand dunes) do not bear plants, because there is no feasible strategy
to cope with such an environment.
Given the importance that is generally attached to biomass gain and the relative fitness of
a plant (discussed in McGraw and Garbutt 1990), it may be hypothesized that there has been
a selection pressure in fertile (and favorable, even if only temporarily) habitats toward plant
species with a high RGR, and toward a low potential RGR in places which are unfavorable
(Grime 1979, Chapin 1980). However, RGR is a parameter that is the result of a combination
of many physiological, morphological, anatomical, and biochemical traits. Alternatively, it
could well be that it is one or more of these traits underlying RGR that has been the target of
selection, rather than RGR itself (cf. Grime 1979, Coley 1983, Lambers and Dijkstra 1987).
RGR would then merely be a by-product of selection. Before evaluating these contrasting
hypotheses, we first have to investigate the components underlying RGR.
High
Low
HighLow
No feasable
strategy
Stress-tolerators
perennial
Low RGR
max
Competitors
perennial
High RGR
max
Ruderals
annual
High RGR
max
Disturbance
Stress
FIGURE 3.4 Relation between stress and disturbance and the growth strategy, life form, and RGR of
the three types of strategies. (Adapted from Grime, J.P., Plant Strategies and Vegetation Processes,
John Wiley & Sons, Chichester, 1979.)
Francisco Pugnaire/Functional Plant Ecology 7488_C003 Final Proof page 76 30.4.2007 7:56pm Compositor Name: DeShanthi
76 Functional Plant Ecology

COMPONENTS UNDERLYING RGR
MAX
GROWTH PARAMETERS
Growth is more than photosynthesis. It is the balance between the carbon gain per unit leaf
area (ULR) and the carbon losses in the plant (which depend on the respiration rate but also
on the relative proportion of the assimilatory and nonassimilatory organs, and in the longer
run on biomass turnover), corrected for the C-concentration of the newly formed biomass.
Evaluating the relative importance of each of these factors requires a top-down approach, in
which RGR is broken down into components. A common way to do so is factorizing RGR
into the increase in mass per unit leaf area and time (ULR) and the leaf area per unit plant
mass (LAR, leaf area ratio). LAR can be factorized further into the components leaf area:
leaf mass (SLA, specific leaf area) and leaf mass: plant mass (LMF, leaf mass fraction).
A definition of these components of RGR, as well as an explanation of the concept of growth
parameters underlying RGR is given in Box 3.2.
BOX 3.2
Components of RGR
A simple framework to factorize RGR was developed at the beginning of the twentieth century
(Blackman 1919, West et al. 1920). The basic assumption underlying this framework is that plant
growth is dependent on photosynthesis and that leaf area is the plant variable driving total C-gain.
RGR is then factorized into two components: ULR and LAR (Hunt 1982). ULR is defined as the
increase in biomass per unit time and leaf area
ULR ¼
1
A
dM
dt
, (3:6)
where A is the total leaf area of the plant, dM the increase in mass over period dt. LAR is defined
as the total leaf area per unit total plant mass
LAR ¼
A
M
(3:7)
and consequently
ULR:LAR ¼
1
A
dM
dt
A
M
¼ RGR: (3:8)
By determining leaf mass and stem and root mass separately, one is also able to break down
LAR into two components: specific leaf area (SLA) and leaf mass fraction (LMF). SLA is the
amount of leaf area per unit leaf mass (M
L
):
SLA ¼
A
M
L
(3:9)
and LMF is the fraction of total plant mass that is invested in the leaves
LMF ¼
M
L
M
(3:10)
and consequently
(continued)
Francisco Pugnaire/Functional Plant Ecology 7488_C003 Final Proof page 77 30.4.2007 7:56pm Compositor Name: DeShanthi
Ecological Significance of Inherent Variation in Relative Growth Rate and Its Components 77

To what extent is inherent variation in RGR
max
caused by variation in the components
ULR and LAR? A wide variety of results has been published; some experiments found ULR
to be the factor determining growth, others found LAR to be the cause of variation in growth,
whereas others found intermediate results. Variation may be due to the choice of the species
as well as growth conditions used and the experimental procedure followed (e.g., duration of
the experiment and number of harvests). To enable a quantitative analysis of the cause of
variation in RGR within a given experiment, we use the growth response coefficient (GRC).
This coefficient can be calculated after determining the linear regression between the growth
parameter X (which can be ULR, LAR, SLA, or LMF) as the dependent variable and
RGR as the independent variable. GRC
X
then is defined as the relative increase in growth
parameter X divided by the relative increase in RGR
GRC
X
¼
dX=X
dRGR=RGR
The sum of GRC
ULR
and GRC
LAR
for any experiment should be 1, and this is also the case
for the sum of GRC
ULR
, GRC
SLA
, and GRC
LMF
. A value of 1 for GRC
ULR
indicates that
species variation in RGR within an experiment fully scales with variation in ULR, whereas a
value of 0 indicates no effect of this parameter at all.
What is the overall picture that emerges from the literature? Poorter and van der Werf
(1998) analyzed a total of 111 experiments on herbaceous C
3
species, and calculated the
BOX 3.2 (continued)
Components of RGR
SLA:LMF ¼
A
M
L
M
L
M
¼ LAR: (3:11)
The advantage of this approach is that it requires only data on progressions in leaf area and
plant mass to obtain a good indication about the causes of variation in growth rate. This is
because differences in ULR are often due to differences in the area-based rate of photosynthesis.
However, ULR is, in fact, the net balance of total plant carbon gain and carbon losses, expressed
per unit leaf area and corrected for the C-concentration of the newly formed biomass. If one really
wants to obtain insight in the relation between the various C-fluxes and RGR, the following
formula can be used
RGR ¼
PS
a
FCI
PCC
SLA LMF (3:12)
Poorter (2002), where PS
a
is the total amount of C fixed per unit leaf area integrated over a
24 h period, FCI the fraction of that daily fixed carbon that is not respired in leaves, stems, or
roots but invested in growth (so 1-RE=PS). The first four terms in the right-hand side of Equation
3.12 determine the net amount of C fixed per unit of biomass and per day. The denominator
(PCC) converts this net amount of C into a biomass increase.
There are slightly different approaches, in which Equation 3.12 is written as the difference
between carbon gain in photosynthesis and daily rate of respiration in leaves, stems, and roots.
However, by using the form currently presented in Equation 3.12, with FCI (also termed carbon
use efficiency), the equation is the product of five entities, which makes it amenable to the GRC
analysis explained in the ‘‘Physiological Parameters’’ section on the next page. Note that in this
equation C-losses due to exudation, or leaf and root turnover are considered to be negligible.
Francisco Pugnaire/Functional Plant Ecology 7488_C003 Final Proof page 78 30.4.2007 7:56pm Compositor Name: DeShanthi
78 Functional Plant Ecology

average GRC for the various growth parameters. They found that, on average, variation in
SLA is by far the most dominant factor explaining variation in inherent RGR. ULR is
second, and LMF is, on average, the quantitatively least important variable (Table 3.3).
For a more elaborate analysis on GRC and the literature compilation see Poorter and van der
Werf (1998).
It is not all that clear how the above-mentioned relationship between RGR of different
species and the underlying growth parameters depend on environmental conditions or func-
tional types. There have been suggestions that at high irradiance growth variation between
species is due more to ULR than to SLA (Shipley 2006). Comparing variation in RGR
between C3 and C4 species, or between sun and shade species, this seems indeed the case
(Poorter 1989, Poorter 1999). However, for other species there is no indication that the
relative importance of ULR and SLA shift with light environment (Poorter and van der
Werf 1998). Growth temperature affects the relationships such that in cooler environments
GRC
ULR
gains in importance, in warmer environments GRC
SLA
plays a dominant role
(Loveys et al. 2002).
PHYSIOLOGICAL PARAMETERS
The aforementioned technique of growth analysis has the advantage of being simple.
Moreover, technical requirements to conduct such an experiment are low. A drawback is
that ULR is a parameter that integrates various aspects of plant functioning (photosynthesis,
respiration, chemical composition) and therefore cannot be related directly to a specific
physiological process. One may assume that a considerable part of the variation in ULR is
due to differences in the area-based rate of photosynthesis (Konings 1989). To obtain more
insight into the physiological basis of variation in RGR, however, a more mechanistic
approach has to be followed, in which growth is analyzed in terms of the plant’s carbon (C)
economy. This requires knowledge of the C-gain of the plant in photosynthesis, and C-losses
in leaf, stem, and root respiration, all integrated over the day. The net increase in C over
the day can be converted into a dry mass increase, if the C-concentration of the newly formed
material is known. A formula to relate the C-fluxes to RGR is presented in the second part
of Box 3.2.
Given that 85%–95% of plant dry matter is composed of carbon-based compounds (for a
review see Poorter and Villar 1997), it is beyond doubt that almost all newly formed biomass
TABLE 3.3
Growth Response Coefficients for ULR,
LAR, SLA, and LMF
GRC
ULR 0.26
LAR 0.74
SLA 0.63
LMF 0.11
Note: Average values from a literature survey on causes of
inherent variation in RGR. A total of 111 articles were
compiled. Only those reports were considered where RGR
differences between species or genotypes were at least
40 mg g
1
day
1
. More details are given in Poorter and
van der Werf, 1998.
Francisco Pugnaire/Functional Plant Ecology 7488_C003 Final Proof page 79 30.4.2007 7:56pm Compositor Name: DeShanthi
Ecological Significance of Inherent Variation in Relative Growth Rate and Its Components 79