Phadke A.G., Thorp J.S. Synchronized Phasor Measurements and Their Applications
Подождите немного. Документ загружается.

224 Chapter 10 Electromechanical Wave Propagation
It can be seen that there seems to be a delay between the frequencies at dif-
ferent points in the system. Similar effects were noticed in a variety of ex-
periments [1, 2]. The event described in [1] was a load rejection test in
Texas monitored with PMUs. The authors state ‘Note the delay detecting
the transient between the point closest to the plant (Venus) and the furthest
(Robinson). There is nearly a half second delay between the onset of the
frequency disturbance near the plant and its appearance at a similar level at
a remote site. The propagation phenomenon is not clear. It is not electrical
in nature because of the time lag. It appears to be related to the localized
electrical inertia in the system.’ A similar staged event in July, 1995
showed a delay of approximately a second between PMUs in Florida and
New York [3].
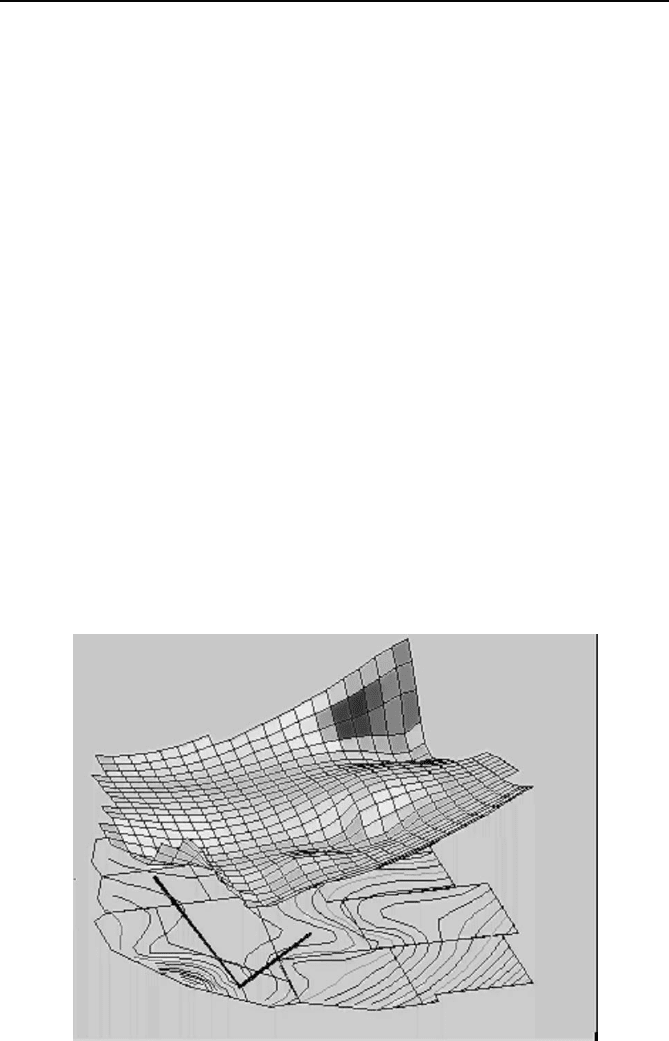
The second motivation was a desire to display the phasor measurements
obtained in the study described in Section 8.5.1 for the WECC 1994 dis-
turbance. The plot of Figure 10.2 was produced by locating the phasor
measurements geographically on a map of the WECC, making the z vari-
able at that point the angle measurement, and then fitting a smooth surface
to those points. By sampling the phase angles in time a movie of the sur-
face can be obtained. Constant contour lines are shown below on a map
showing state borders and the location of the two DC lines. Since to a first
approximation power flows down hill in angle, transmission lines should
be constructed perpendicular to the constant contour lines. Of course, the
contour map changes in response to system conditions
Fig. 10.2 Phase angle as a function of location.
10.2 The Model 225
The movies produced show wave-like motion of the surface when simu-
lated or measured phasor quantities are used to draw the surfaces. There
have been early attempts to describe this behavior even before phasor
measurement data were available. Over a 30-year period [4–7] a number of
authors have derived a wave equation for an idealized continuum power
system model. In [4–7] linearized swing equations are written with the DC
power-flow assumptions for a uniform, isotropic, and lossless network. A
different approach in [7] produced an elliptic partial differential equation
for a continuum load flow. In [7] the load flow equations are written under
the DC load flow assumptions but the uniformity and isotropy constraints
are relaxed. In [8–10] a combination of the two approaches produces a dif-
ferent model.
10.2 The Model
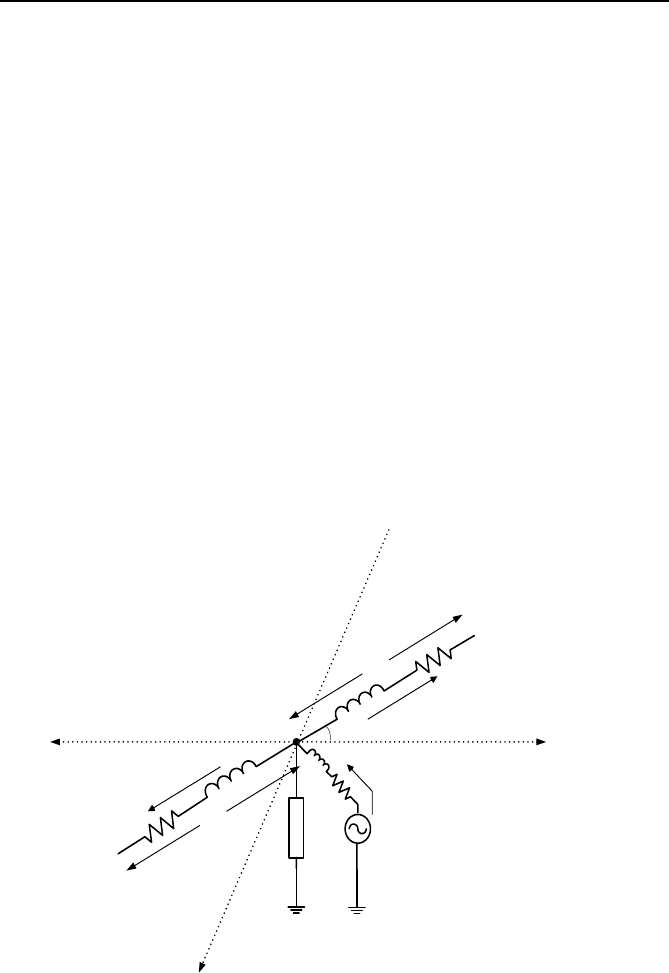
Consider the element at point (x, y) shown in Figure 10.3 with
Fig. 10.3 Incremental power system model.
P
i
+
P
i
-
V(x,y)
θ
i
branch ‘i’
Δ
(x,y)
x - axis
y
-
a
xis
P
Δ
226 Chapter 10 Electromechanical Wave Propagation
R
i
+ jX
i
: p.u. line impedance
1/(R
s
+jX
s
) : p.u. generator admittance
G
s
+jB
s
: p.u. shunt admittance
|V|: voltage magnitude
φ(x,y): internal voltage phase angles
δ(x,y): external voltage phase angles
M: generator inertia
D: generator damping
P: mechanical power injection
θ
: angle of the branch with respect to the x–y axis
The power flow at the external node (x, y) must satisfy the load flow equa-
tion in Eq. (10.1)
[]
[]
[]
[]
2
ii
22 2
i1
ii
2
i
i
22 2
ii
2
s
22 2
ss
2
s
22 2
ss
1cos(δ(, ) δ(, ))
()
sin(δ(, ) δ(, ))
()
1cos(δ(, ) (, ))
()
sin(δ(, ) (, ))
()
N
i
i
RV
x
yxxyy
RX
XV
xy x x y y
RX
RV
xy xy
RX
XV
xy xy
RX
ϕ
ϕ
=
Δ
−−+Δ+Δ
Δ+
Δ
+ − +Δ +Δ
Δ+
Δ
=−−
Δ+
Δ
+−
Δ+
∑
(10.1)
And the power flow at the internal node(x,y) must satisfy the swing equa-
tion in Eq. (10.2). The next step is to write Taylor series expansions
of
δ(, )
ii
x
xy y±Δ ±Δ , to use trigonometric identities for small angles and
take the limit as
0→Δ . Two coupled partial differential equations result.
One is the swing equation in Eq. (10.3) where virtually everything is a
function of x and y, that is, m(x,y), d(x,y), p
m
(x,y), g
int
(x,y), b
int
(x,y), φ(x,y),
and δ(x,y). The other equation is the continuum load flow equation in Eq.
(10.4). The conductance G and susceptance B are 2 × 2 tensor fields, func-
tions of (x,y) which capture the nonuniformity and anisotropy in the net-
work
10.2 The Model 227
[]
[]
2
2
2
s
22 2
ss
2
s
22 2
ss
1cos((,)δ(, ))
()
sin( ( , ) δ(, ))
()
MDP
tt
XV
x
yxy
RX
XV
xy xy
RX
φφ
φ
ϕ
∂∂
+=−
∂∂
Δ
−−
Δ+
Δ
−
Δ+
(10.2)
[]
2
int int
2
1cos( δ)] sin( δ)
m
mdpg b
tt
φφ
φφ
∂∂
+
=− − − − −
∂∂
(10.3)
[
]
[][]
int int s
() δδ
cos(δ )1 sin(δ )gbg
δ
φφ
−∇• ∇ + ∇ • •∇ =
−
−− − −
BG
(10.4)
Equations (10.3) and (10.4) are coupled by the angle difference
δ
φ
− .
Equation (10.4) is a continuum load flow with no time dependence. In
principle, given a
),( yx
φ
, equation (10.4) can be solved for δ(, )
x
y . Al-
ternately, given
),( yx
φ
equation (10.3) can be solved for δ(, ,)
x
yt ; that
is, equation (10.3) is a swing equation for each (x,y).
The phase angle gradient field
δ
∇
is imaged to the power-flow field P
through
( δ)P
=
−∇B
(10.5)
Several things can be noticed. The first is that the power injected at a point
(x,y) in the system is
(, ) ( δ) δδpxy
⎡⎤
=−∇• ∇ +∇ • •∇
⎣⎦
BG
(10.6)
The nonlinearity is in the second term and is due to the electrical losses.
The lossless models in [4, 5, 6, 7] had linear wave behavior because they
had no losses. It must be observed that the equation in Eqs. (10.3) and
(10.4) describe an electromechanical system, not an electromagnetic sys-
tem. It may be disquieting that linear electrical losses produce a nonlinear
effect in the electromechanical system. Further, the net power loss in a re-
gion R in the system is given by

228 Chapter 10 Electromechanical Wave Propagation
( δδ)d d
loss
R
R
Pxy=∇••∇
∫∫
G
(10.7)
A linear analogy can be made between the electromechanical model and
the electromagnetic wave propagation model. It is summarized in Table
10.1
Table 10.1 Correspondance between linear electromagnetic and electromechanical
systems.
Electromagnetism Electromechanical
Quantity Relationship Quantity Relationship
Electric
potential
VE ∇−=
Voltage phase
angle
δ
−
∇
=
Φ
Electric field
Intensity
Phase angle
gradient field
Permittivity
tensor
ED ε=
Susceptance
tensor
B
=
P Φ
Electric flux
density
D∇−=
ρ
Power flow
density
Pp •∇−=
Charge
density
Power injection
density
V( ∇•∇−=ρ ε )
)(p δ∇•∇−= B
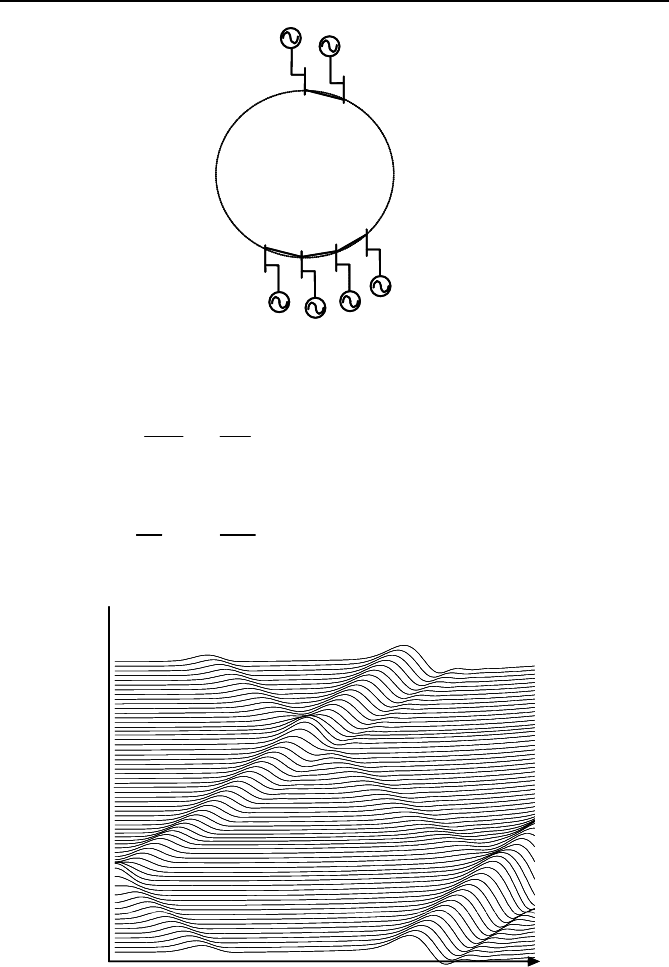
Example 10.1 A ring system.
As an example consider a ring system made up of 64 identical generators
connected in a ring with identical transmission lines connecting the gen-
erator.
If the equilibrium is chosen as a 2π increase in angle in the counter-
clockwise direction around the ring then power flows in the same direction
(Figure 10.4). The discrete model has 64 differential and algebraic equa-
tions in the form of Eq. (10.8) or the continuum form is Eq. (10.9):
[]
[]
[][]
2
int
2
11
11int
sin( δ )
2cos(δδ)cos(δδ)
sin(δδ)sin(δδ)sin(δ )
m
i
ii ii
ii ii
ii ii ii
d
MPb
dt
bb
φ
φ
φ
+−
+−
=− −
−−−−
+−+−= −
(10.8)
10.2 The Model 229
Fig. 10.4 Uniform power flow in a counterclockwise direction.
[]
2
2
int
2
2
() sin(() δ())
64
mx b x x
t
ϕπ
φ
∂
⎛⎞
=− −
⎜⎟
∂
⎝⎠
(10.9)
[]
2
2
int
2
δδ
sin( ( ) δ())bb xx
xx
φ
∂∂
⎛⎞
−= −
⎜⎟
∂∂
⎝⎠
(10.10)
Fig. 10.5 The 64 angles from Example 10.1 versus time.
Time
δ
n
(t) n=1,2…64
0
2π
Time
δ
n
(t) n=1,2…64
0
2π
64
1
2
63
31
32
64
1
2
63
32
31
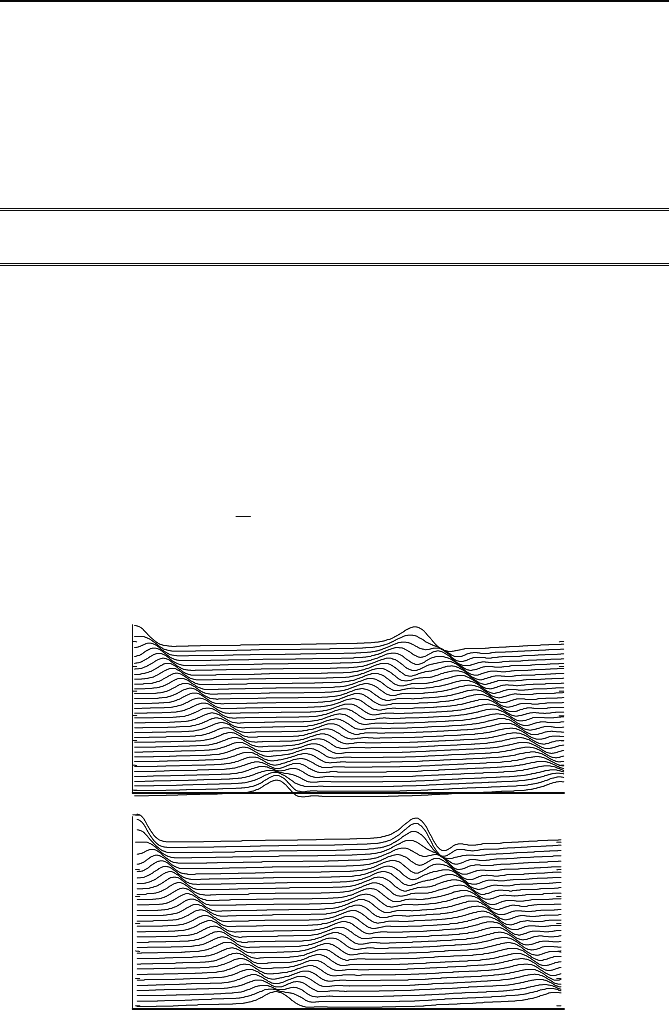
230 Chapter 10 Electromechanical Wave Propagation
The model has no source admittance and hence no dispersion. The 64 an-
gles from the discrete model are shown with δ
1
at the bottom and δ
64
at the
top. Figure 10.5 shows an initial perturbation from the equilibrium about a
quarter of the way around the ring propagating in both directions. Re-
markably it grows in the counterclockwise direction but decays in the
clockwise direction.
Example 10.2
A more realistic power flow is around both sides of the ring in the same
direction. Let the equilibrium angles be
2
0.1( 15.5)
δ / 32, 1, 2,...32
δ (64 ) / 32, 33,34,...64
1
with δ
2
ek
ek
x
kk
kk
e
π
π
−−
==
=− =
=
(10.11)
Then the waves are as shown in Figure 10.6
Fig. 10.6. Phase angles versus time for Example 10.2.
0
0
π
π
δ
k
(t) k=1,2,…32
δ
k
(t) k=33,34 …64
0
0
π
π
δ
k
(t) k=1,2,…32
δ
k
(t) k=33,34 …64
10.3 Electromechanical telegrapher’s equation 231
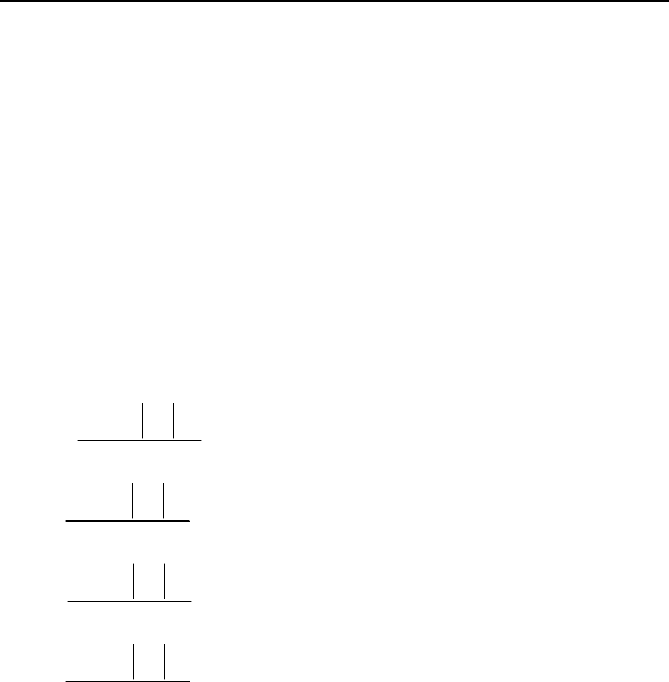
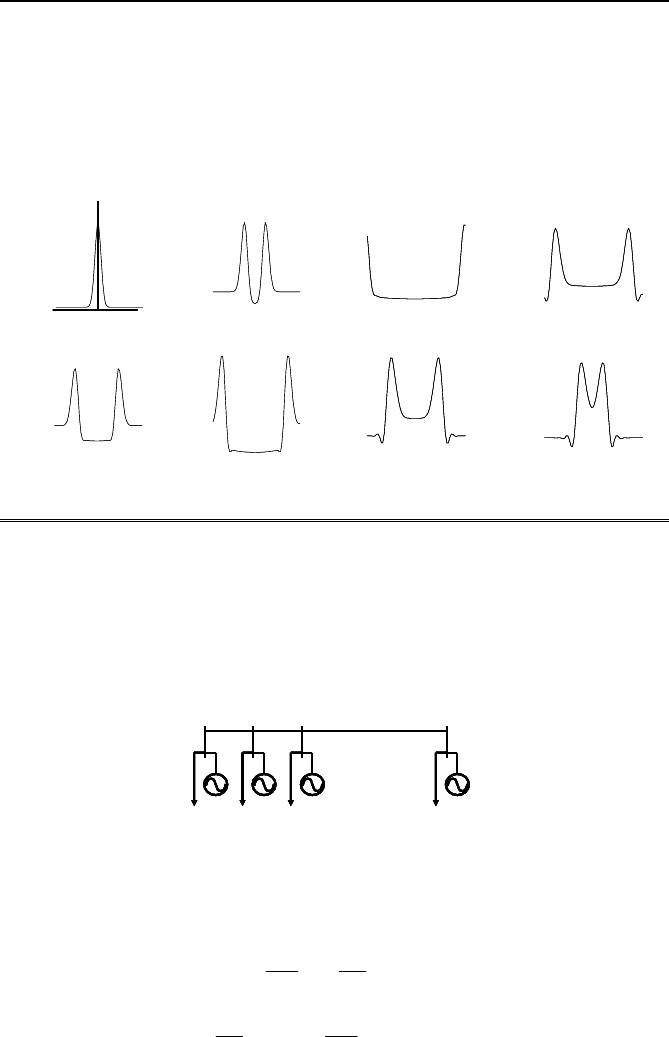
Vertical cross-sections of the phase angle for Example 10.2 are shown in
Figure 10.7. Each of the eight figures is the angle at a fixed instant in time
plotted versus position around the ring δ(
θ
,t), where
θ
is the position on
the ring as shown for the first cross-section. The pulse separates into two
pulses in the second cross-section, spreads in the next two cross-sections,
crosses and returns to the center in the last two cross-sections.
Fig. 10.7 Vertical cross sections of phase angle.
10.3 Electromechanical telegrapher’s equation
If we open up the loop in Example 10.1 so we have a line rather than a
ring, a system such as that shown in Figure 10.8 is produced.
Fig. 10.8 A one-dimensional line.
If we assume small internal impedances and R<<X the equations become
,)(
)(
x
xb
t
p
x
p
t
xm
∂
∂
−=
∂
∂
∂
∂
−=
∂
∂
ω
ω
(10.12)
P
1
P
2
P
3
P
N
………
P
1
P
2
P
3
P
N
………
P
2
P
3
P
N
………
1
2
3
4
2 3 4 spreading
5
6
7
8
5
5 crossing
7, 8 recombining
δ(θ,o)
−π π
θ
1
2
3
4
2 3 4 spreading
5
6
7
8
5
5 crossing
7, 8 recombining
5
6
7
8
5
5 crossing
7, 8 recombining
δ(θ,o)
−π π
θ
232 Chapter 10 Electromechanical Wave Propagation
where
P = –b
δδ
.
x
t
ω
∂
∂
=
∂
∂
(10.13)
The result is a form of the Telegraphers equation in angle and power rather
than voltage and currents.
22
22
δδ
() () () ,
m
mx p x bx
tx
∂∂
=+
∂∂
(10.14)
which has
0
()
velocity , 1/ ( ) ( )
()
bx
Z
bxmx
mx
==.
(10.15)
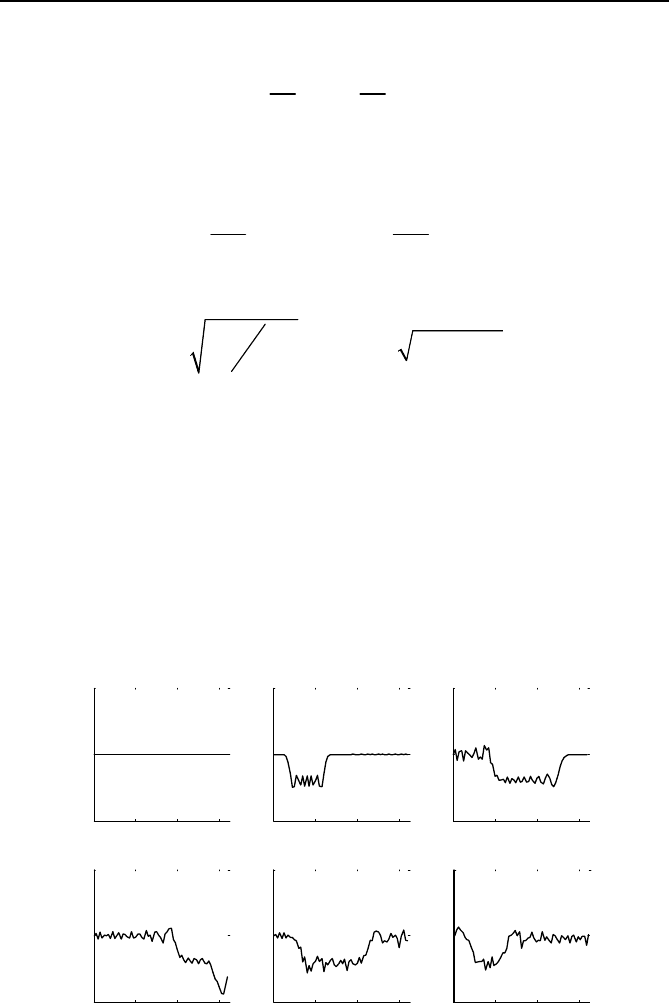
Fig. 10.9 Time snapshots of angular velocity versus position.
0 20 40 60
-5
0
5x 10
-4
0 Seconds
0 20 40 60
-5
0
5x 10
-4
3.7 Seconds
0 20 40 60
-5
0
5x 10
-4
14.5 Seconds
0 20 40 60
-5
0
5x10
-4
22.9 Seconds
0 20 40 60
-5
0
5x10
-4
41 Seconds
0
40 60
-5
0
5x 10
-4
49.4 Seconds
In other words the one-dimensional line has a characteristic velocity of
propagation and a characteristic ‘impedance’. The impedance is not in
ohms, since the ratio is angle divided by power rather than volts divided by
amps. The velocity of propagation measured in the power system is far less
than the velocity of light and varies in different parts of the country.
Speeds of hundreds of miles a second to a thousand miles per second have
been observed in the frequency measurement network (FNET) system [11]
where the measured waves are in frequency rather than angle. They are, of
course, a different manifestation of the same waves.
10.4 Continuum voltage magnitude 233
Determining the onset of a wave can be complicated with electromechani-
cal waves just as in electromagnetic waves. The use of discriminant func-
tions as in traveling wave relays [12] is possible
.2
,2
0
0
−
+
=−=
=+=
ωω
ωω
pZD
pZD
r
f
(10.16)
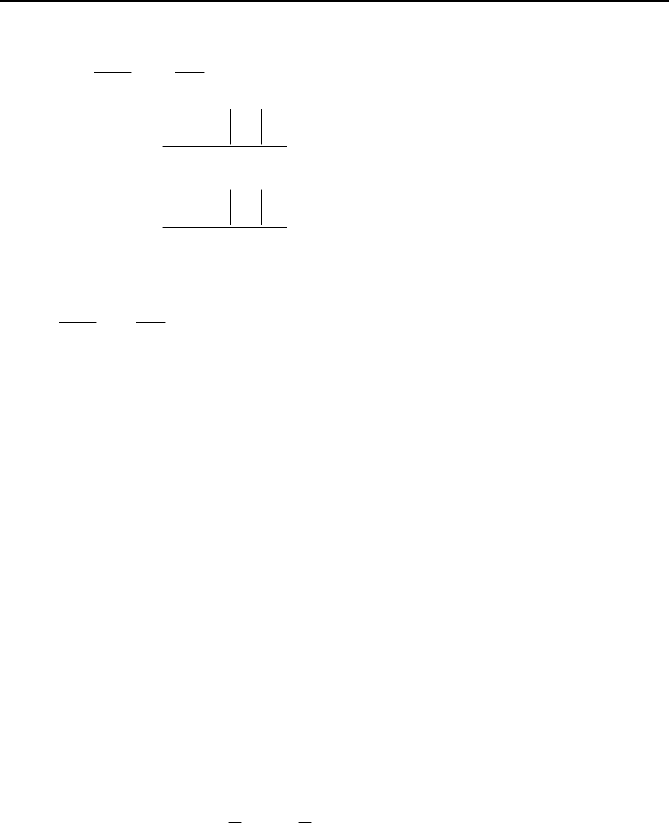
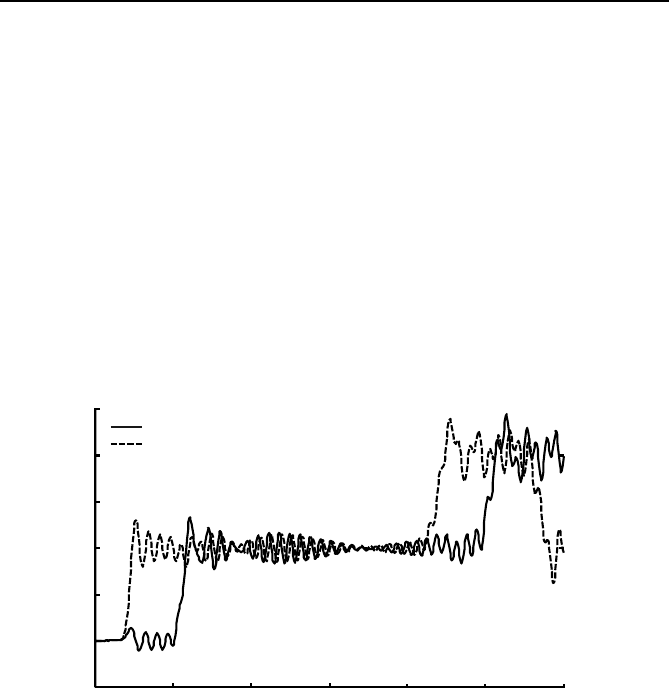
Typical plots of angular velocity versus position along a uniform line are
shown in Figure 10.9 at a sequence of times. Although the waves begin
crisply, they become distorted as time goes on. The forward and reverse
discriminant functions are shown in Figure 10.10
Fig. 10.10 Forward and reverse discriminate functions for the example.
10.4 Continuum voltage magnitude
The development of Section 10.2 assumed constant voltages. The load
flow equation can be re-derived with the external bus voltage magnitude
depending on (
x,y), that is,
.),(
),( yxj
eyxE
δ
(10.17)
The resulting two equations are a real power equation
0 10 20 30 40 50 60
-2
0
2
4
6
8
10x 10
-4
Forward discriminan
t
Reverse discriminant
Ti
m
e
(
seconds
)