Phadke A.G., Thorp J.S. Synchronized Phasor Measurements and Their Applications
Подождите немного. Документ загружается.

184 Chapter 8 Control with Phasor Feedback
.0)()(),,
,0)(),,(
2
0
2
00
2
0
2
0
2
0
≥+−−−−=
≥++−−=
ΛD(F)IFK
ΛD(F)IFD
zrzrzr(
zzrzr
(8.13)
The two matrices are obtained by mapping 8.11 into the
λ plane. Such an
F is called feasible. The system described by Eq. (8.11) is stable by its
very structure. The problem is that the low-frequency natural frequency
may have very small real parts. If we could find a matrix
F so that the ei-
genvalues
λ of Eq. (8.12) were in the region R
1
in Figure 8.12 we would
have guaranteed damping of low-frequency modes. A direct test for eigen-
values
λ in to be in R
1
in Figure 8.12 is quite difficult but a test for the ei-
genvalues,
λ in Figure 8.12 to be in the left half plane is simple. Hence the
mapping in Eq. (8.12) is used, recognizing that Eq. (8.13) is in the form
T22
0
T2
0
00,
() 0 0,
ii i ij
ii i ij
zgurg
rz h v h
+≥=−=
−− ≥ = =
GBFB
HBFB
(8.14)
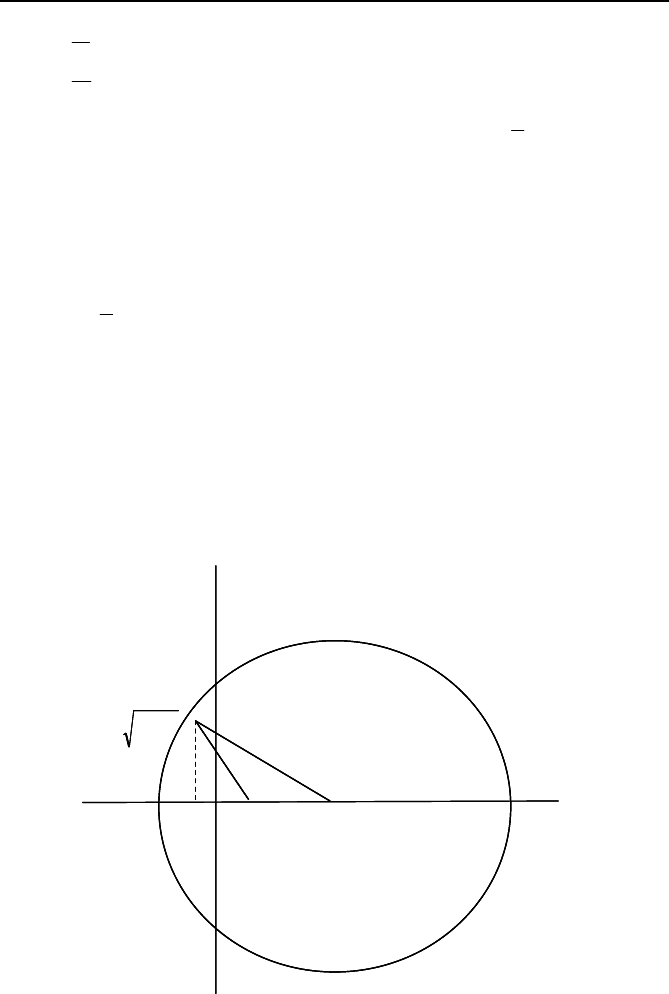
where
u
i
and v
i
are scalars depending on the geometry as shown in Figure
8.13, and
G and H are diagonal matrices. Conditions are given in [7] but
the numerical test is simply to apply the QR decomposition to the matrix
B, i.e. if
Fig. 8.13 The values of u
i
and v
i
for Eq. (8.14).
u
i
Re
v
i
2
i
i
1 α−ω
ii
ωα
z
0
r-z
o
Im
u
i
Re
v
i
2
i
i
1 α−ω
ii
ωα
z
0
r-z
o
Im
u
i
Re
v
i
2
i
i
1 α−ω
ii
ωα
z
0
r-z
o
Im

8.4 Coordinated control of oscillations 185
T
,
0
⎡
⎤
=
⎢
⎥
⎣
⎦
R
TB
(8.15)
where
T is orthogonal and R is upper triangular. Then Eq. (8.14) is equiva-
lent to
T
T
TT
00
T
T
TT
00
0
0,
00
00
0
() () 0.
00
00
zz
rz rz
⎡⎤
⎡⎤⎡⎤
+=+ ≥
⎢⎥
⎢⎥⎢⎥
⎣⎦⎣⎦
⎣⎦
⎡⎤
⎡⎤⎡⎤
−− = +− ≥
⎢⎥
⎢⎥⎢⎥
⎣⎦⎣⎦
⎣⎦
RR
RFR
TGT F TGT
RR
RFR
THT F THT
(8.16)
The fact that G and H are diagonal, combined with the assumption that
there are no open loop eigenvalues on the circle in Figure 8.11 allows one
remaining transformation. If there are no eigenvalues on the circle, then
M
22
in Eq. (8.17) is invertible:
T
;
.
−
−
⎡⎤⎡ ⎤
==
⎢⎥⎢ ⎥
−
⎣⎦⎣ ⎦
⎡⎤
−
=
⎢⎥
⎣⎦
11 12
T1T
12 22 22 12
1T
TT
11 12 22 12
22
MM I 0
TGT ; U
MM MMI
MMMM 0
UTGTU
0M
(8.17)
If
HTT
T
=N, then the final conditions are that
[]
[]
TT
12
1
22
1211
1
0
TT
12
1
22
1211
1
0
22
z
1
zr
1
0
−−−
−−−
−≥
≥
−
−
≥
RMMMMR
F
RNNNNR
M
(8.18)
If there are sufficient well-placed measurements and there is one feasi-
ble matrix F then F is not unique. The choice of optimal F as the one with
minimum Frobenius norm is suggested in [7]. The Frobenius norm of F is
given by 8.19:
186 Chapter 8 Control with Phasor Feedback
.min
11
2
⎟
⎟
⎠
⎞
⎜
⎜
⎝
⎛
=
∑∑
==
m
i
m
j
ij
f
F
F
(8.19)
In [7] it is shown that if the problem is one of minimizing the norm in
Eq. (8.19) subject to the constraints of Eq. (8.18), one must compute the
Schur factorization of
11TTT
11 12 22 12
0
1
.
RR
z
−−−
⎡⎤
−=
⎣⎦
MMMM SDS
(8.20)
In Eq. (8.20) S is orthonormal and D is diagonal. Replace the negative
entries on the diagonal of D with zero and call the result
D . If
TT
0
T
1
rz
then
−
−−
⎡⎤
≤−
⎣⎦
−
=
11T
11 12 22 12
SDS R N N N N R
FSDS
(8.21)
The minimum norm F obtained from Eq. (8.21) may, in fact, not be fea-
sible under some situations. Hence it is worth examining the closed loop
eigenvalues before using it. The conditions in Eq. (8.18) provide an inter-
val in which
F must lie. The matrix in Eq. (8.18) is a more reliable choice
for
F.
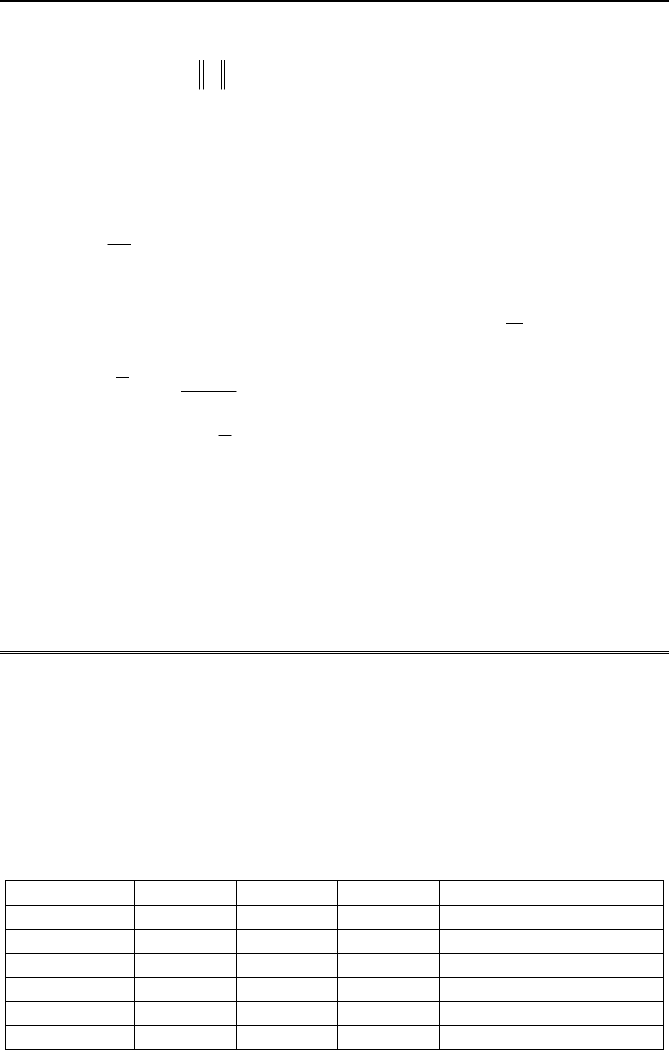
Example 8.5
The Matlab file TAC92.m has a 12-dimensional system with eigenvalues
given in Table 8.3. The radius of the circle in Figure 8.3 is
r = 5 and the
center is at
z
0
= 4. The B matrix is also shown in Table 8.3. Using F = N
1
the closed loop eigenvalues are shown in Figure 8.14.
Table 8.3 Data for Matlab example
Eigenvalues B
Closed loop
λ
s
–0.1 ± j1 3.6946 0.1730 0.1365 –9.3842
–0.2 ± j2 0.6213 1.9797 0.0118 –4.5731
–0.3 ± j3 0.7948 0.2714 2.8939 –0.6803
±
j5.7594
–0.4 ± j4 0.9568 0.2523 0.1991 –0.6741
±
j4.7032
–0.5 ± j5 0.5226 0.9757 0.2987 –0.4494
±
3.9404
–0.6 ± j6 0.8801 0.7373 0.6614 Four at –1.000
8.4 Coordinated control of oscillations 187
Fig. 8.14 Open and closed loop eigenvalues.
%TAC92.m 7-3-2007 Section 8.4
hold off
r=5;
z0=4;
w=[1 2 3 4 5 6];
B=[ 3.6946 0.1730 0.1365
0.6213 1.9797 0.0118
0.7948 0.2714 2.8939
0.9568 0.2523 0.1991
0.5226 0.8757 0.2987
0.8801 0.7373 0.6614];
A(1:6,1:6)=0*eye(6);
A(1:6,7:12)=eye(6);
A(7:12,1:6)=-diag(w.^2);
A(7:12,7:12)=-2*diag(.1*w);
% plot open nlop eigenvalues and the circle
xp=-.1*[1:11]+.1;
plot(eig(A),'ro')
axis([-8 4 -8 8])
-6 -4 -2 0 2 4
-6
-4
-2
0
2
4
6
Open loop
λ
s
Closed loop
λ
s
-6 -4 -2 0 2 4
-6
-4
-2
0
2
4
6
O
p
en loop
λ s
Closed loop λ
s

188 Chapter 8 Control with Phasor Feedback
hold on
plot(xp,sqrt(9+8*xp-xp.*xp),xp,-sqrt(9+8*xp-xp.*xp))
%Form the diagonal matrices G and H is Eq. (8.14)
G=0*eye(6);
H=G;
for i=1:6,
H(i,i)=w(i)^2-.2*w(i)+1;
G(i,i)=0.8*w(1)+w(i)^2-9;
end
% now the QR decomposition of B and the formation of M and N in
% Eqs. (8.17) and (8.18)
[T,RR]=qr(B);
M=T'*G*T;
MM(1:3,1:3)=M(1:3,1:3)-M(1:3,4:6)*inv(M(4:6,4:6))*M(4:6,1:3);
MM(4:6,4:6)=M(4:6,4:6);
eig(MM(4:6,4:6));
N=T'*H*T;
NN(1:3,1:3)=N(1:3,1:3)-N(1:3,4:6)*inv(N(4:6,4:6))*N(4:6,1:3);
NN(4:6,4:6)=N(4:6,4:6);
%
R=RR(1:3,1:3);
% M1 and N1 are the matrices in equation (8.18)
M1=(1/z0)*inv(R)*MM(1:3,1:3)*inv(R)';
N1=(1/(r-z0))*inv(R)*NN(1:3,1:3)*inv(R)';
% the Schur decomposition for the minimum norm F
[S,V]=schur(M1);
VV=V;
for i=1:3,
if(V(i,i) < 0), VV(i,i)=0; end
end
F=S*VV*S';
%Test eig(F-M1)
F=N1;
eig(G+4*B*F*B')
189
eig(H-B*F*B')
%Plot Closed loop eigenvalues
A(7:12,7:12)=A(7:12,7:12)-B*F*B';
plot(eig(A),'bx')
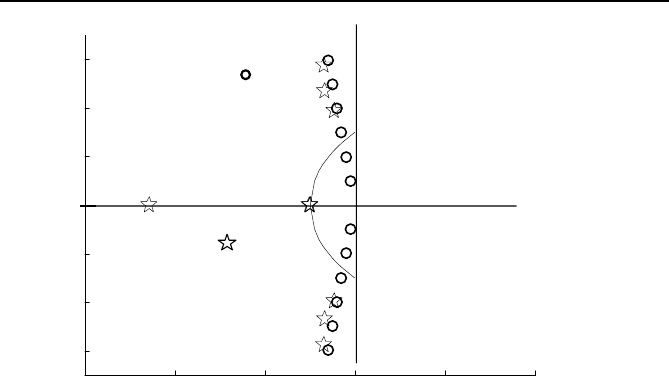
Example 8.6
Joshua K. Wan
J
Fig. 8.15 The model two area system.
The HVDC line is modeled as two loads: one load connected to the bus at
each area interface. The amount of power drawn by one load is exactly
equal to the power supplied by the other load. The collocated control
scheme is to modulate the power flow along the line proportional to the
frequency difference between areas measured by the PMUs at either end of
the line. The frequency measurement taken at the remote bus (Area 2) is
subject to communications delay. Assuming a dedicated fiber-optic com-
munication channel connecting Areas 1 and 2 it is reasonable to assume that
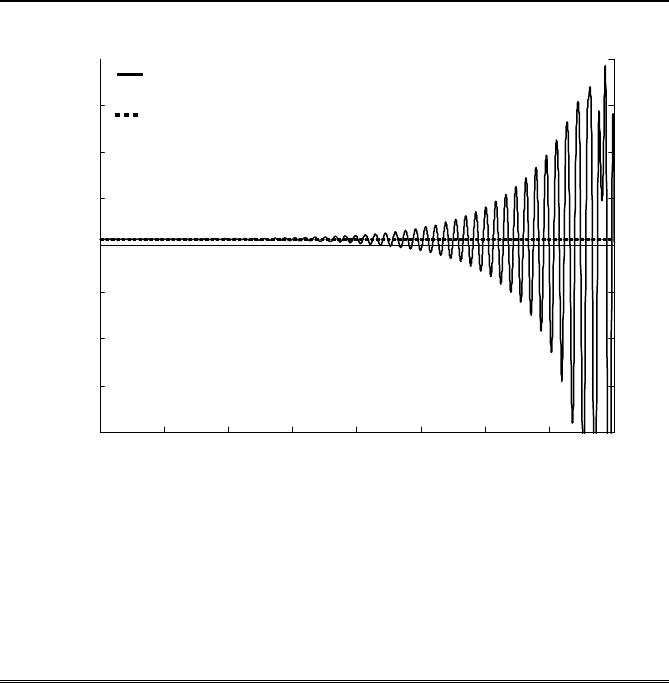
the delay is less than 50 ms. Figure 8.17 shows the collocated controller
Area 1
Area 2
Line 1 220 km
Line 2 220 km
413 MW
HVDC Line
PMU PMU
8.4 Coordinated control of oscillations
The system in Figure 8.15 [4] is a four-generator two-area system used as
an example of a power system stabilizer (PSS) design. The four generators
are identical except for the inertias which are 6.5 s in Area 1 and 6.175 in
area 2. The two areas are connected by two 220-km 230 kV lines. Without
the stabilizer there is an unstable low-frequency interarea mode at 0.64 Hz.
The system has been modified [8] by adding a parallel HVDC line con-
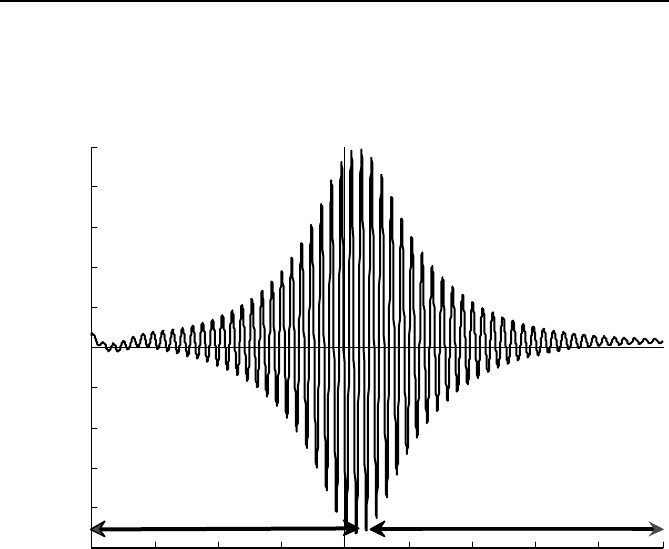
necting the two areas. In [8] an artificial situation is created to study the ef-
fect of collocated control using the HVDC line. The situation studied is a
period with the PSS not in service and after the 0.64-Hz oscillation has
grown the PSS is inserted to damp the oscillation. The power flow between
the systems is shown in Figure 8.16
190 Chapter 8 Control with Phasor Feedback
performance with no delay. Delays up to 300 ms cause no noticeable deg-
radation in the performance.
Fig. 8.16 The power flow between areas when the PSS is inserted after 50 s.
The compelling reason to use the collocated scheme is its robustness. To
test the robustness the following system changes were made without
changing the control algorithm.
1. Increase system-wide loading by 50%:
A1: +50%, A2: +50%
A1: –50%, A2: –50%
A1: +50%, A2: –50%
A1: –50%, A2: +50%
2. Increase nominal power flow along DC tie by 100 MW.
3. Change the lengths of the AC tie lines by 10%.
4 Change the generator inertias:
Area 1: 7.5 s
Area 2: 5.175 s
10 20 30 40 50
60
70 80 90
100
413.2
413.25
413.3
413.35
413.4
413.45
413.5
413.55
413.6
413.65
413.7
Time
Power P, MW
Active power from Area 1 to Area 2
With PSS
No PSS
8.5 Discrete event control 191
Fig. 8.17 Performance of the collocated controller.
For all these simulations the communications delay was kept at a constant
50 ms. None of these system changes had any noticeable effect on the per-
formance of the controller.
8.5 Discrete event control
0 10
20
30
40
50 60 70 80
100
200
300
400
500
600
700
800
Time t (s)
Power P, MW
Active Power from Area 1 to Area 2:
Communications delay = 50 ms
no HVDC control
with HVDC control
All of the control in the previous sections has been continuous feedback
control, that is, the control, u(t), depends on the state, x(t), at each instant
of time. It x(t) changes then u(t) changes with a small delay induced by
communication latency (actually u(t)=f(x(t – Δt)). The power system,
however, has other types of control which can be characterized as discrete
in their dependence on state. These controls are typically stability controls
and are characterized by a specific action taken when the state exceeds a
limit. Examples are the use of the dynamic brake, high-speed switching of
series and shunt capacitors, high-speed generator tripping triggered by the
loss of the direct current (DC) line, and under-frequency and voltage load
shedding. The control action responds to the state but not continuously.
192 Chapter 8 Control with Phasor Feedback
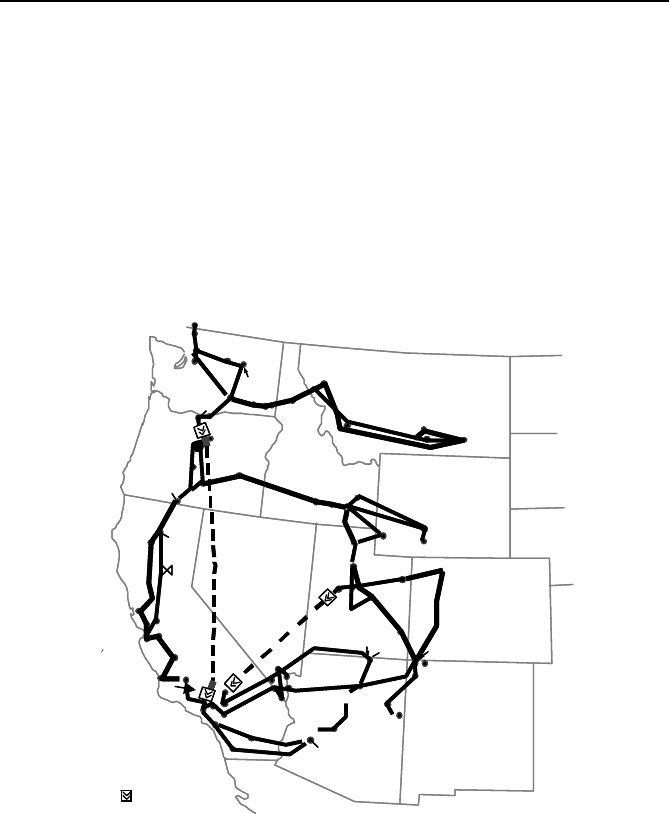
An early phasor measurement application was of this form [9]. The at-
tempt was to control the power flow on the Intermountain and Pacific In-
tertie HVDC lines in a discrete form in response to a collection of ap-
proximately 20 phasor measurements which were to be communicated to
the Sylmar substation (the southern terminal of both DC lines). The control
action was limited to
± 500 MW ramps on each line. The measurement
Fig. 8.18 The WECC System for DC line control.
locations are shown in Figure 8.18. The locations were chosen in part to at-
tempt to get appropriate coverage of dynamic events but also in collabora-
tion with the participating utilities in terms of accessibility of the PMUs
and availability of communication channels. The power system model was
a 176-bus system with 29 generators that included the two DC lines.
The challenge, from a control perspective, is to find a technique that will
determine from the limited measurements which of the nine possibilities in
PMU
HVDC Terminal
-
Angle Measurement Unit
PMU
Phase
-
PMU
PMU
PMU
PMU
PMU
PMU
PMU
PMU
PMU
PMU
PMU
PMU
PMU
PMU
PMU
Sylmar
They are a form of discrete event control where state space has been parti-
tioned by some process. In most early stability controls of this type many
off-line simulations were performed in order to develop the rules for appli-
cation of the control.
8.5 Discrete event control 193
Table 8.4 is the correct choice. In attempting to select an approach it must
be recognized that the off-line calculations of the classical approach are
still appropriate; that is, the map from phasor measurements can be con-
structed from off-line simulations.
Table 8.4 Control options
Intermountain Pacific Intertie
0 0
0 +500 MW
0 –500 MW
+500 MW 0
+500 MW +500 MW
+500 MW –500 MW
–500 MW 0
–500 MW +500 MW
–500 MW –500 MW
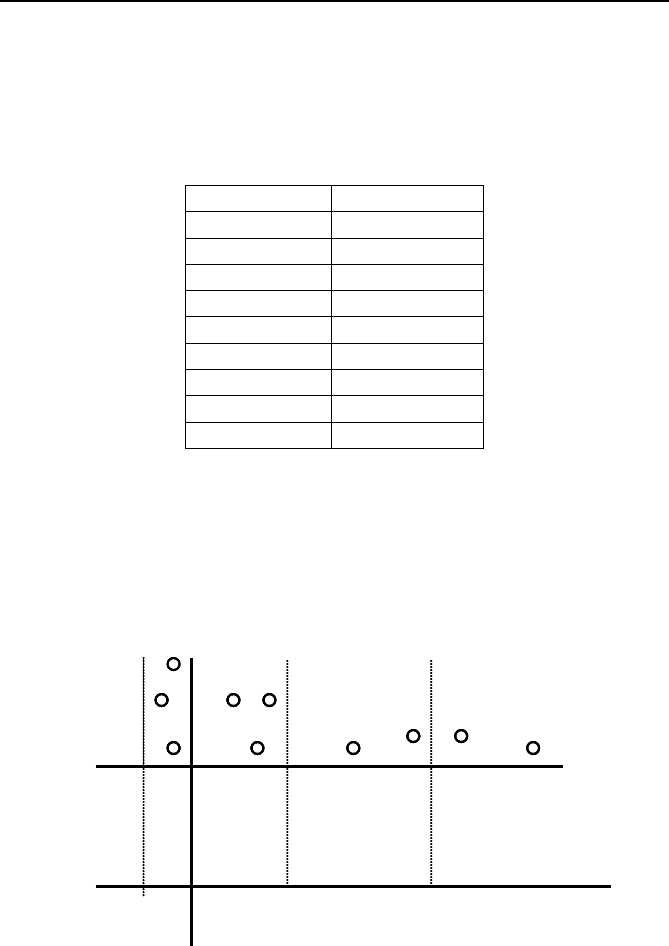
8.5.1 Decision trees
Consider the Xs and Os in the sequence of drawings in Figure 8.19. The
horizontal and vertical lines partition the (
x,y) plane into regions that are
either Xs or Os. The horizontal line at
y = 1.5 has all Xs below, the vertical
line at
y = –0.5 has all Xs to the left.
Fig. 8.19 Initial partitioning.
X
1.0 2.0
1.5
2.0
- 0.5
2.5
X
X
X
X
X
X
X
X
X
X
X
X
1.0 2.0
1.5
2.0
- 0.5
2.5
X
X
X
X
X
X
X
X
X
X
X
1.0 2.0
1.5
2.0
- 0.5
2.5
X
X
X
X
X
X
X
X
X
X
X