Olkkonen J. (ed.) Discrete Wavelet Transforms - Theory and Applications
Подождите немного. Документ загружается.

Transient Analysis and Motor Fault Detection using the Wavelet Transform
49
[] [] []
00
o
J1
j,k j,k j,k j,k
kjjk
xn a n d n
φϕ
−
=
=+
∑∑∑
(12)
where
[]
n
φ
is the scaling function,
[]
0
0
0
j
j
2
j,k
n2 (2nk)
φφ
=−
, is the scaling function at a scale of
o
j
s2= shifted by k,
[]
n
ϕ
, is the mother wavelet,
[]
()
j
j
2
j,k
n2 2nk
ϕϕ
=−
, is the mother wavelet at a scale of
j
s2
=
shifted by k,
0
j
,k
a
, is the approximation coefficients at a scale of
o
j
s2=
j
,k
d
, is the detail coefficients at a scale of
o
j
s2=
and
J
N2= , where N is the number of x[n] samples.
The scaling function can be defined as an aggregation of wavelets at scales larger than 1. A
discrete signal can be constructed by using a sum of J-j0 details and an approximation to 1 of
a signal at a scale of
o
j
s2=
.
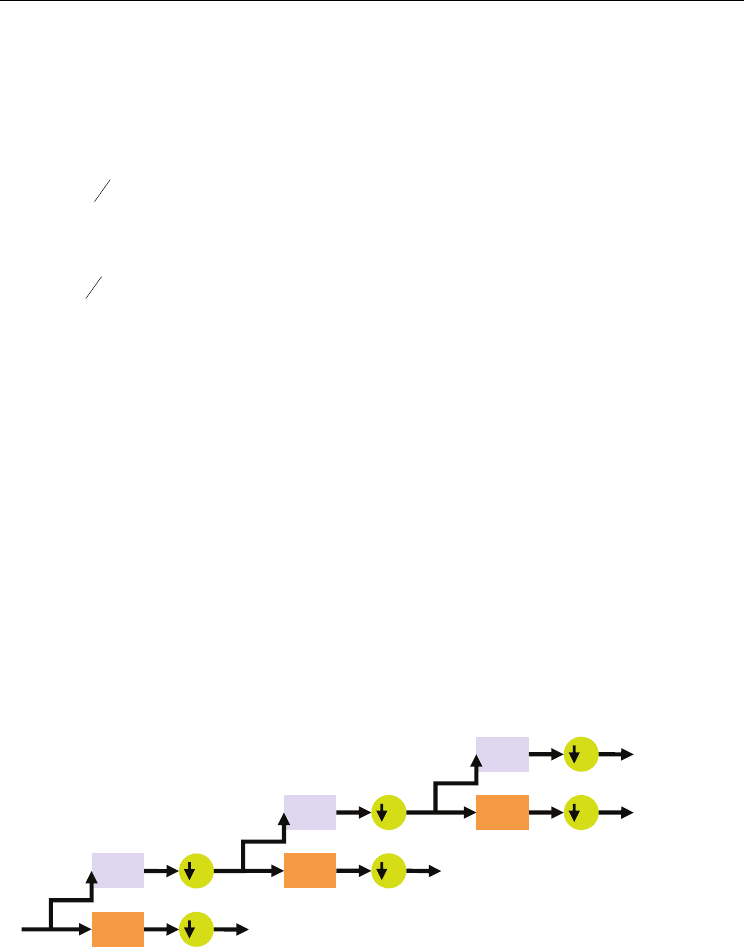
A quick way to obtain the forward DWT coefficients is to use the filter bank structure shown
in Figure 3. The approximation coefficients at a lower level are transferred through a high-
pass (h[n]) and a low-pass filter (g[n]), followed by a downsampling by two to compute
both the detail (from the high-pass filter) and the approximation (from the low-pass filter)
coefficients at a higher level. The two filters are linked to each other and they are known as
quadrature mirror filters. High-pass and low-pass filters are derived from the mother
wavelet and the scaling function, considered respectively in (Mallat, 1998) and (Mallat,
1989).
g[n]
h[n]
2
x
[
n
2
g[n]
h[n]
2
2
g[n]
h[n]
2
2
Level 1 detail coefficients
Level 2 detail coefficients
Level 3 detail coefficients
Level 1 detail coefficients
Fig. 3. Wavelet tree decomposition for three levels of detail
The various frequency range coverings for the details and the final approximation for a
three-level decomposition are shown in Figure 4. These are directly related to the bands
where the analysis will be performed.

Discrete Wavelet Transforms - Theory and Applications
50
Detail
Level 1
Detail
Level 2
Detail
Level 3
Approx.
Level 3
f
s
/2f
s
/4f
s
/8f
s
/160
Fig. 4. Frequency ranges for details and final approximation
Figure 5 represents in a graphical manner the time-frequency window, which has better
resolution on the time domain for high frequencies, and better frequency resolution for low
frequencies, which means fewer resources for processing.
∧
Δ
ϕ
1
2
a
1
a
ω
ω
∧
Δ
ϕ
0
2
a
1
2a
ϕ
Δ
0
a
ω
tab
00
+tab
11
+
t
Fig. 5. Time-Frequency window for the wavelet transform
The shape of the frequency response for these filters depends on the type and the order of
the mother wavelet used in the analysis. In order to avoid overlapping between two
adjacent frequency bands, a high-order mother wavelet has to be used that results in a high-
order frequency filter.
In order to separate the different frequency bands there is an obvious trade-off between the
order of the mother wavelet and the computational cost. Thus, intensive study is needed in
order to adapt the order of the mother wavelet to the requirements.
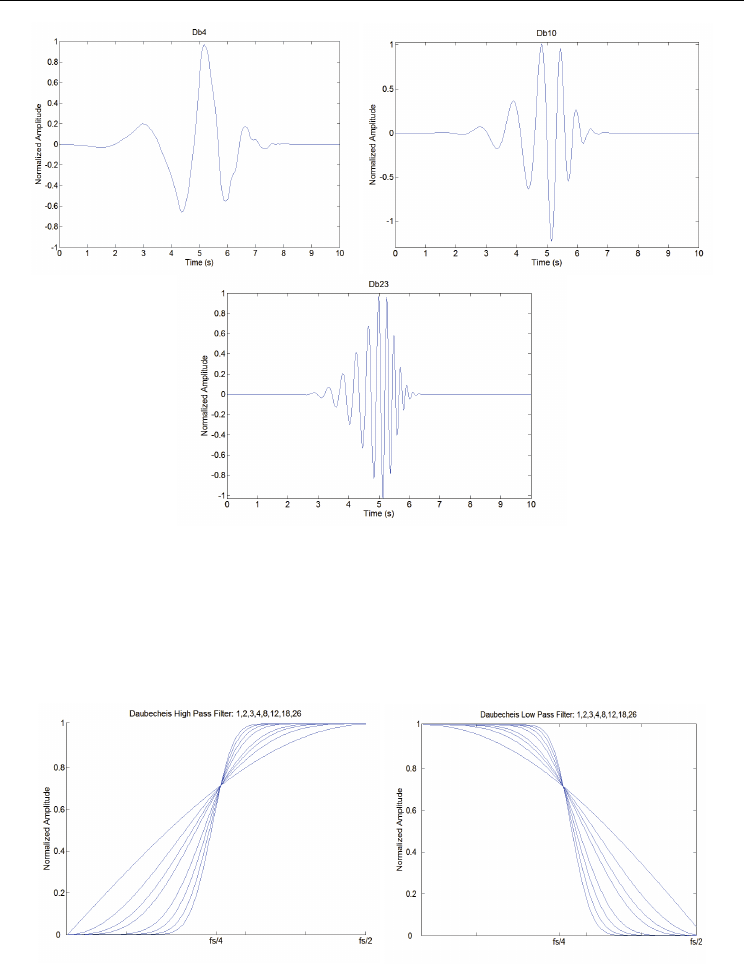
Taking a common wavelet family such as the Daubechies mother wavelet, the mother
wavelet time shape shows an evolution if we just change the Daubechies order as is shown
in Figure 6. Yet, this does not provide clear information for our purpose.
Transient Analysis and Motor Fault Detection using the Wavelet Transform
51
Fig. 6. Daubechies mother wavelet time evolution for order increase
Figure 7 shows the frequency response for low-pass and high-pass filters, which determines
the detail and approximation decomposition for different orders. For low orders the power
of one harmonic near the cut frequency could be split into two different details. This could
give a false impression of the the time evolution of the analyzed signal's frequency
component. By increasing the Daubechies order it is possible to idealize the filters and,
hence, to obtain better frequency decomposition.
Fig. 7. Low- and high-pass filter frequency response corresponding to details
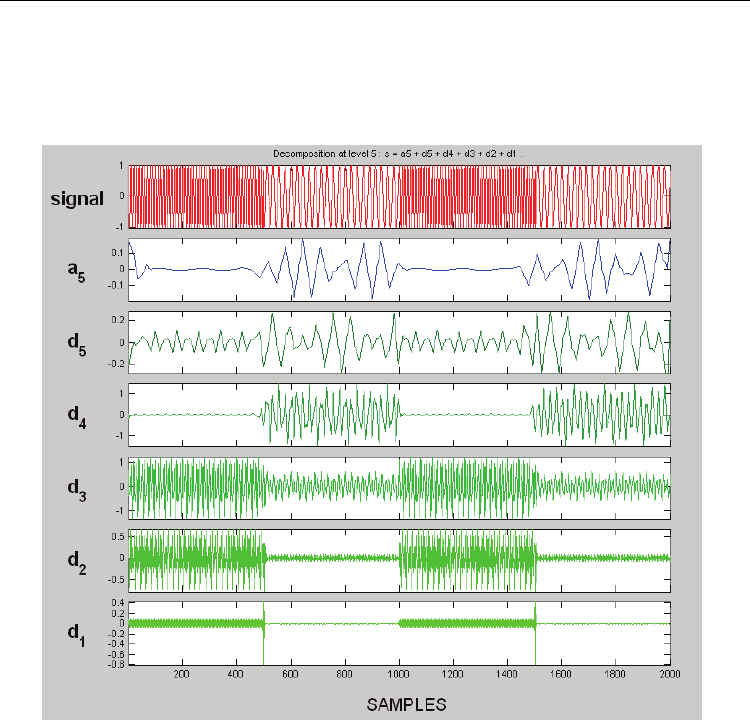
Figure 8 shows an example of this drawback. A test signal has been built with two harmonic
components, one at 100 Hz and the other one at 45 Hz, and the signal has been sampled at
1000 Hz. The wavelet analysis is performed with a Daubechies db3 mother wavelet.
Discrete Wavelet Transforms - Theory and Applications
52
Harmonic content due to the 100 Hz superimposed frequency appears on details 2 and 3;
when it should only appear on detail 3, corresponding to the analysis band between 125 and
62.5 Hz. A high-order Daubechies mother wavelet is needed to prevent this drawback,
which is due to the db3 associated filter not being ideal enough to filter the 100 Hz harmonic
content on detail 2.
Fig. 8. Test decomposition signal with an overlapping effect
2.5 Power detail density (PDD)
In a classical Fourier analysis, the power of a signal can be obtained by integrating the
power spectral density (PSD), which is the square of the Fourier transform’s absolute value.
The power carried by a defined spectral band can be obtained by integrating the PSD along
this band.
A similar derivation can be obtained for a wavelet transform. The power detail density
(PDD) can be described as the squares of the coefficients for one particular detail. The power
energy carried by this detail can be obtained by integrating its PDD.
Discrete wavelet transforms show variations in the harmonic amplitude and location, and
are the most suitable transform to be applied to non-stationary signals. The power detail
density function resulting from a wavelet transform has proven to be one of the best suited
methods for motor fault analysis under variable load, which presents the stator current as a
non-stationary signal.
Transient Analysis and Motor Fault Detection using the Wavelet Transform
53
The average power for a signal
(
)
xt is:
() ()
22
11
P lim x t dt lim x t dt
22
τ
τ
τ
ττ
ττ
∞
−−∞
→∞ →∞
⎡⎤
⎡
⎤
==
⎢⎥
⎢
⎥
⎣
⎦
⎣⎦
∫∫
(13)
Applying Parseval’s theorem, this could be expressed as:
()
()
()
2
2
x
11 1 1
Plim x d lim d Sd
22 2 2 2
τ
τ
τ
τ
ττ
ω
ω
ωωωω
πτ π τ π
∞∞
−−∞ −∞
→∞ →∞
⎡⎤
⎡⎤
⎢⎥
===
⎢⎥
⎢⎥
⎣⎦
⎣⎦
∫∫ ∫
(14)
Where:
()
()
2
x
S lim
2
τ
τ
ω
ω
τ
→∞
⎡
⎤
⎢
⎥
=
⎢
⎥
⎣
⎦
(15)
()
S
ω
is the spectral density of the signal
(
)
xt , and represents the distribution or the
density of power as a function of
ω
.
The energy of a discrete signal can be calculated by averaging the square of all the signal
components inside the unity window, following equation 12:
() ()
()
T
2
R
0
1
Power i t t dt
T
φ
=∗
∫
(16)
3. Experimental results
3.1 Experimental setup
A three-phase, 1.1 kW, 380 V and 2.6 A, 50 Hz, 1410 rpm, four-pole induction motor was
used in this study. Firstly, its healthy performance was analyzed and, afterwards, a sixth of
the rotor bars was damaged as is shown in Figure 8.
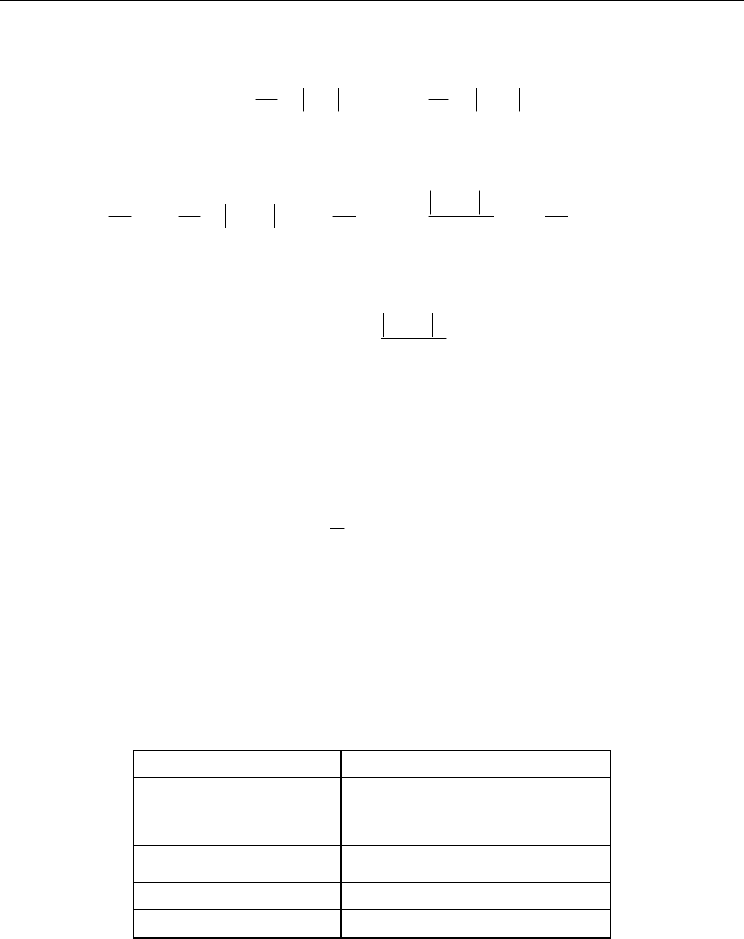
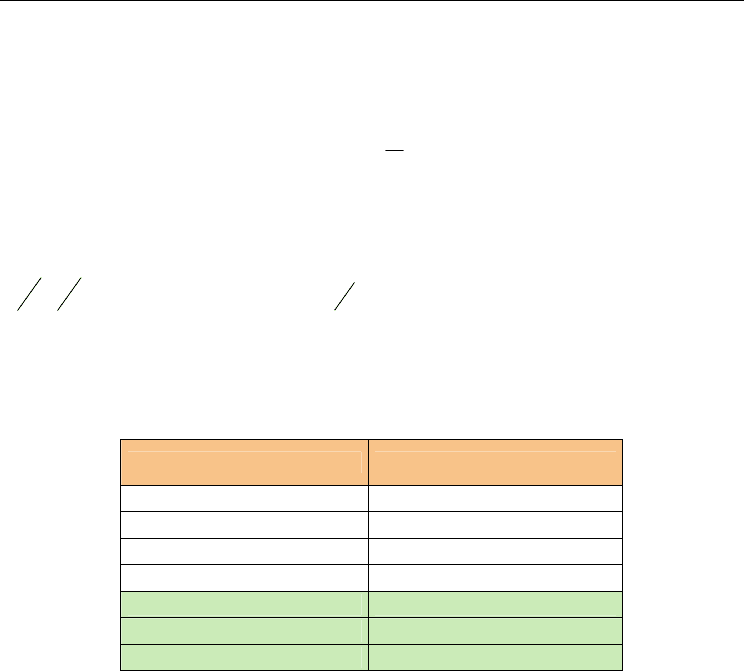
The motor nameplate is shown as follows:
Induction motor Value
Rated power
1.1kW. :Y 400/ D 230V
2.6/4.5A
Number of poles 4
Nominal speed 1410 rev/min
Cos ϕ
0.81
Table I. Specifications for an induction motor
The current has been measured by an A622 Tektronix 100 Ampere AC/DC current probe.
The current ranges are 0/100 mV/A, and the typical DC accuracy is ±3% ± 50 mA at 100
mV/A (50 mA to a 10 A peak). The frequency range extends from DC to 100 kHz (-3 dB).
The test rig and the data processing are displayed in Figure 9.

Discrete Wavelet Transforms - Theory and Applications
54
Wavelet Details
Load Torque
Control
Fig. 9. Experimental setup
Load control has been implemented by using a PMSM and an inverter where variable load
torque was introduced. The variable load torque follows an implemented increasing ramp
as a torque control reference. Figure 10 depicts the evolution of the acquired currents.
12 12.5 13 13.5 14 14.5 15
-5
-4
-3
-2
-1
0
1
2
3
4
5
Ia
Time
(
s
)
Amplitude (A)
Fig. 10. Current supply to the motor
3.2 Signal acquisition requirements
When carrying out experimental analyses one of the key elements to obtain good results is
to choose appropriate acquisition parameters: sampling frequency and number of samples.
There are three different constraints: analysis signal bandwidth, frequency resolution for the
FFT analysis and wavelet decomposition spectral bands.
For an IM, the most significant information about the stator current signal is focused around
the 0-400 Hz band (Devaney et al., 2004), (Benbouzid et al., 2000) & (Thomson et al., 2003). The
application of Nyquist’s theorem results in a minimum sampling frequency (fs) of 800 Hz.
Transient Analysis and Motor Fault Detection using the Wavelet Transform
55
Furthermore, in case of an FFT analysis, it is necessary to get the right resolution. As for the
inverter supply, several harmonics could be mixed up in case low resolution of the band
side was chosen. The minimum resolution needed in order to obtain good results is 0.5 Hz.
Equation (17) defines the number of samples to achieve the correct resolution required.
s
s
f
N
R
=
(17)
N
s
is the number of samples needed and R is the resolution.
On the other hand, wavelet analysis will show different frequency bands, centered at different
frequencies. Frequency bands will depend on the sampling frequency, and will decrease as
shown in Figure 4. The band covered by the wavelet decomposition will start with
,
42
s
ff
⎡⎤
⎢⎥
⎣⎦
and will then decrease as of
1
2
. The band suitable for analysis is about 40 Hz
(Tahori et al., 2007), needs to be covered by one detail, and depends on the sampling
frequency.
Finally, a sample frequency fs = 6 kHz was chosen and 50,000 samples were obtained. The
full analysis band ranges from 0 to 3 kHz with a resolution of 0.12 Hz for the FFT analysis.
The frequency bands of the wavelet decomposition are shown in Table II.
Decomposition details Frequency bands (Hz)
Detail at level 1 3000-1500
Detail at level 2 1500-750
Detail at level 3 750-375
Detail at level 4 375-187.5
Detail at level 5 187.5-92.75
Detail at level 6 92.75-46.37
Detail at level 7 46.37-23.18
Table II. Wavelet decomposition frequency bands for our test
3.3 Experimental results
This section presents the experimental results. To clearly demonstrate the effectiveness of
the method, different test have been performed. Firstly, tests were done in order to verify
the state of the faulty motor at nominal torque on stationary state. These allow us to check
MCSA harmonics resulting from the fault condition and their amplitude. The results show
us that the performance of the DWT is far superior to the FFT. Finally, PSD calculations over
the wavelet details are used to define a fault factor.
After an FFT analysis, the current spectra for a faulty motor operating under constant and
nominal load torque and a frequency supply of 50 Hz show a mark with an amplitude of
0.15 A (Figure 1) caused by a fault in the motor’s rotor bars.
Equation (2) determines the frequency where the fault harmonics are located. The
frequency of the fault harmonic depends on the slip, and the slip, in turn, depends on the
load torque. This means that a variable load torque condition results in a time-dependent
slip value, which causes variations in the spectrum. The measured speed values have a
slip between 5 and 10%. Frequency locations for the fault harmonic are depicted in
equations (18) and (19).

Discrete Wavelet Transforms - Theory and Applications
56
(
)
fault s s
ff
1 2 50(1 2 0.05) 45Hz=−=−⋅ = (18)
(
)
fault s s
ff
12 50(120.1)40Hz=−=−⋅= (19)
Figure 11 corresponds to experimental harmonic distribution for a faulty motor working
under variable load torque. An FFT analysis shows the spread of the power of a fault
harmonic along the spectrum and the decrease of its amplitude. The wavelet analysis shows
the temporary changes in the fault frequency band, and achieves great results under these
particular conditions.
Fig. 11. Spectrum under variable load conditions
The harmonic amplitude found due to the fault (2.5 mA) is too low to use standard FFT. The
wavelet transform will be used in order to find the correct amplitude.
The CWT scalogram is shown in Figure 12. It clearly shows the fault evolution on the
increased value from 30 to 50 coefficients
Fig. 12. Coefficient scalogram for the continuous wavelet transform
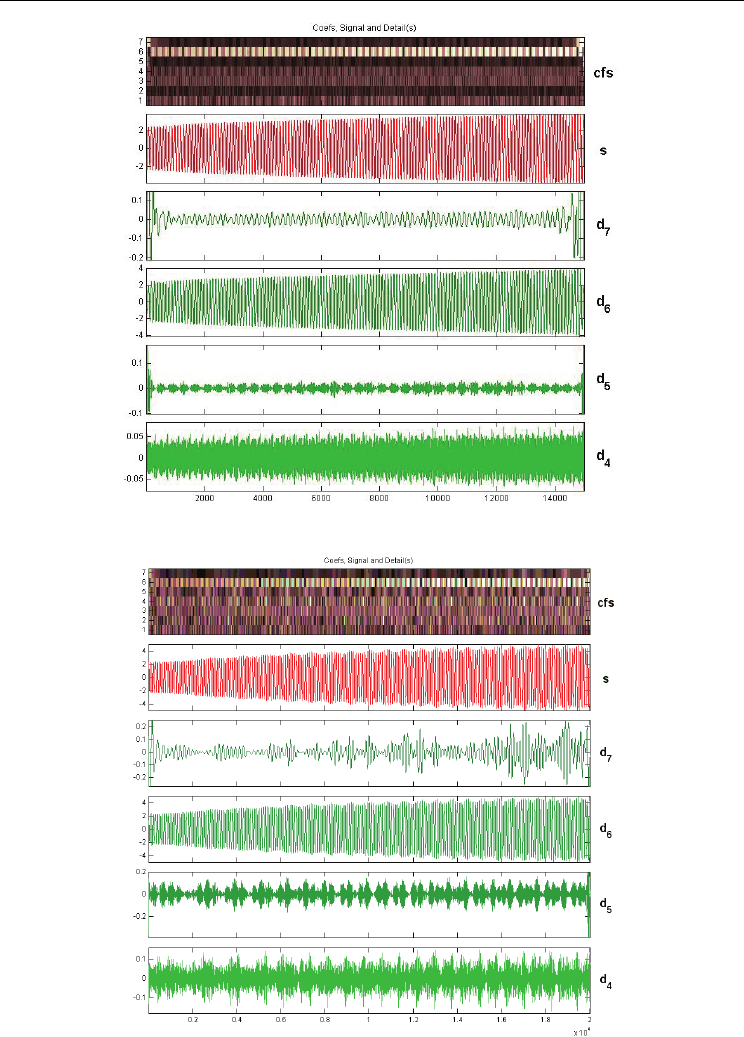
Figures 13 and 14 show the details of the wavelet decomposition for healthy and faulty
motors when computing the transform with a Daubechies 23 mother wavelet. Daubechies 23
ensures correct signal decomposition, isolating the fault harmonic content, which gives
proper results for our diagnostic purposes.
Transient Analysis and Motor Fault Detection using the Wavelet Transform
57
Fig. 13. DWT decomposition of a healthy motor
Fig. 14. DWT decomposition of a faulty motor

Discrete Wavelet Transforms - Theory and Applications
58
Detail levels of high frequency bands provide virtually no information about the original
signal. Detail 6 corresponds to the frequency band of the main harmonic and detail 7
corresponds to the frequency band where the fault harmonic is located in the test.
Comparing Figure 13 to Figure 14, we can clearly see the increase of the coefficient values as
a result of the fault condition on the depicted scalograms (cfs). Also, the increase of the
signal content is clearly appreciated on details 4, 5 and 7.
Promising results are also obtained using wavelet transforms and evaluating the proper
signal evolution during acquisition time. Figure 14 shows the advantage of the use of
wavelets under variable load torque. Comparing the FFT decomposition and the DWT
proves how using the Fourier decomposition (Figure 11) will reveal low amplitude for the
spectrum in the 40 Hz band, lower than 3 mA. However, analyzing the wavelet time-
amplitude decomposition (Figure 14) will show that the amplitude value follows the change
of the amplitude in the fault harmonic over time, eventually achieving a value higher than
0.15 A when maximum torque is applied. The maximum torque value is the same that was
applied to the constant torque test. The result of the analysis using the wavelet
decomposition under a variable load torque matches the results obtained using an FFT
analysis in the constant load torque test (Figure 1.)
To perform the diagnosis, we also need to determine the fault factor, which is defined as the
estimation of the energy content of any decomposed detail. Energy is estimated applying
equation (16).
Table III illustrates the energy increment for a fault condition of the approximation and
detail decompositions at level 7. This energy has been calculated according to equation (12).
Power [W]
D1 D2 D3 D5 D6 D7
Healthy motor
Phase A 0.00 0.00 0.11 9.9 929.2 35.75
Motor with broken rotor bars
Phase A 0.00 0.00 1.1 13 887.7 88.11
Table III. Power spectral density (power detail density)
Table III clearly illustrates the energy increment of the decompositions chosen. Both wavelet
decompositions shown in Table III can be used to detect rotor faults in the motor at any
point of operation. The fault condition can be clearly identified by analyzing the energy
content of faulty harmonics (PSD). A clear efficiency decrease of about 6% is appreciated on
the main supply harmonic and a clear increase due to the fault condition is appreciated on
the fault frequency bands. In D7, which is placed over the main fault harmonic, there is an
increase of 2.5 times the energy content.
This technique combines the time and frequency analysis of wavelet decompositions,
allowing for better fault factor estimation. Combining DWT and PSD allows for further
development of expert algorithms to implement an autonomous fault diagnosis system for
induction machines.
4. Conclusions
This chapter has introduced the problems of fault detection under a variable load torque.
The classical computation of MCSA using the FFT introduces average errors in the