Murray J. Clifford. Angiogenesis Protocols - Methods in Molecular Medicine, Vol. 46
Подождите немного. Документ загружается.

192 Burbridge and West
if rats of different ages (6 wk–6 mo) are compared. It should be borne in mind,
however, that response to stimulators and inhibitors of aortic rings from rats of
different ages will not necessarily be the same.
3.5.3. Interpretation of the Angiogenic Response
In view of the complexity of the vascular network observed in such a sys-
tem, it is important to be able to fully quantitate the many parameters of
microvessel outgrowth if a comprehensive description of the process and its
modification are required. Criteria should be defined to enable valid interpre-
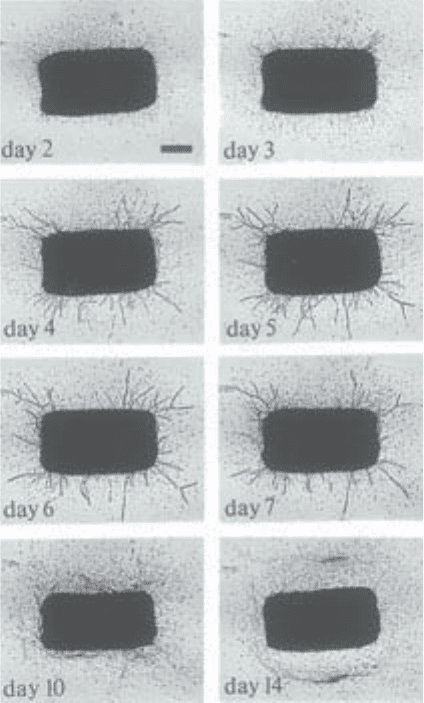
Fig. 4. The spontaneous angiogenic response of a rat aortic ring embedded in col-
lagen. Culture was maintained for 2 wk without medium change. See text for details.
Bar, 500 µm.
3D Model of Angiogenesis 193
tation of the angiogenic response and its modification by exogenous stimula-
tors and inhibitors.
The most obvious quantification would simply be a count of the number of
microvessels. However, this parameter may not necessarily be sufficient to
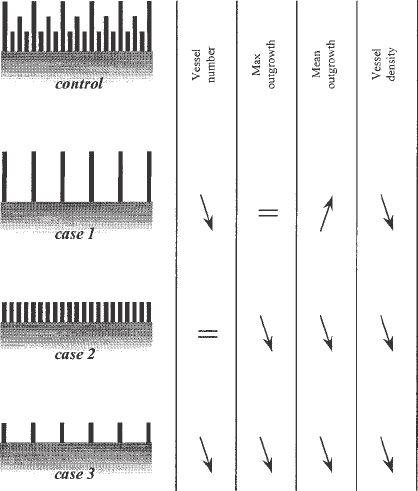
detect a variation in angiogenic response. In Fig. 5, the aortic ring is repre-
sented along with its vascular outgrowth and three possible cases of inhibition.
In case 1, there is an obvious reduction in number of vessels. However, in case
2, whilst inhibition is evident, a vessel count would lead to similar results as in
the control. In case 3, an accumulation of cases 1 and 2, vessel number is again
reduced. Another parameter would be a measure of distance of outgrowth of
the microvascular network - either that of maximum outgrowth, i.e. the dis-
tance migrated by the most distal vessel tip, or of mean outgrowth, taking into
account all vessel tips. Whilst in cases 2 and 3 both maximal and mean out-
growth obviously decrease, in case 1, maximal outgrowth is unchanged, and mean
outgrowth, due to the absence of intermediary length vessels, actually increases.
However, only a measure of vascular density (see Subheading 3.6.1.) would
Fig. 5. Three possible cases of angiogenesis inhibition. Top: graphical representa-
tion of an aortic ring and its endothelial outgrowth, and below: three possible cases of
inhibition (see Subheading 3.5.3.). The variations in four parameters of microvessel
outgrowth for each case are shown on the right.
194 Burbridge and West
give an indication of inhibition in all three cases. In other words, whilst in
case 3, all four parameters would indicate inhibition, in case 2 only outgrowth
(maximal or mean) and density are reduced, vessel number being unchanged,
and in case 1 only two parameters would indicate a reduction in the angiogenic
response. The measurement of the degree of angiogenic stimulation is simply
an inverse situation and a measure of vascular density would again be most
reliable. Other parameters, such as branching, individual vessel length, or total
vessel length could also be measured, and it is important to bear in mind all
these parameters and their possible modification when evaluating the angio-
genic response. Microvascular growth curves showing the evolution of the
spontaneous angiogenic response in terms of different parameters are presented
in Fig. 6.
Angiogenesis in this model closely approximates that observed in wound
healing, where a rapid growth rate of vessels and migration of fibroblasts is
followed by a slowing down in growth rate as microvessels mature and the
wound is healed. However, if we consider vessel growth in the case of patho-
logical situations such as tumor growth and diabetic retinopathy, a notion of
growth rate rather than of maximal density would be more applicable. It is thus
important to consider whether a measure of any of these parameters at any one
time point, or rather a comparison of kinetic profiles would be more relevant to
the subject of investigation. Microvascular growth curves for stimulation by
vascular endothelial growth factor are shown in Fig. 7. It is apparent that per-
centage stimulation calculated for this growth factor would depend both on the
parameter and on the day chosen for measurement.
3.6. Quantification—Image Analysis
Examine cultures under an inverted microscope with non-phase-contrast
optics. See Note 7. Transfer images to a monitor screen for image analysis.
3.6.1. Semiautomated Image Analysis
If a detailed analysis of microvascular outgrowth is required, an accurate
reproduction of the microvessel network is acquired manually before analysis
is performed. See Note 24.
1. Using suitable software, trace the outline of each vessel on the monitor screen.
2. Transfer the coordinates of these traced vessels to graphic software (such as
Excel, Microsoft) to reproduce the pattern of microvessel outgrowth in the form
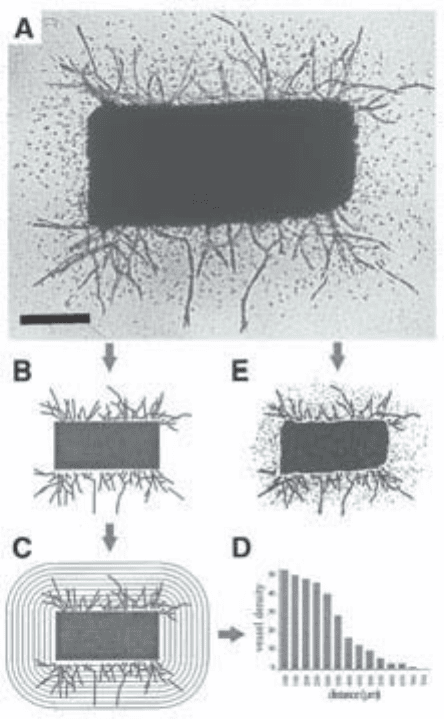
of a silhouette (Fig. 8A,B).
3. A number of parameters may be automatically measured, including vessel num-
ber, mean vessel length, maximum and mean distance of outgrowth, and number
of branchings.
3D Model of Angiogenesis 195
4. An imaginary grid placed over the microvessel network provides a histogram of
intersections at increasing distances from the ring, and can be considered to give
an ‘outgrowth profile’ for each culture (Fig. 8C,D).
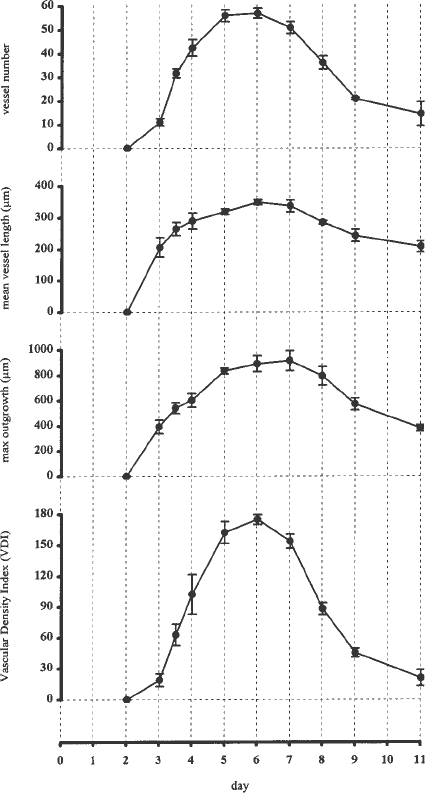
Fig. 6. Microvascular growth curves for serum-free culture of rat aorta in collagen
gel in terms of different parameters. Vessel growth is expressed in terms of vessel
number, mean vessel length, maximum distance of outgrowth, and the vascular den-
sity index (VDI; see Subheading 3.6.1.) as described in the text. Each point represents
the mean value of 4 explants for a representative experiment. Error bars indicate SEM.
196 Burbridge and West
5. The vascular density index, or VDI, is defined as the total number of vessel inter-
sections with a grid with lines at intervals of 100 µm (for greater precision, lines
at intervals of 50 µm are used and corresponding VDI is then calculated as half
the number of intersections).
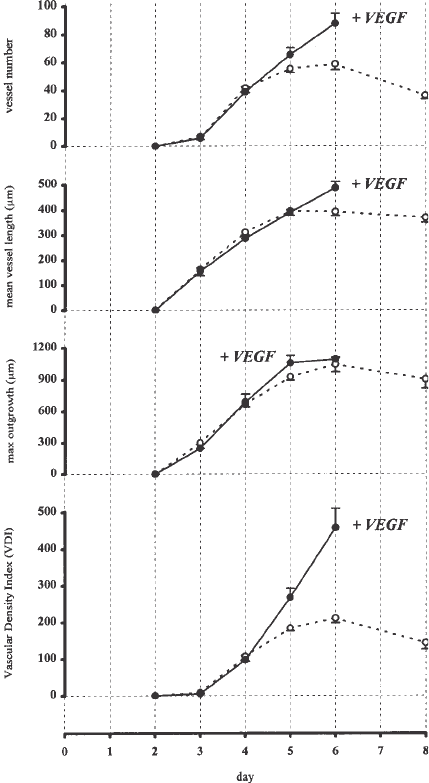
Fig. 7. Microvascular growth curves for serum-free culture of rat aorta in collagen
gel in the absence (- - - -) and presence (———) of 10 ng/mL vascular endothelial
growth factor. Vessel growth is expressed in terms of vessel number, mean vessel
length, maximum distance of outgrowth, and the vascular density index (VDI; see
Subheading 3.6.1.) as described in the text. Each point represents the mean value of
four explants for a representative experiment. Error bars indicate SEM.
3D Model of Angiogenesis 197
3.6.2. Automated Image Analysis
When using the model for high-throughput screening of angiogenic or
antiangiogenic molecules, a less precise analysis of cultures may be consid-
ered sufficient. Automated image analysis techniques may readily be used to
isolate the vessel patterns from the surrounding fibroblasts and to quantify
angiogenesis in terms of area occupied by these vessels and extent of outgrowth
(Fig. 8E). An approximation to the number and distance of migration of fibro-
blasts may also be obtained by such techniques (see Note 25).
Fig. 8. Angiogenesis quantification. (A) Photomicrograph of aortic ring d 6 (bar,
500 µm). (B,C,D) Semiautomated image analysis. (E) Automated image analysis. See
Subheading 3.6. for details.
198 Burbridge and West
3.7 Variations on the Standard Technique
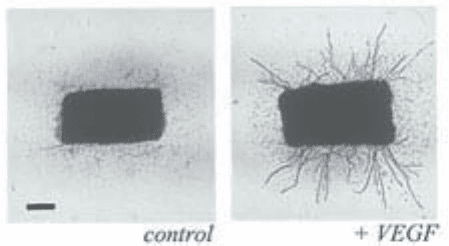
3.7.1. Repressed Cultures
The spontaneous outgrowth observed in the aortic cultures is stimulated by
the endogenous growth factors released by the aortic wall upon resection. When
cultured in basal media such as MEM, unsuited to serum-free growth of ECs,
this outgrowth is absent. Replacement of this medium on d 5 by MCDB131
leads to minimal outgrowth. However, the addition of certain growth factors to
these repressed cultures will cause marked stimulation, suggesting that cells
remain viable under such conditions and that the reduced outgrowth is due
rather to the removal of released endogenous growth factors along with the
MEM. This technique thus provides a means by which to investigate the intrin-
sic effect of growth factors, bearing in mind that growth factors may work in
synergy, and alone may lead to minimal response. Figure 9 shows stimulation
by vascular endothelial growth factor of such a repressed culture.
Multiwell Cultures
As described, this model is useful for the long-term maintenance and obser-
vation of aortic ring cultures. However, it may be necessary to adapt the model
to situations in which smaller volumes of media are required, as is the case
when using angiogenic stimulators or inhibitors the cost of which would pro-
hibit dilutions into vol of 30 mL.
Cultures may be carried out in 12- or 24- well culture plates with minor
modifications.
1. Embed the aortic segments in the collagen or fibrin gels, as outlined for standard
method.
2. Carefully remove the agarose rings from the gels with the bent spatula.
3. Transfer the collagen or fibrin gels, again with the bent spatula, to wells of cul-
ture plates filled with medium (e.g., 3 mL per well for a 12-well plate).
Outgrowth in these cultures is reduced as compared to cultures in 100-mm
Petri dishes, owing partially to an alteration in mechanical forces on the col-
lagen matrix (removal of the supporting agarose enables retraction of the col-
lagen gel), and possibly to a modification in the medium environment resulting
from the reduced culture volume (agarose-free cultures in Petri dishes lead to
outgrowth superior to that in 12-well plates). Angiogenesis in terms of VDI is
half-maximal by d 5 as opposed to d 4 for the standard petri dish culture. This
difference in outgrowth should be borne in mind when comparing results. The
action of stimulators and inhibitors of angiogenesis may conceivably be
altered to a certain degree by differences in growth kinetics, especially when
the stability of the added compound is limited. However, the results are of
3D Model of Angiogenesis 199
course no less valid than in Petri dish culture, and such multiwell culture is
useful for high throughput screening using automated image analysis. With
four rats, around 100 potential antiangiogenic compounds may be screened in
one such experiment (which should be repeated for confirmation).
If volumes of medium to be used are exceedingly small, it is possible to
culture directly in collagen or fibrin gels in 96-well plates (2 layers of 50 µL
per well). However, the small volume of medium is rapidly spent (the ratio
medium/gel is also very low), and outgrowth may be less satisfactory over
extended periods. For analysis, plates should be immersed in a medium bath to
enable observation of cultures without image interference due to meniscus
within each well.
3.8. Histological Examination
Although it is possible to fix and dehydrate cultures for paraffin embedding,
massive shrinkage of the gels during the various dehydration and embedding
steps leads to distorted arrangement of fibroblasts and ECs, rendering interpre-
tation and extrapolation to the 3D cultures difficult. Moreover, due to the high
content of water, frozen sections of gel are not feasible.
Specific whole cell or antigen marking using immunohistochemical or other
techniques may be performed on intact cultures. To enable rapid penetration
and washing out of antibodies and other markers, small fragments rather than
rings of rat aorta are embedded in thin films of gel.
3.8.1. Culture Wells
1. Culture wells are formed by the silicone gasket of 8-well Lab-Tek Permanox
Chamber Slides after removal of the upper chambers.
2. Attach each slide to the base of a Petri dish with a drop of cyanoacrylate gel.
3.8.2. Aortic Fragments
1. Prepare small fragments of 0.25–0.5 mm
2
, by first cutting each aorta in half
lengthways with a scalpel blade, then cutting each half into strips. Chop each
strip into small lengths to produce square fragments.
2. Wash as for rings, remove excess medium, and place in chamber slide wells
(5–10 fragments per well).
3. Carefully add 50 µL collagen or fibrin to each well without disturbing fragments
and place in a humidified incubator to gel before covering with medium
(Fig. 10A).
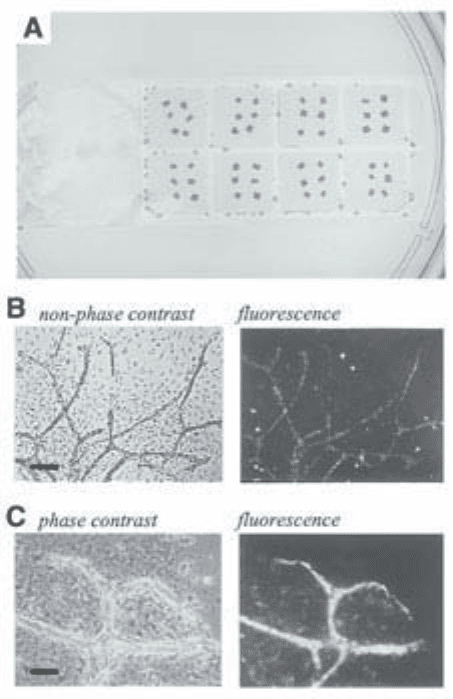
3.8.3. Fluorescent Staining of Viable ECs
ECs within these thin-film cultures may be stained based upon the selective
uptake of fluorescence-labeled low-density-lipoprotein (DiI-Ac-LDL).
200 Burbridge and West
1. Carefully remove aortic fragments.
2. Incubate living cultures 4 h with 10 µg/mL DiI-Ac-LDL, followed by 3 succes-
sive washings of 1 h each in fresh medium.
3. Examine under a fluorescence microscope, set up to view fluorescein labelling.
(Fig. 10B).
3.8.4. Antibody Labelling of Fixed Cultures
1. Carefully remove aortic fragments.
2. Fix in either 4% paraformaldehyde or ethanol.
3. Air dry the gels to leave preparations of a thickness of a few tens of micrometers,
to which may be applied standard immunohistological staining techniques. A
typical culture labelled for von Willebrand factor is shown in Fig. 10C.
4. Notes
1. Type VII is ideal for its melting and solidifying temperatures and rigidity.
2. Sterile type I collagen solutions may be prepared from rat tails, although this is a
tedious and time-consuming procedure, and may lead to large variations between
experiments when using different batches. Commercially prepared solutions of
rat-tail collagen in acetic acid are now readily available, and will generally lead
to more satisfactory and consistent results (e.g., ‘Collagen R,’ 2 mg/mL in 0.5 M
acetic acid, Serva). Other commercially available sources of collagen (e.g.,
bovine skin) have been found to give gels of a less rigid consistency. For rat-tail
collagen, a concentration of 1.5 mg/mL is optimal; lower concentrations lead to
excessively labile gels, whereas higher concentrations may lead to a reduction in
outgrowth from the aortic explants.
3. Fibrinogen and thrombin may be from a variety of origins; human or bovine
preparations give similar results and are relatively inexpensive.
4. The rat is the chosen species for these experiments because it provides rings of a
practical size, and because rings from mouse aortas have been found not to give
Fig. 9. Repressed cultures. Stimulation with 10 ng/mL vascular endothelial growth
factor (VEGF) (photo day 9, bar; 500 µm). See text for details.
3D Model of Angiogenesis 201
rise to satisfactory vessel outgrowth, possibly owing to a reduced local concen-
tration of growth factors.
5. MCDB131 is a culture medium optimized for the culture of microvascular ECs
and enables growth in serum-free conditions (see Knedler and Ham (9)). This
commercially available medium contains a concentration of 14 mM NaHCO
3
,
Fig. 10. Fluorescent staining of ECs. (A) Aortic fragments are cultured in wells
formed by the silicone gasket of Lab-Tek Chamber Slides. (B) Fluorescence-labeled
DiI-Ac-LDL uptake (bar, 200 µm). (C) Fluorescent marking for von Willebrand fac-
tor (bar, 100 µm). Cultures are fixed in ethanol 15 min at room temperature and
allowed to air dry. Nonspecific binding sites are blocked 30 min in 10% fetal calf
serum. Preparations are then incubated 2 h with 10 µg/mL polyclonal sheep antibody
to rat von Willebrand factor (Cedarlane), 1 h with biotin conjugated rabbit antisheep
IgG (Rockland) and 1 h with ExtrAvidin-R-phycoerythrin conjugate (Sigma).