Mellouk A., Chebira A. (eds.) Machine Learning
Подождите немного. Документ загружается.

Linear Subspace Learning for Facial Expression Analysis
273
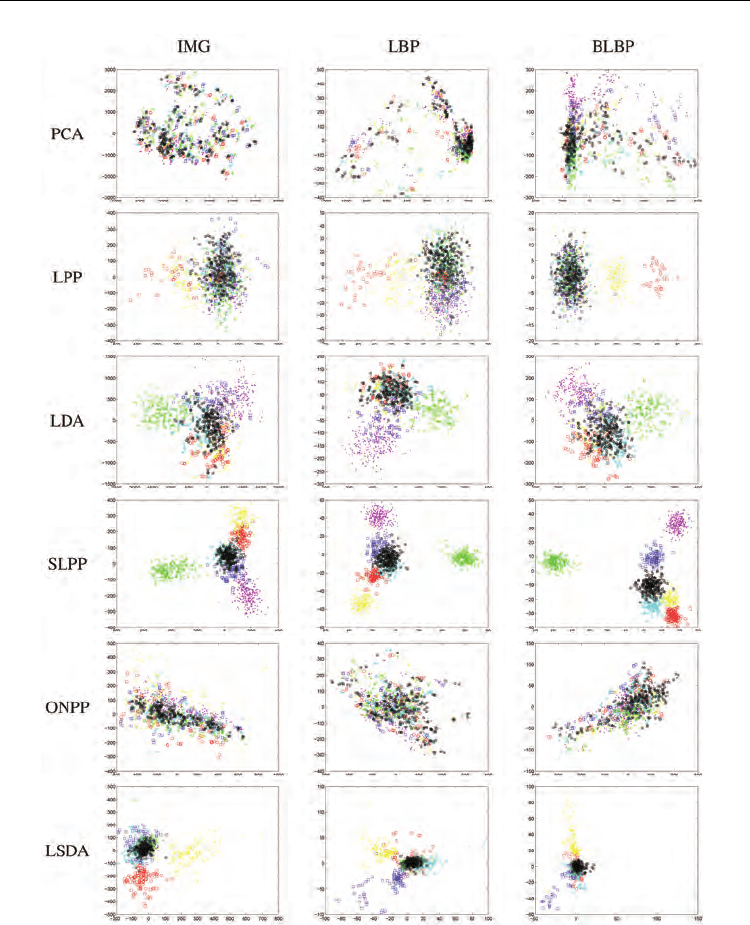
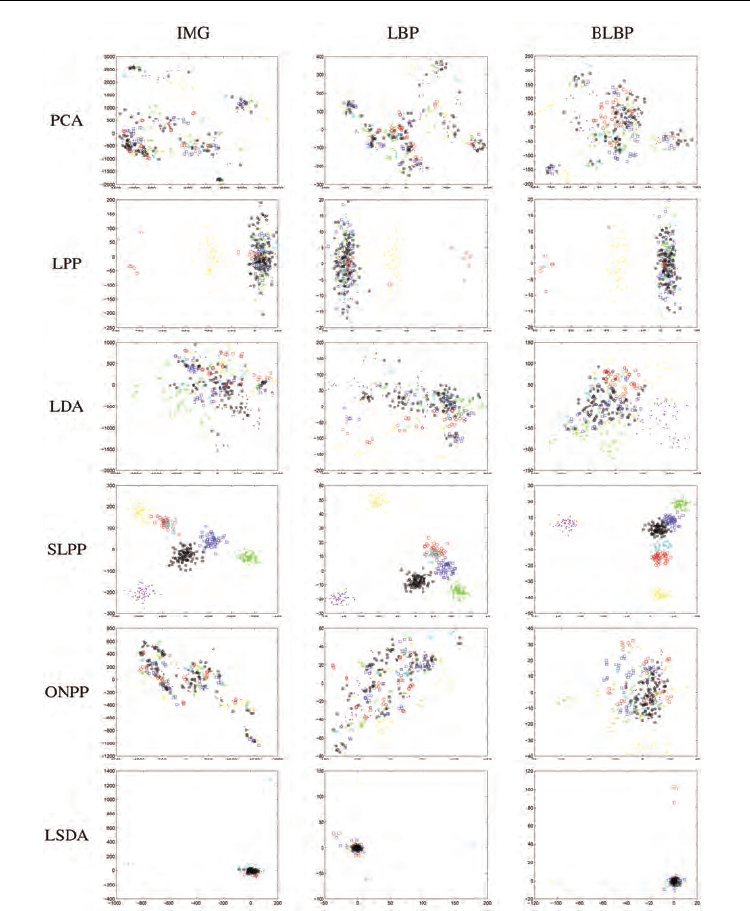
LPP to yield meaningful projections in the absence of class information. For supervised
methods, it is surprising to observe that different expressions are still heavily overlapped in
the 2D subspace derived by ONPP. In contrast, the supervised methods LDA, SLPP and
LSDA yield much meaningful projections since images of the same class are mapped close
to each other. SLPP provides evidently best projections since different classes are well
separated and the clusters appear cohesive. This is because SLPP preserves the locality and
class information simultaneously in the projections. On the other hand, LDA discovers only
the Euclidean structure therefore fails to capture accurately any underlying nonlinear
manifold that expression images lie on, resulting in its discriminating power being limited.
LSDA obtains better projections than LDA as the clusters of different expressions are more
cohesive. On comparing facial representation, BLBP provides evidently the best
performance with projected classes more cohesive and clearly separable in the SLPP
subspace, while IMG is worst.
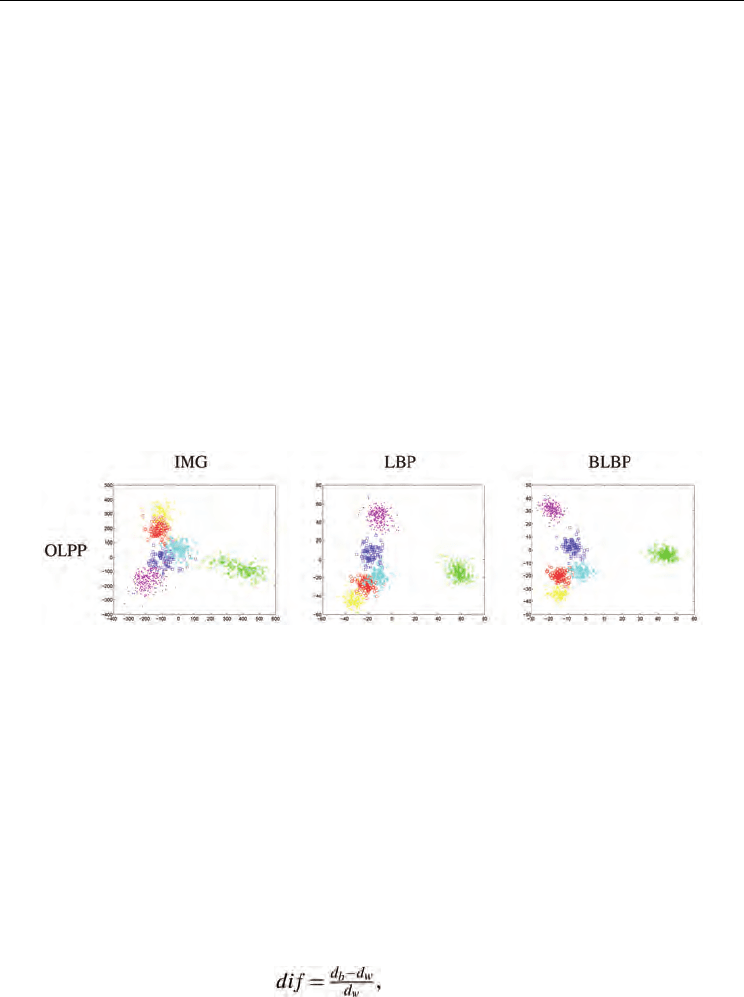
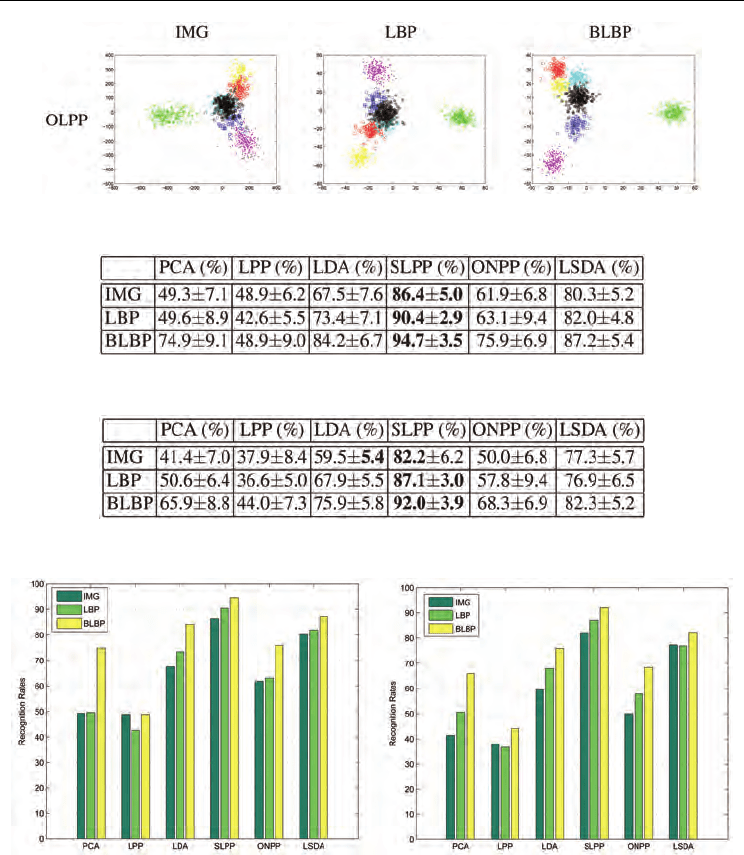
Fig. 7 shows the embedded OLPP subspace of data set S1.We can see that OLPP provides
much similar projections to SLPP. The results obtained by SLPP and OLPP reflect human
observation that Joy and Surprise can be clearly separated, but Anger, Disgust, Fear and
Sadness are easily confused. This reenforces the findings in other published work (Tian,
2004; Cohen et al, 2003a).
Fig. 7. (Best viewed in color) Images of data set S1 are mapped into 2D embedding spaces of
OLPP.
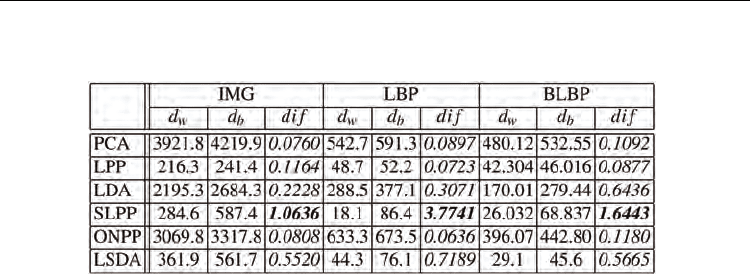
For a quantitative evaluation of the derived subspaces, following the methodology in (Li et
al, 2003), we investigate the histogram distribution of within-class pattern distance and
between-class pattern distance of different techniques. The former is the distance between
expression patterns of the same expression class, while the latter is the distance between
expression patterns belonging to different expression classes. Obviously, for a good
representation, the within-class distance distribution should be dense, close to the origin,
having a high peak value, and well-separated from the between-class distance
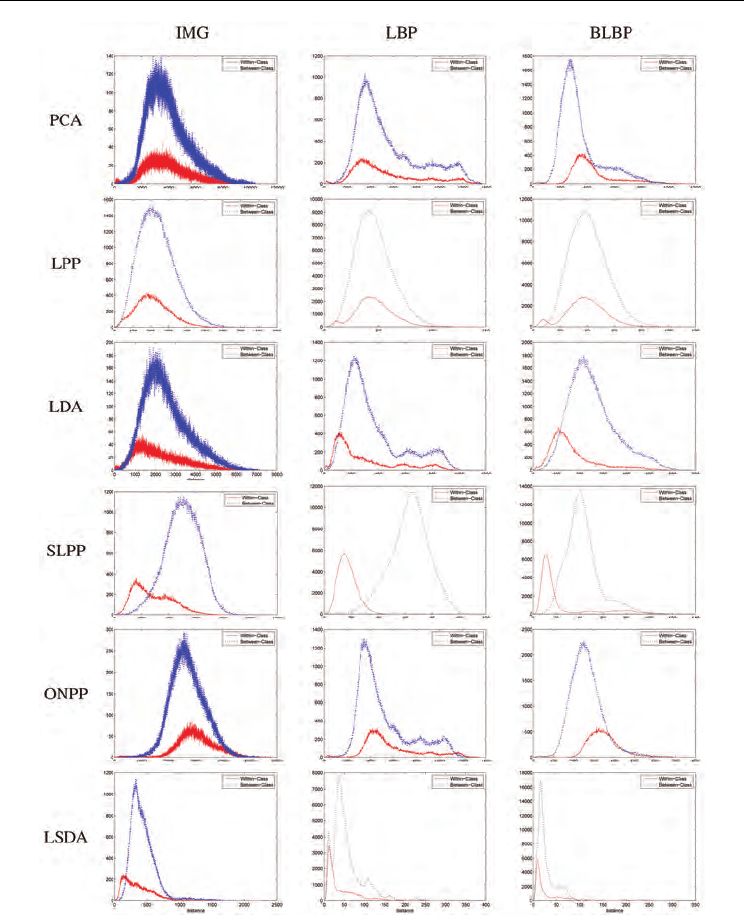
distribution.We plot in Fig. 8 the results of different methods on S1. It is observed that SLPP
consistently provides the best distributions for different facial representations, while those
of PCA, LPP, and ONPP are worst. The average within-class distance d
w
and between-class
distance d
b
are shown in Table 1. To ensure the distance measures from different methods
are comparable, we compute a normalized difference between the within- and between-
class distances of each method as
which can be regarded as a relative measure
on how widely the within-class patterns are separated from the between-class patterns. A
high value of this measure indicates success. It is evident in Table 1 that SLPP has the best
separating power whilst PCA, LPP and ONPP are the poorest. The separating power of
Machine Learning
274
LDA and LSDA is inferior to that of SLPP, but always outperform those of PCA, LPP, and
ONPP. Both Fig. 8 and Table 1 reinforce the observation in Fig. 6.
Table 1. The average within-class and between-class distance and their normalization
difference values on data set S1.
The 2D visualization of embedded subspaces of data set S2 with different subspace
techniques and facial representations is shown in Fig. 9. We observe similar results to those
obtained in 6-class problem. SLPP outperforms the other methods in derive the meaningful
projections. Different expressions are heavily overlapped in 2D subspaces generated by
PCA, LPP, and ONPP, and the discriminating power of LDA is also limited.We further
show in Fig. 10 the embedded OLPP subspace of data set S2, and also observe that OLPP
provides much similar projections to SLPP. Notice that in the SLPP and OLPP subspaces,
after including neutral faces, Anger, Disgust, Fear, Sadness, and Neutral are easily confused,
while Joy and Surprise still can be clearly separated.
4.2.2 Comparative evaluation on expression recognition
To further compare these methods, we also performed facial expression recognition in the
derived subspaces. We adopted the k nearest-neighbor classifier for its simplicity. The
Euclidean metric was used as the distance measure. The number of nearest neighbors was
set according to the size of the training set. To evaluate the algorithms’ generalization
ability, we adopted a 10-fold cross-validation test scheme.
That is, we divided the data set randomly into ten groups of roughly equal numbers of
subjects, from which the data from nine groups were used for training and the left group
was used for testing. The process was repeated ten times for each group in turn to be tested.
We reported the average recognition results (with the standard deviation) here.
The recognition performance of subspace learning techniques varies with the dimensionality
of subspace (note that the dimension of the reduced LDA subspace is at most c–1, where c is
the number of classes). Moreover, the graph-based techniques rely on the parameter k, the
number of nearest neighbors used when building the graph; how to set the parameter is still
an open problem. In our cross-validation experiments, we tested different combinations of
the parameter k with the subspace dimensionality, and the best performance obtained are
shown in Tables 2 and 3. It is observed that the supervised approaches perform robustly
better than the unsupervised methods. For unsupervised methods, PCA performs better
than LPP, with all three facial representations. For supervised methods, it is evident that
SLPP has a clear margin of superiority over LDA (12-38% better), ONPP (25-64% better), and
LSDA (6-13% better). Both LSDA and LDA perform better than ONPP, and LSDA
outperforms LDA. On comparing the standard deviation of 10-fold cross validation, SLPP
Linear Subspace Learning for Facial Expression Analysis
275
Fig. 8. (Best viewed in color) Histogram distribution of within-class pattern distance (solid
red lines) and between-class pattern distances (dotted blue line) on data set S1
always produces the smallest deviation (one exception with IMG on S2). This demonstrates
that SLPP is much more robust than other methods. The recognition results reinforce our
early observations shown in Fig. 6, Fig. 8 and Table 1. To clearly compare recognition rates
of different methods with different facial representations, we plot the bar graphes of
Machine Learning
276
Fig. 9. (Best viewed in color) Images of data set S2 are mapped into 2D embedding spaces.
Neutral expression is color coded as black.
recognition rates in Fig. 11. On comparing feature representations, it is clearly observed that
BLBP features perform consistently better than LBP and IMG features. LBP outperforms
IMG most of the time except with LPP, IMG has a slight advantage over LBP.
Linear Subspace Learning for Facial Expression Analysis
277
Fig. 10. (Best viewed in color) Images of data set S2 are mapped into 2D embedding spaces
of OLPP.
Table 2. Averaged recognition rates (with the standard deviation) of 6-class facial expression
recognition on data set S1.
Table 3. Averaged recognition rates (with the standard deviation) of 7-class facial expression
recognition on data set S2.
Fig. 11. Comparison of recognition rates using different subspace methods with different
features. Left: data set S1; Right: data set S2.
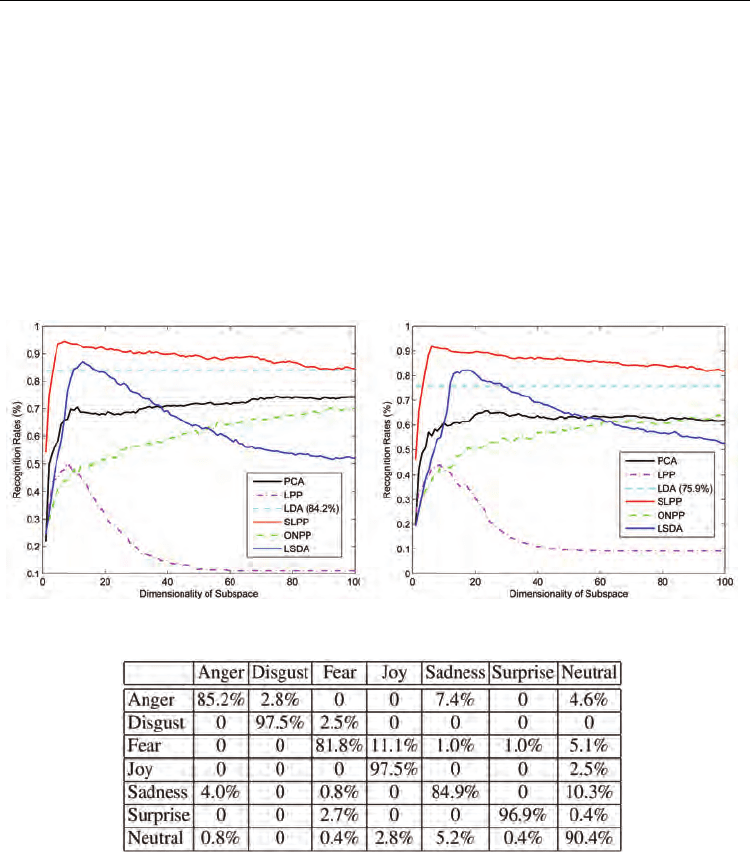
We show in Fig. 12 the averaged recognition rates versus dimensionality reduction by
different subspace schemes using BLBP features. As the dimension of the reduced subspace
of LDA is at most c–1, we plot only the best achieved recognition rate by LDA across the
various values of the dimension of subspace.We observe that SLPP outperforms other
methods. The performance difference between SLPP and LDA is conspicuous when the
dimension of subspace is small. But when the dimension increases, their performances
become rather similar. The performances of PCA, LPP, and ONPP is inferior to that of LDA
Machine Learning
278
consistently across all values of the subspace dimension. LSDA has similar trend with SLPP,
but much worse performance. The performance of PCA and ONPP eventually become
stable and similar when the dimension increase. On the other hand, the performance of LPP
degrades when the dimension increases, and is the worst overall.
The best result of 94.7% in 6-class facial expression recognition, achieved by BLBP based
SLPP, is to our best knowledge the best recognition rate reported so far on the database in
the published literature. Previously Tian (2004) achieved 94% performance using Neural
Networks with combined geometric features and Gaborwavelet features. With regard to 7-
class facial expression recognition, BLBP based SLPP achieves the best performance of
92.0%, which is also very encouraging given that previously published 7-class recognition
performance on this database were 81- 83% (Cohen et al, 2003a). The confusion matrix of 7-
class facial expression in data set S2 is shown in Table 4, which shows that most confusion
occurs between Anger, Fear, Sadness, and Neutral.
Fig. 12. (Best viewed in color) Averaged recognition accuracy versus dimensionality
reduction (with BLBP features). Left: data set S1; Right: data set S2.
Table 4. Confusion matrix of 7-class expression recognition on data set S2.
4.3 MMI database
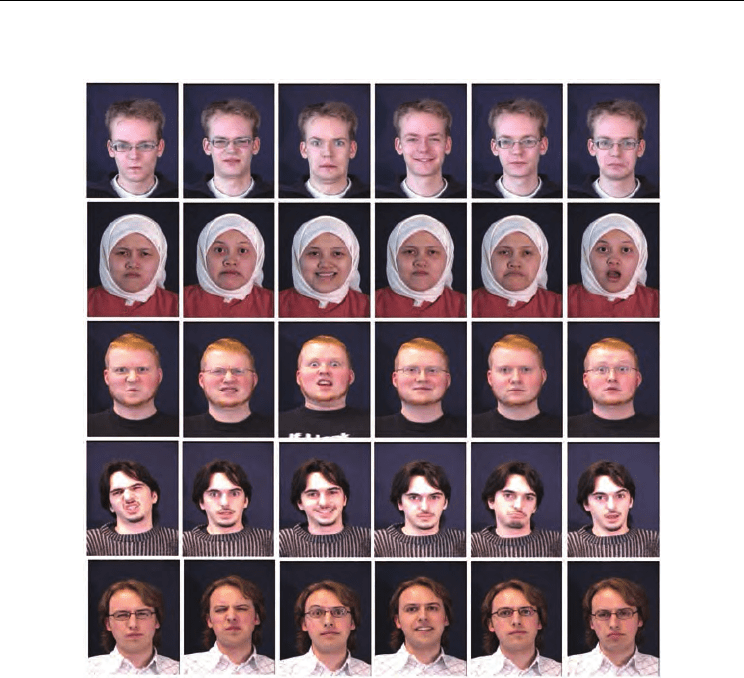
The MMI Database (Pantic et al, 2005) includes more than 20 subjects of both sexes (44%
female), ranging in age from 19 to 62, having either a European, Asian, or South American
ethnic background. Subjects were instructed to display 79 series of facial expressions that
included a single AU or a combination of AUs, or a prototypic emotion. Image sequences
have neutral faces at the beginning and at the end, and were digitized into 720×576 pixels.
Some sample images from the database are shown in Fig. 13. As can be seen, the subjects
Linear Subspace Learning for Facial Expression Analysis
279
displayed facial expressions with and without glasses, which make facial expression
analysis more difficult.
Fig. 13. The sample face expression images from the MMI Database.
In our experiments, 96 image sequences were selected from the MMI Database. The only
selection criterion is that a sequence can be labeled as one of the six basic emotions. The
sequences come from 20 subjects, with 1 to 6 emotions per subject.
The neutral face and three peak frames of each sequence (384 images in total) were used to
form data set S3 for 7-class expression analysis.
4.3.1 Comparative evaluation on subspace learning
The 2D visualization of embedded subspaces of data set S3 is shown in Fig. 14. We observe
similar results to those obtained in the Cohn-Kanade Database. SLPP consistently has the
best performance, and different facial expressions are well clustered and represented in the
derived 2D subspaces. In contrast, different expressions are heavily overlapped in 2D
subspaces generated by PCA, LPP, and ONPP. The LDA and LSDA projections can not
represent different facial expressions clearly, either. Notice also that in the SLPP subspaces,
Anger, Disgust, Fear, Sadness, and Neutral are easily confused, while Joy and Surprise can
be clearly separated.
Machine Learning
280
Fig. 14. (Best viewed in color) Images of data set S3 are mapped into 2D embedding spaces.
4.3.2 Comparative evaluation on expression recognition
We report the average recognition results in Table 5. We observe similar recognition results
to that in the Cohn-Kanade Database. With regard to unsupervised methods, PCA
outperforms LPP with all three facial representations. For supervised methods, it is seen that
Linear Subspace Learning for Facial Expression Analysis
281
SLPP has a clear margin of superiority over LDA (19-50% better), ONPP (28-52% better) and
LSDA (16-33% better). We further plot the bar graphes of recognition rates in the left side of
Fig. 15, which demonstrate that BLBP features perform better than LBP and IMG features
(except with LPP and LSDA), while LBP features have better or comparable performance
with IMG features.
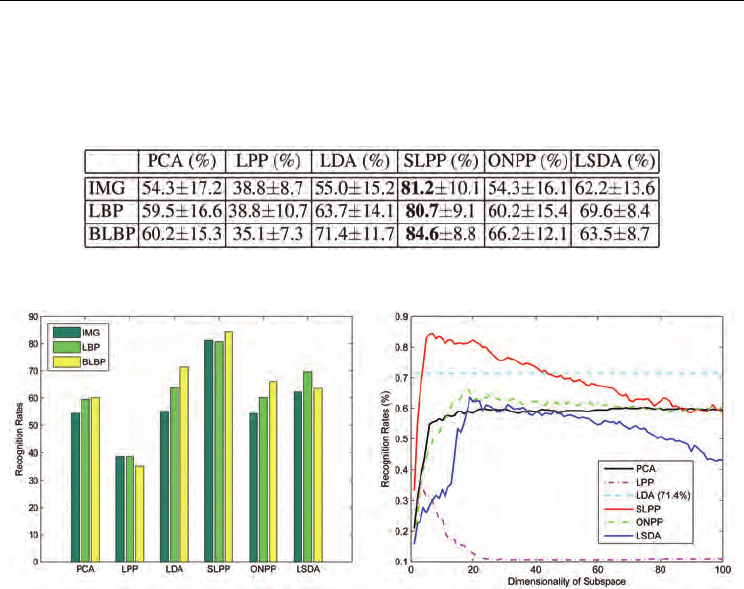
Table 5. Averaged recognition rates (with the standard deviation) of 7-class facial expression
recognition on data set S3.
Fig. 15. (Best viewed in color) (Left) Comparison of recognition rates on data set S3; (Right)
Averaged recognition accuracy versus dimensionality reduction (with BLBP features) on
data set S3.
We show in the right side of Fig. 15 the averaged recognition rates with respect to the
reduced dimension of different subspace techniques using BLBP features. We observe that
SLPP performs much better than LDA when the reduced dimension is small, but their
performance become similar, and SLPP is even inferior to LDA when the subspace
dimension increases. LSDA provides consistently worse performance than LDA. The
performances of PCA and ONPP are similar and stable consistently. In contrast, the
performance of LPP degrades when the dimension increases, and is the worst overall. The
plot in the right side of Fig. 15 is overall consistent with that of the Cohn-Kanade Database
shown in Fig. 12.
4.4 JAFFE database
The JAFFE Database (Lyons et al, 1999) consists of 213 images of Japanese female facial
expression. Ten expressers posed 3 or 4 examples for each of the seven basic expressions (six
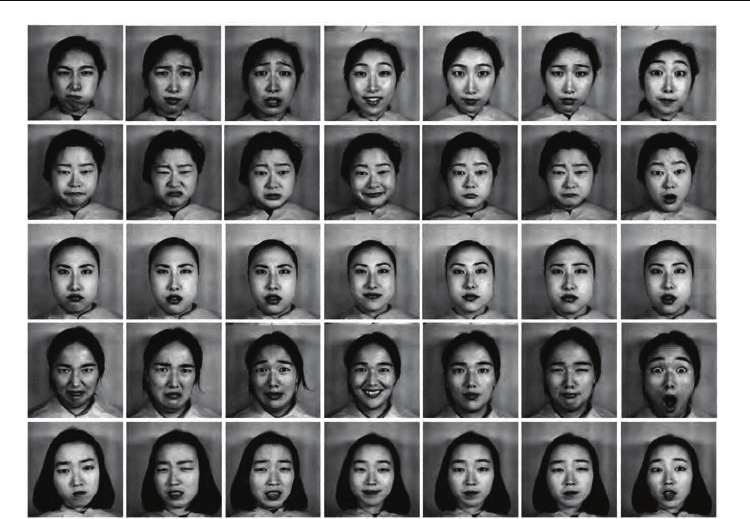
emotions plus neutral face). The image size is 256×256 pixels. Fig. 16 shows some sample
images from the database.
In our experiments, all 213 images of the JAFFE database were used to form data set S4 for
7-class facial expression analysis.
Machine Learning
282
Fig. 16. The sample face expression images from the JAFFE Database.
4.4.1 Comparative evaluation on subspace learning
The 2D visualization of embedded subspaces of data set S4 is shown in Fig. 17. Once again
we observe that SLPP provides the best projections, in which different facial expressions are
well separated. Similar to those in the Cohn-Kanade Database and the MMI Database, PCA,
LPP, and ONPP do not provide meaningful projections, as different expressions are heavily
overlapped in their 2D subspaces.
4.4.2 Comparative evaluation on expression recognition
The facial expression recognition results are reported in Table 6. We once again observe that
SLPP outperform other subspace techniques with a clear margin of superiority, e.g., 14-38%
better than LDA, 11-46% better than ONPP, and 22-38% better than LSDA. In this data set,
LDA and ONPP have parallel performance, and are all superior to PCA and LPP. LPP still
provides the worst results. The bar graphes of recognition rates is plotted in the left side of
Fig. 18, which once again demonstrate that BLBP features provide the best performance, and
LBP features perform better or comparably to IMG features.
Recognition performance on data set S4 is much poorer than that on data sets S1, S2, and
S3, and this is possibly because that there are fewer images in the data set resulting in a poor
sampling of the underlying latent space. The effect of the small training set size may be also
reflected on the standard deviation of 10-fold crossvalidation, as the standard deviations on
data set S4 are larger than those of data sets S1, S2, and S1, and the standard deviations of
S3 are larger than those of S1 and S2 as well. So the recognition performance of linear
subspace methods on the small training sets is not robust and reliable.