Mellouk A., Chebira A. (eds.) Machine Learning
Подождите немного. Документ загружается.

Forced Information for Information-Theoretic Competitive Learning
133
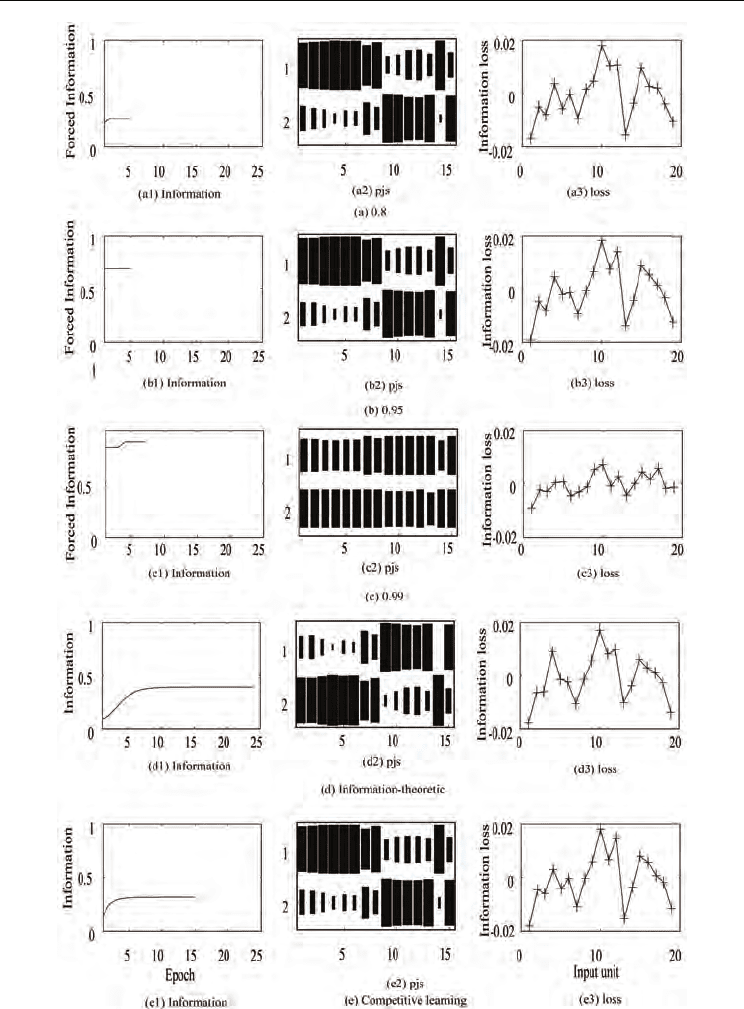
Fig. 5. Information, forced information, probabilities and information loss for the senate
problem.
Machine Learning
134
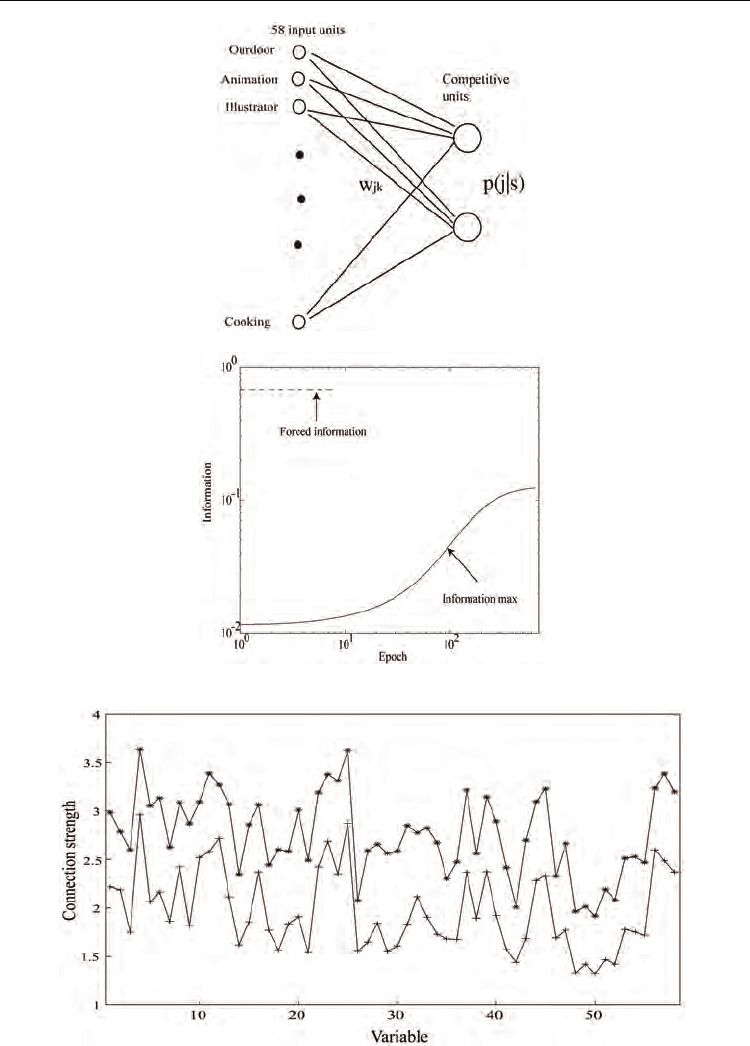
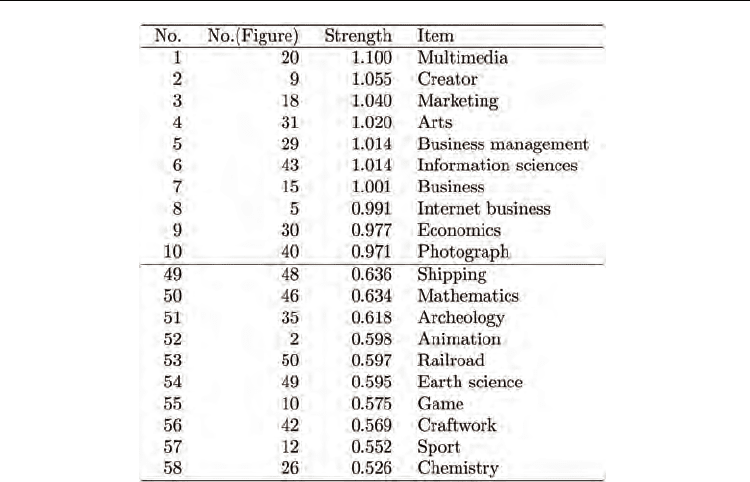
Fig. 6. Network architecture for a student analysis.
Fig. 7. Information and forced information as a function of the number of epochs by
information-theoretic and forced-information method.
Fig. 8. Connection weights for two groups analysis.
Forced Information for Information-Theoretic Competitive Learning
135
This means that the method can classify 580 students by the magnitude of connection
weights. Because connection weights try to imitate input patterns directly, we can see that
two competitive units show students with high interest and low interest in the items in the
questionnaire.
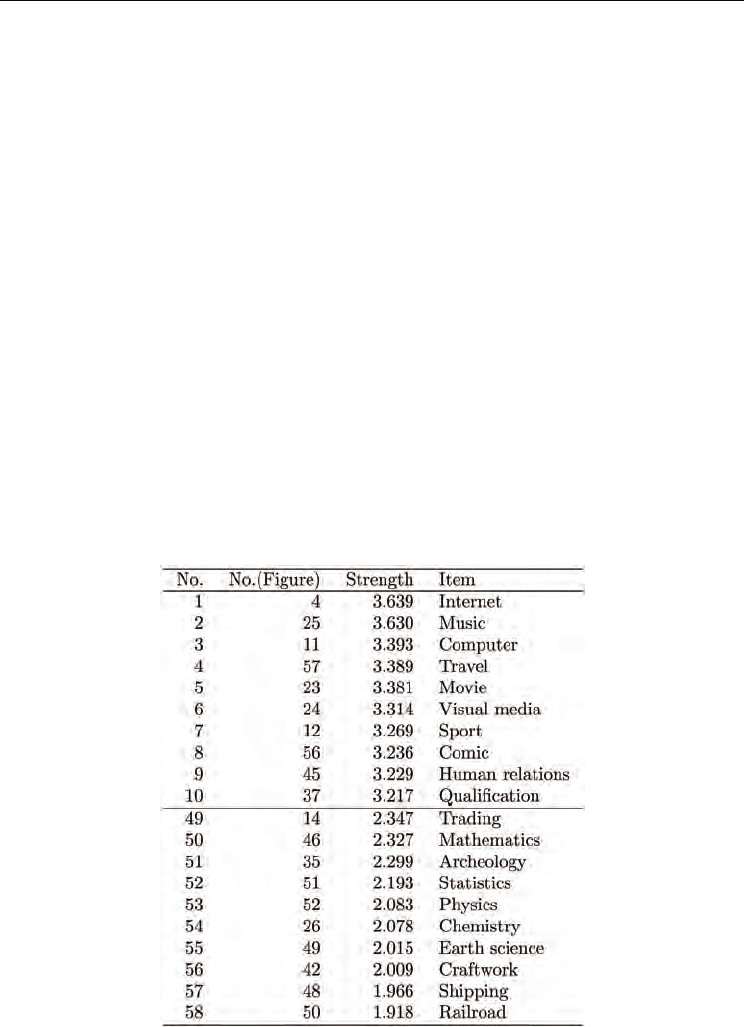
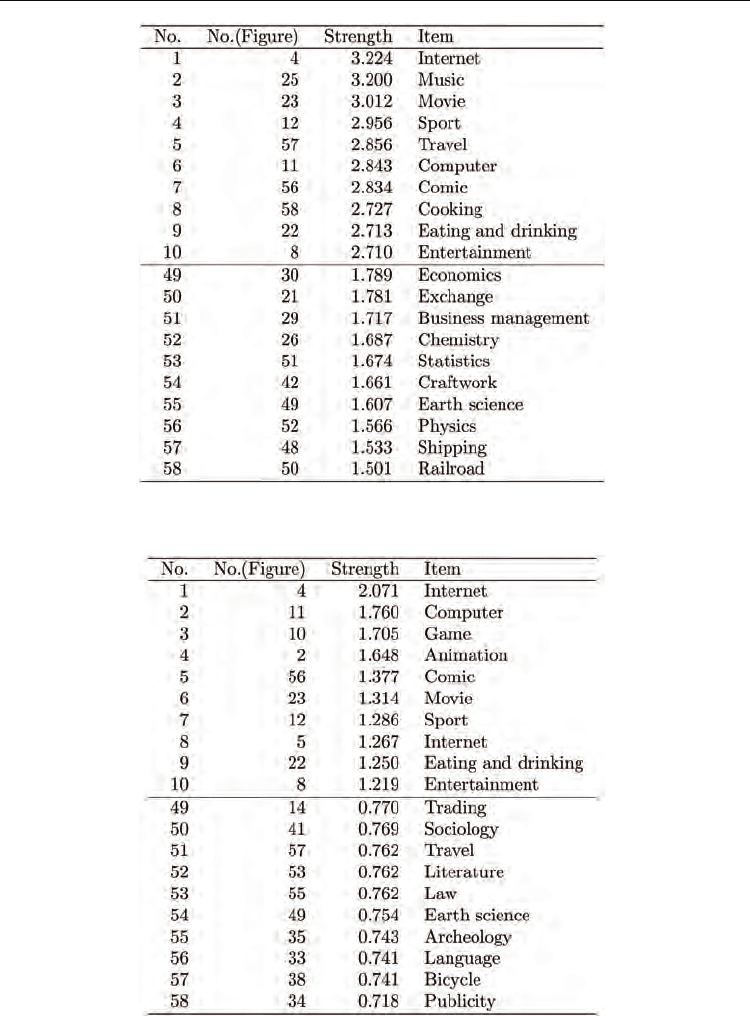
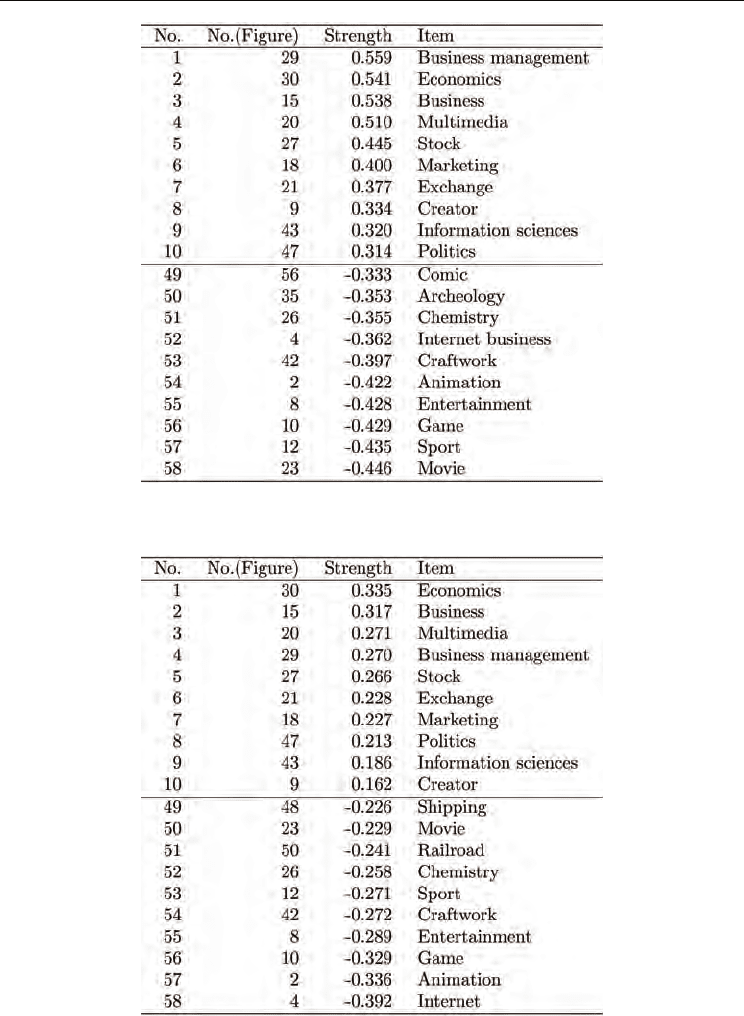
Table 2 represents the ranking of items for a group with a high interest in the items. As can
be seen in the table, students respond highly to internet and computer, because we did this
survey for the classes of information technology. Except these items, the majority is related
to the so-called entertainment such as music, travel, movie. In addition, these students have
some interest in human relations as well as qualification. On the other hand, these students
have little interest in traditional and academic sciences such as physics and mathematics.
Table 3 represents the ranking of items for a group with a low interest in the items. Except
the difference of the strength, this group is similar to the first group. That is, students in this
gropup respond highly to internet and computer, and they have keen interest in entertainment.
On the other hand, these students have little interest in traditional and academic sciences
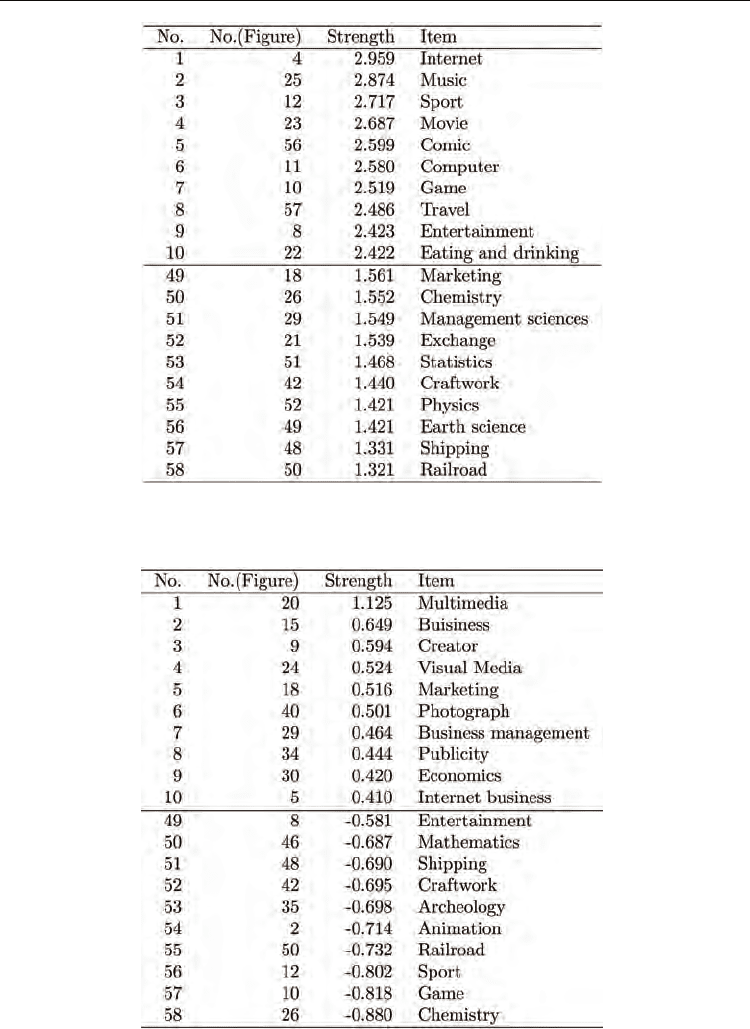
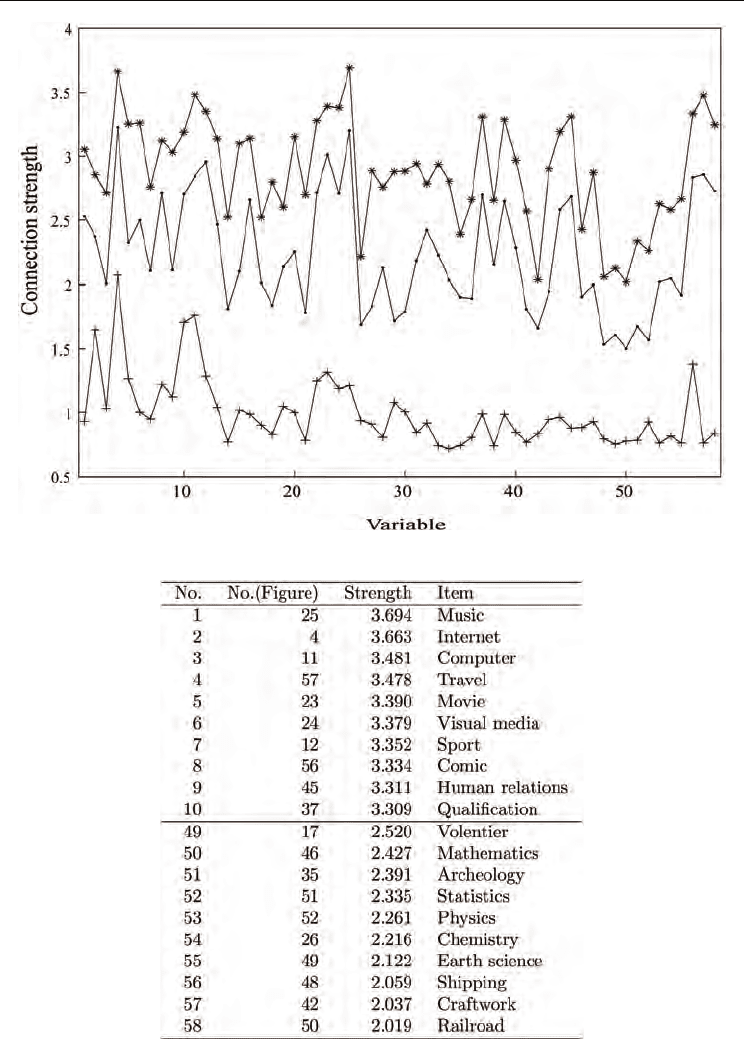
such as physics and mathematics. Table 4 shows the information loss for the two groups. As
can be seen in the table, two groups are separated by items such as multimedia, business.
Especially, many terms concerning business appear in the table. This means that two groups
are separated mainly based upon business. The most important thing to differentiate two
groups is whether students have some interest in buisiness or multimedia. Let us see what the
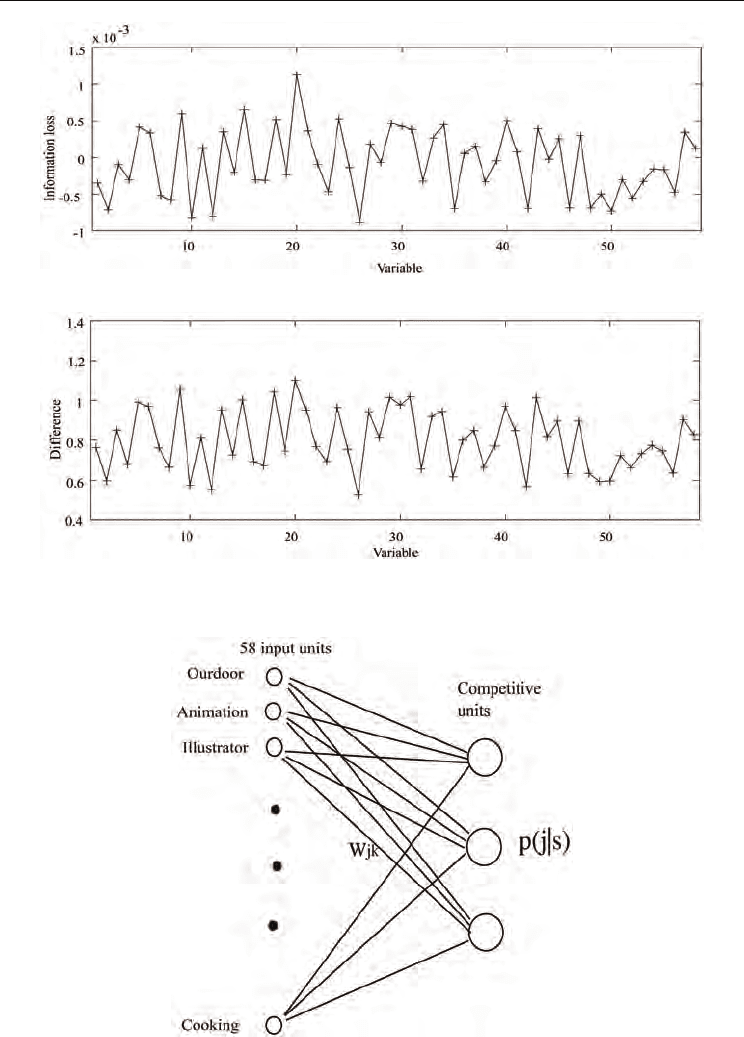
information loss represents in actual cases. Figure 9 shows the information loss (a) and
difference between two connection weights (b). As can be seen in the figure, two figures are
quite similar to each other. Only difference is the magnitude of two measures. Table 5 shows
the ranking of items by difference between two connection weights. As can be seen in the
table, the items in the list is quite similar to those in information loss. This means that the
information loss in this case is based upon difference between two connection weights.
Table 2. Ranking of items for a group of students who responded to items with a low level
of interest.
Machine Learning
136
Table 3. Ranking of items for a group of students who responded to items with a low level
of interest.
Table 4. Ranking of information loss for two groups analysis (×10
−3
).
Forced Information for Information-Theoretic Competitive Learning
137
(a) Information loss
(b) Difference between two connection weights
Fig. 9. Information loss (a) and difference between two connection weights (w2k −w1k) (b).
Fig. 10. Network architecture for three groups analysis.
Machine Learning
138
Table 5. Difference between two groups of students.
7.2 Three groups analysis
We increase the number of competitive units from two to three units as shown in Figure 10.
Figure 11 shows connection weights for three groups. The third group detected at this time
shows the lowest values of connection weights. The numbers of the first, the second and the
third groups are 216, 341 and 23. Thus, the third group represents only a fraction of the data.
Table 6 shows connection weights for students with strong interest in the items. Similar to a
case with two groups, we can see that students have much interest in entertainment. Table 7
shows connection weights with moderate interest in the items. In the list, qualification and
human relations disappear, and all the items expcet computer and internet are related to
entertainment. Table 8 shows connection weights for the third group with low interest in the
items. Though the scores are much lower than the other groups, this group also shows keen
interest in entertainment. Table 9 shows conditional information losses for the first
competitive unit. Table 10 shows information losses for the second competitive unit. Both
tables show the same patterns of items in which business-related terms such as economics,
stock show high values of information losses. Table 11shows a table of items for the third
competitive units. Though the strength of information losses is small, more practical items
such as cooking are detected.
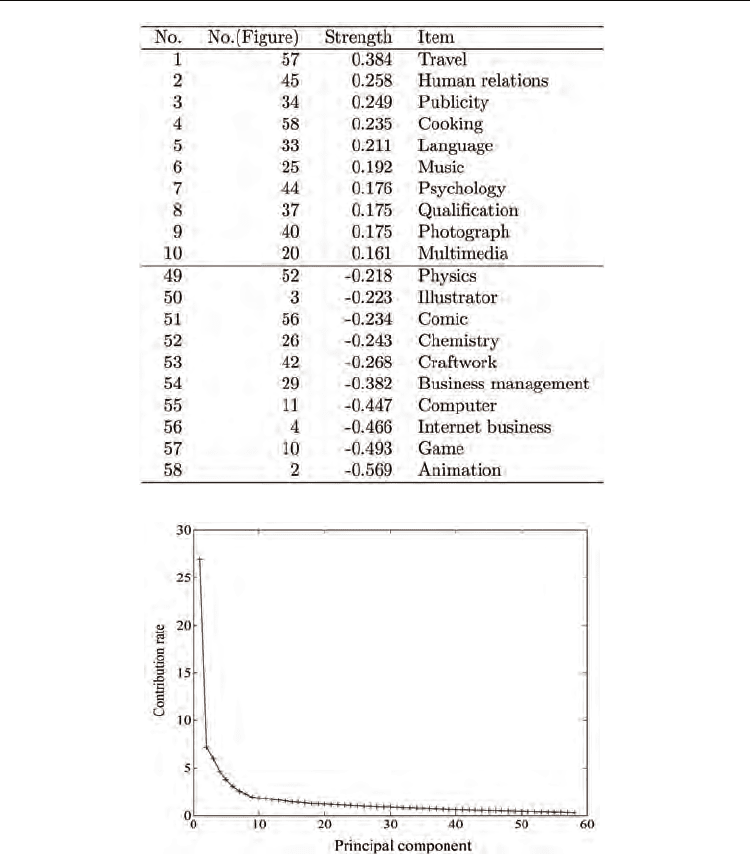
7.3 Results by the principal component analysis
Figure 12 shows the contribution rates of principal components. As can be seen in the figure,
the first principal component play a very important role in this case. Thus, we interpret the
first principal component. Table 12 shows the ranking of items for the first principal
component.
Forced Information for Information-Theoretic Competitive Learning
139
Fig. 11. Connection weights for three group analysis.
Table 6. Connection weights for students with strong interest in those items.
Machine Learning
140
Table 7. Connection weights for students with moderate interest in those items.
Table 8. Connection weights for students with low interest in those items.
Forced Information for Information-Theoretic Competitive Learning
141
Table 9. Information loss No.1(×10
−3
).
Table 10. Information loss No.2(×10
−3
).
Machine Learning
142
Table 11. Information loss No.3(×10
−3
).
Fig. 12. Contribution rates for 58 variables.
The ranking seems to be quite similar to that obtained by the information loss. This means that
the principal component seems to represent the main features by which different groups can
be separated. On the other hand, connection weights by forced information represent the
absolute magnitude of students’ interest in the subjects. In forced-information maximization,
we can see information loss as well as connection weights. The connection weights represent
the absolute value of the importance. On the other hand, the information loss represents
difference between several groups. This is a kind of relative importance of variables, because
the importance of a variable in one group is measured in a relation to the other group.