Marulanda J.M. (ed.) Electronic Properties of Carbon Nanotubes
Подождите немного. Документ загружается.

Exciton Dephasing in a Single Carbon Nanotube Studied by Photoluminescence Spectroscopy
355
occurs due to the violation of the excited state such as molecular collisions and so on. In the
solid systems, the thermal vibration of lattice, i.e. phonon perturbs the electronic states,
leading to the phase relaxation of excited states (dephasing). In contrast, the energy
relaxation occurs radiative and nonradiative transition from the excited states to the ground
state. The linewidth of the optical spectra, homogeneous broadening Γ, can be described as,
12
(1 / 2 / ), TT (1)
where (/2) h
is a Plank constant. Using this relationship, the information on the
dephasing time can be obtained from homogeneous broadening of the optical spectra. Also,
in the time-domain measurement, the dephasing time can be measured by using nonlinear
optical spectroscopy such as photon echo (or four-wave mixing) experiments (Graham et al.,
2011).
3. Experimental technique of single carbon nanotube imaging and
spectroscopy
The samples used for single SWNT spectroscopy were isolated SWNTs synthesized on
patterned Si substrates by an alcohol catalytic chemical vapor deposition method
(Maruyama et al., 2002). The Si substrates were patterned with parallel grooves typically
from 300 nm to a few µm in width and 500 nm in depth using an electron-beam lithography
technique. The isolated SWNTs grow from one side toward the opposite side of the groove.
We prepared several SWNT samples by changing the growth temperature (650-850 ºC) and
time (30 sec-10 min). The average number density of isolated SWNTs in the sample is 0.1-
1/μm
2
(Inoue et al., 2006, Matsuda et al., 2008, & Matsunaga et al., 2008).
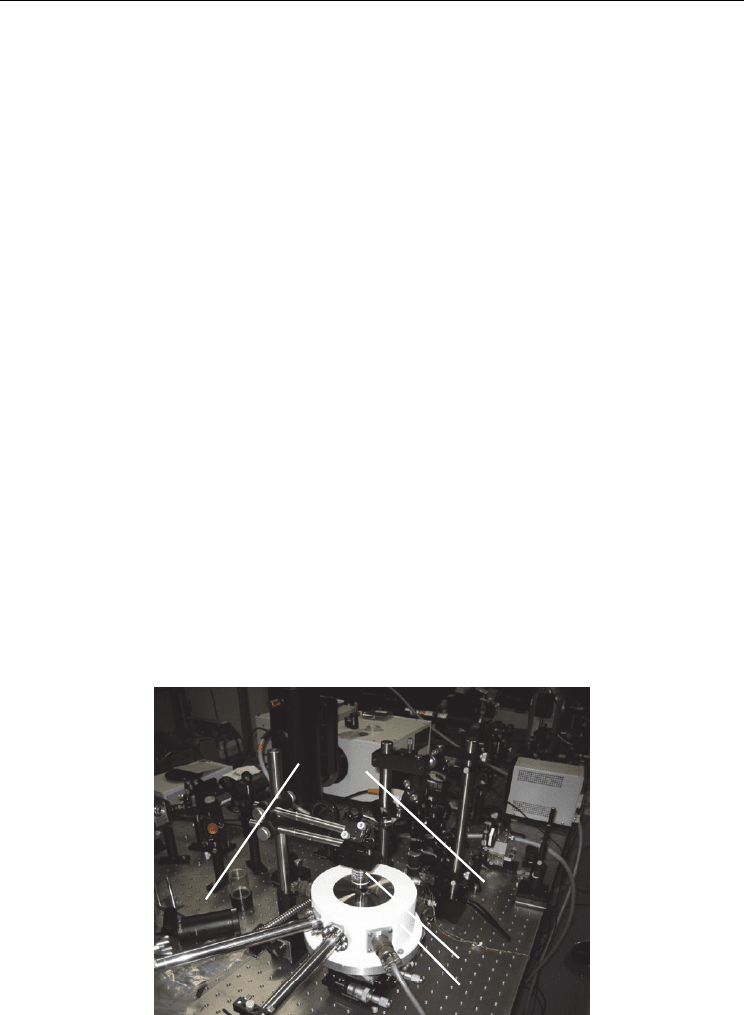
Single SWNT PL measurements were carried out from 300 (room temperature) to 5 K using
a home-built variable temperature confocal microscope setup as shown in Fig. 2. The SWNT
samples mounted on a stage were excited with a continuous-wave He-Ne laser (1.959 eV)
and femtosecond pulsed Ti:Al
2
O
3
Laser, and the laser beam was focused on the sample
Cryostat
Spectrometer
Objective
Detector
Fig. 2. Picture of experimental setup of low temperature optical microscope for a single
SWNT spectroscopy.
Electronic Properties of Carbon Nanotubes
356
surface through a microscope objective (NA 0.8). The PL signal from SWNTs was spectrally
dispersed by a 30-cm spectrometer equipped with a liquid-nitrogen (LN
2
)-cooled InGaAs
photodiode array (spectral range: 0.78-1.38 eV) or a LN
2
-cooled charge coupled device
(spectral range: ≥1.20 eV). The spectral resolution of our system is typically less than 0.7
meV. The detector accumulation time was typically between 30 sec and 1 min. We also
obtained PL images of the luminescent SWNTs on the sample, using a Si avalanche
photodiode or electron multiple (EM) CCD camera.
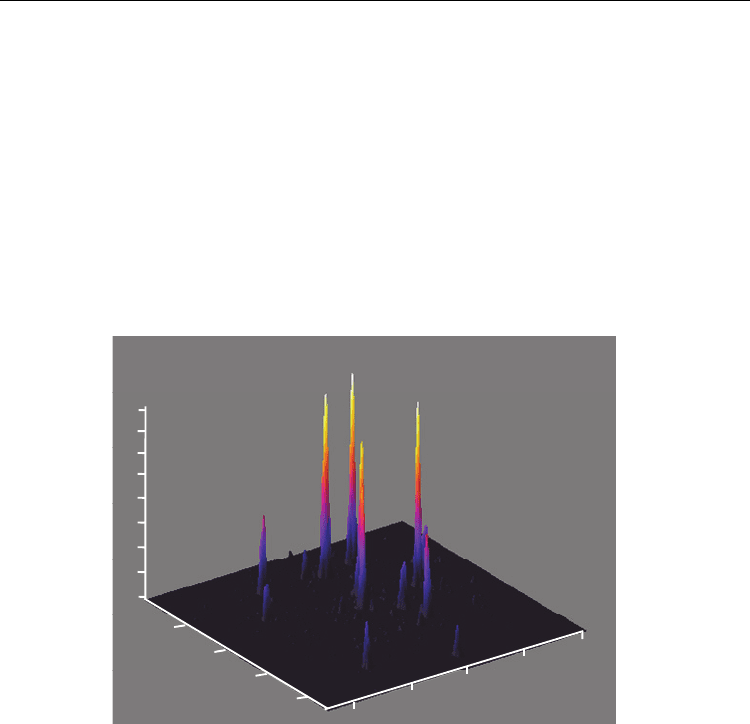
Figure 3 shows a typical PL image of isolated semiconducting SWNTs at room temperature.
The monitored PL energy range is typically between 1.18 and 1.37 eV. Several spatially
isolated bright spots can be seen in the 3D image. Each bright spot represents the PL signal
from a single luminescent SWNT because the PL spectrum obtained just on each bright spot
has only a single PL peak, as shown later. The spot size estimated from the spatial profiles of
the PL intensity is about 500 nm.
I[a.u.]
[m]
20
40
10
30
[m]
10
30
40
20
0
0
Fig. 3. 3D plots of PL image of single SWNT at room temperature.
3.1 Single carbon nanotube spectra
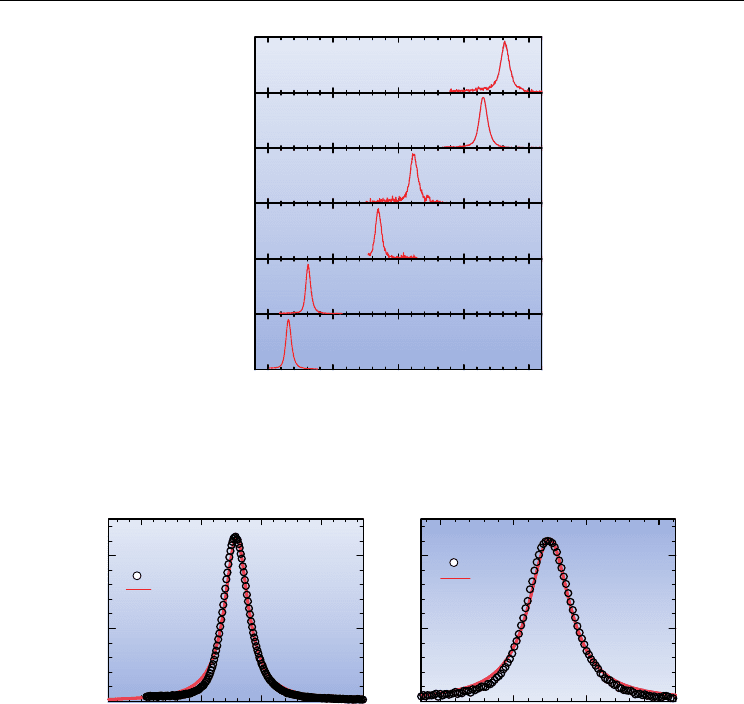
We obtained PL spectra from about 180 different isolated SWNTs with a variety of chiral
indices as shown in Fig. 4. The chiral index assignment for each PL spectrum is based on the
previous data of the emission energies (Lefebvre, Fraser, et al., 2004). There is a distribution
of emission energy (~ten meV) even within the same chiral index. Only a single sharp peak
can be seen in each spectrum. This is certain evidence that the PL comes from a single
SWNT. In addition, the PL linewidth tends to become broader with an increase of the PL
peak energy. Figures 5(a) and (b) show, in more details, the typical PL spectra of single
isolated SWNTs with relatively small and large diameter [(a): (10, 6), d = 0.83 nm, (b): (7, 5),
d = 1.11 nm,] in the sample.
The red solid lines in Figs. 5(a) and (b) represent single Lorentzian functions and
approximately reproduce the experimentally obtained PL spectra. In addition, it is found
Exciton Dephasing in a Single Carbon Nanotube Studied by Photoluminescence Spectroscopy
357
(6,5)
PL Intensity (arb. units)
RT
(7,5)
(7,6)
(11,3)
0.9 1.0 1.1 1.2 1.3
(10,6)
Photon Energy (eV)
(9,7)
Fig. 4. PL spectra of single SWNT with different chiral index (n, m) (Reprinted with
permission from [Inoue et al, 2006]. Copyright, American Physical Society).
1.20 1.22 1.24 1.26
(7,5)
PL Intensity (arb. units)
Photon Energy (eV)
exp.
Lorentzian
0.90 0.92 0.94 0.96
(10,6)
Photon Energy (eV)
PL Intensity (arb. units)
exp.
Lorentzian
Fig. 5. (a), and (b) PL spectra of single SWNT with chiral index of (10, 6) and (7, 5) at room
temperature (Reprinted with permission from [Inoue et al, 2006]. Copyright, American
Physical Society).
that the Stokes shift of SWNTs was very small (less than 5 meV) for each nanotube species
by comparison between absorption and PL spectra of ensemble SWNTs in gelatin matrices.
These facts show that the observed PL peaks correspond to the zero-phonon lines of free
excitons and the spectral linewidth of the PL spectra is determined by the homogeneous
broadening.
3.2 Dephasing mechanism of exciton state
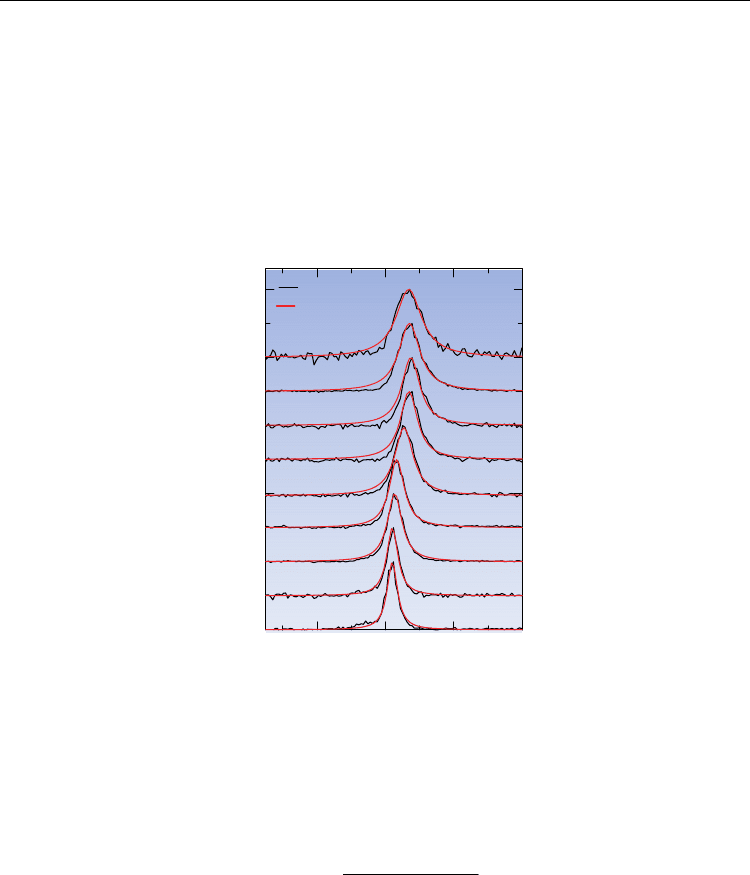
Figure 6. shows temperature dependence of PL spectra of single SWNTs from 40 to 297 K.
Solid red lines correspond to fitted Lorentzian functions. The SWNT has a chiral index of (9,
8), based on the emission energies reported (Lefebvre, Fraser, Homma et al., 2004). The PL
Electronic Properties of Carbon Nanotubes
358
spectral shape can be approximately fitted by a single Lorentzian function at entire
temperature range. The linewidths (full-width at half-maximum, FWHM) of the Lorentzian
functions are almost dominated by the exciton dephasing time due to exciton-phonon
interactions, because the exciton lifetime is longer than 30 ps, and the contribution to the
linewidth from the exciton lifetime (energy relaxation time) is negligibly small (Hirori et al.,
2006, & Gokus et al., 2008). From the homogeneous linewidth, we calculated the exciton
dephasing time at room temperature as about 120 fs for (9, 8) nanotubes. The order of the
experimentally obtained dephasing time is almost consistent with the Ab initio calculation
(Bradley et al., 2007).
0.88 0.90 0.92 0.94
Photon Energy (eV)
Normalized PL Intensity (arb. units)
40
70
100
130
160
190
220
250
297 K
(9,8)
exp.
Lorentizian
Fig. 6. Temperature dependence of PL spectra of a single SWNT from 40 to 300 K (Reprinted
with permission from [Yoshikawa et al, 2008]. Copyright, American Physical Society).
The PL spectra become narrower when the temperature decreases as shown in Fig. 6. The
linewidth of a single SWNT corresponding to a homogeneous linewidth is plotted as a
function of temperature in Fig. 7. The temperature dependence of the homogeneous
linewidth is usually described as (Karaiskaj et al., 2007):
0
,
exp( / ) 1
B
B
AT
kT
(2)
where Γ
0
is the residual linewidth at T=0 K including the instrumental spectral resolution,
and is the energy of the high frequency phonon modes in SWNTs, such as the radial
breathing mode (RBM) and averaged phonon mode. The coefficients A and B are exciton-
phonon coupling constants for low- and high-frequency modes, respectively. The solid line
in Fig. 7 shows the linewidth fitted using Eq. (2). The temperature dependence of the
homogeneous linewidth shows almost linear behaviour over a wide temperature range. The
value of A obtained for the (9, 8) nanotube is 0.020 meV/K. The contribution of the high-
Exciton Dephasing in a Single Carbon Nanotube Studied by Photoluminescence Spectroscopy
359
frequency modes to the linewidth broadening is much smaller than that of the low-
frequency acoustic phonon mode and negligibly small.
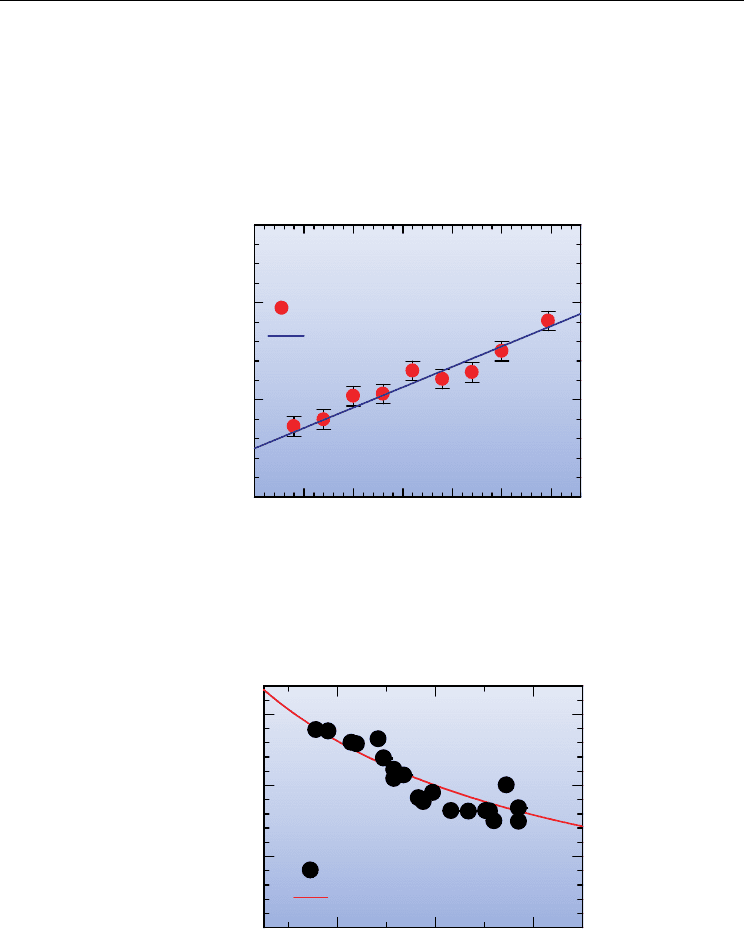
We obtained PL spectra at 300 K from more than 200 different isolated SWNTs with a
variety of chiral indices. The homogeneous linewidth as a function of the nanotube diameter
d from the PL spectra of single carbon nanotubes is shown in Fig. 8. The smallest values are
plotted as the intrinsic linewidth for nanotubes with the same chiral index, because the
extrinsic factors (defects, impurities, and so on) cause broadening to a residual linewidth.
The PL linewidth at 300 K clearly increases as the diameter decreases.
0 50 100 150 200 250 300
0
5
10
Temperature(K)
FWHM, Γ (meV)
exp.
Fitting
Fig. 7. Temperature dependence of linewidth broadening and theoretically fitted result
using Eq. (2) (Reprinted with permission from [Yoshikawa et al, 2008]. Copyright, American
Physical Society).
0.8 1.0 1.2
0
5
10
15
Diameter d (nm)
FWHM, Γ (meV)
300 K
exp.
Theory
Fig. 8. Diameter dependence of homogeneous linewidth (Reprinted with permission from
[Yoshikawa et al, 2008]. Copyright, American Institute of Physics).
Electronic Properties of Carbon Nanotubes
360
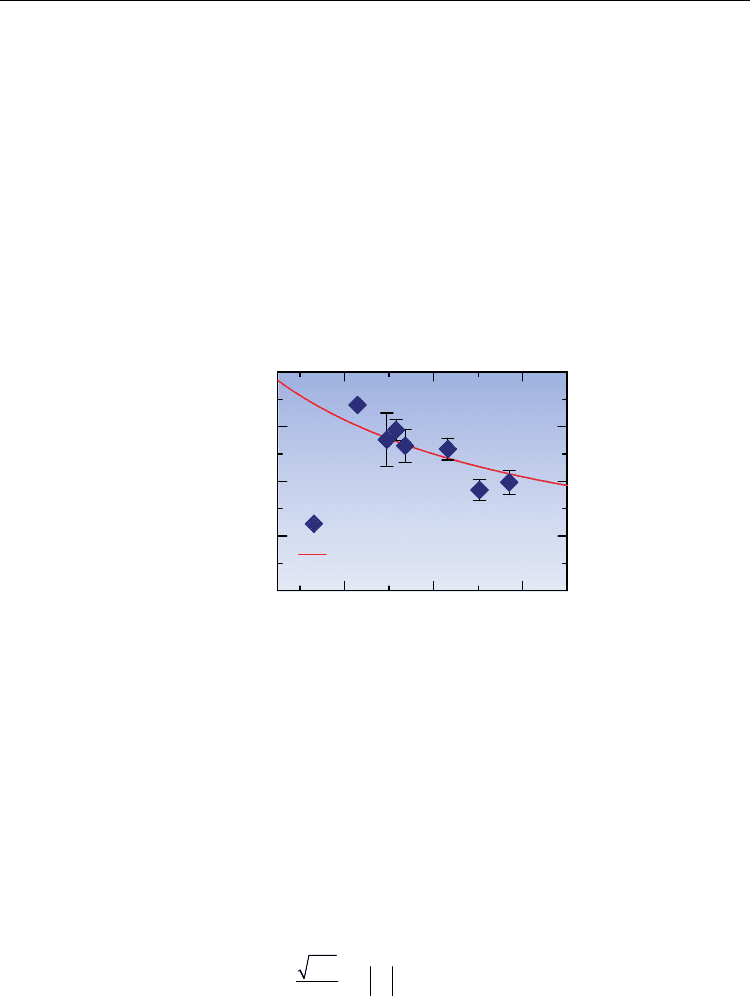
The exciton-phonon coupling constant A for low energy phonon modes is plotted in Fig. 9.
The diameter dependence of A is well consistent with that of the homogeneous linewidth at
300 K in Fig. 8. These observations indicate that the diameter dependence of the PL
linewidth observed at 300 K is not due to the residual linewidth and the nonlinear
temperature term in Eq. (2), which is caused by high-frequency modes such as the RBM and
averaged phonon mode. From the diameter dependence of the homogeneous linewidth and
the exciton-phonon coupling constant A, it can be seen that the exciton-phonon interaction is
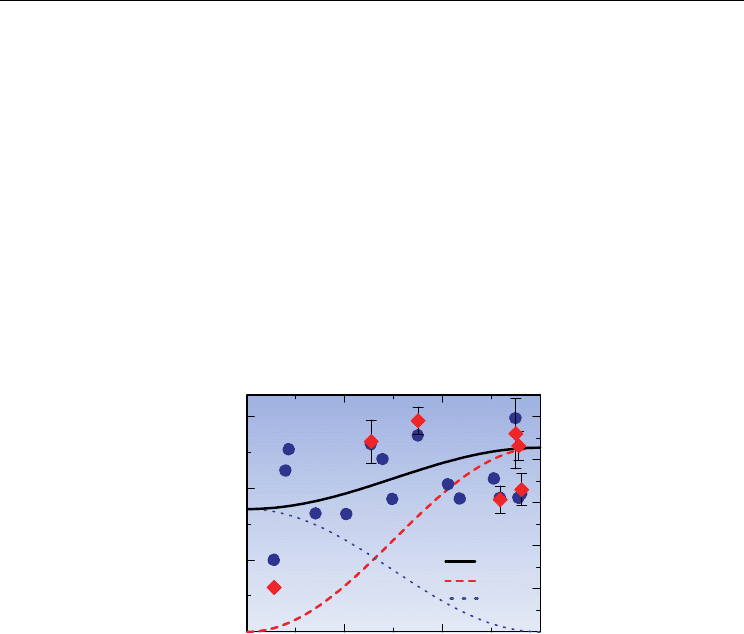
stronger and the exciton dephasing time shorter in smaller tubes. Figure 10 shows the
chirality dependence of the homogeneous linewidth at 300 K and exciton-phonon coupling
constant A. The data are plotted for SWNTs of around 1.0 nm indiameter (within the range
from 0.9-1.2 nm). Both the homogeneous linewidth and the exciton-phonon coupling
constant are almost constant, and neither show the clear chiral angle dependence.
However, there is the scattering of the data due to the diameter dependence, as discussed
below.
0.8 1.0 1.2
0
0.01
0.02
0.03
0.04
A (meV/K)
exp.
Theory
Diameter (nm)
Fig. 9. Diameter dependence of linewidth broadening factor A and theoretically calculated
result (Reprinted with permission from [Yoshikawa et al, 2008]. Copyright, American
Institute of Physics).
We will discuss the mechanism of the exciton dephasing from the diameter and chirality
dependence of the exciton-phonon coupling (homogeneous linewidth) in detail. Here we
refer the discussion on the electron-phonon interaction, because there have been no detailed
quantitative theoretical studies of exciton-phonon interactions. As described in Jiang et al.,
2007, the diameter and chirality dependence of the exciton-phonon interactions show a
similar tendency to the electron-phonon interactions (Jiang et al., 2005, & Jiang et al., 2007).
The exciton (electron)-phonon coupling constant using the reduced exciton (electron)-
phonon matrix element may be written as follows (Suzuura et al., 2002, Jiang et al., 2005,
Jiang et al., 2007, & Popov et al., 2006),
2
0
1/2
,
j
j
M
AgE
d
(3)
where M
0
is the exciton effective mass, E is the exciton energy, and g
j
is the reduced matrix-
element of the exciton-phonon interaction. As both M
0
and E are inversely proportional to
Exciton Dephasing in a Single Carbon Nanotube Studied by Photoluminescence Spectroscopy
361
the diameter d, the exciton-phonon coupling in Eq. (2) has 1/d dependence. The diameter
dependence (A1/d) arises from the specific characteristics of the exciton-phonon
interaction in 1D carbon nanotubes.
The linear temperature dependence of the linewidth noted above suggests that the phonon
modes that contribute to linewidth broadening are low-energy acoustic modes, such as TW
(twisting) and LA (longitudinal acoustic). The chirality dependences of the predicted
reduced exciton (electron)-phonon matrix elements for TW and LA phonon modes are
described by g
TW
=cos3 and g
LA
=0.66sin3, respectively (Suzuura et al., 2002). Using the
reduced matrix-elements, we calculated the diameter dependence of the exciton-phonon
coupling constant from Eq. (2). The results are indicated by the red solid line in Figs. 8 and 9.
The calculated diameter dependence of the homogeneous linewidth from Eqs. (2) and (3) is
also shown in Figs. 8 and 9. We assumed that the residual linewidths are constant (2.0 meV)
in the theoretically calculated curve, because they are almost constant independent of the
diameter, and the variation of the values is small (within 1 meV) for each single nanotube.
The theoretical calculated line in Fig. 9 agrees closely with the experimental results.
0 10 20 30
0
0.01
0.02
0.03
2
4
6
8
10
12
Chiral Angle (degree)
FWHM, Γ
(
meV
)
A (meV/K)
LA
TA
LA+TA
A
Γ
Fig. 10. Chiral angle dependence of linewidth broadening factor A and FWHM at room
temperature. (solid line) (Reprinted with permission from [Yoshikawa et al, 2008].
Copyright, American Institute of Physics).
Figure 10 also shows the calculated chirality dependence of the exciton-phonon coupling
constant (homogeneous linewidth) for SWNTs of around 1 nm in diameter, indicated by the
solid line. The contributions of the two phonon modes LA and TW are indicated as dashed
and dotted lines, respectively. The calculated result indicated by the solid line is in
agreement with the experimental results of the chirality dependence of the exciton-phonon
coupling constant (homogeneous linewidth). In the small (large) chiral angle nanotubes, the
TW (LA) mainly contributes to the exciton-phonon coupling constant (homogeneous
linewidth). These observations indicate that both the LA and TA modes contribute to the
exciton dephasing for carbon nanotubes.
3.3 Dephasing exciton state via exciton-exciton interaction
We studied temperature dependence of the PL spectra of an isolated SWNT excited with a
He-Ne laser. The spectra were measured under lower excitation conditions (less than 100
Electronic Properties of Carbon Nanotubes
362
μW). The PL spectra clearly narrow when the temperature decreases (Lefebvre et al., 2004).
The exciton energy changes from 5 to 90 K (1 meV) is much smaller than that in other
compound semiconductor quantum wire (12 meV from 5 to 90 K in GaAs wires) in the weak
exciton-phonon coupling regime. This weak temperature dependence is consistent with the
experimental fact of narrow PL spectra with Lorentizian lineshape in Fig. 5. Both the
dephasing time and the energy relaxation time of the excitons contribute to homogeneous
linewidth broadening. The measured PL lifetimes of excitons are considerably longer (≥20
ps) from 10 to 300 K (Perebeinos et al., 2005, & Hirori et al., 2006) and this contribution to the
linewidth is negligibly small (≤ 0.01 meV) under lower excitation conditions. Thus, the
temperature-dependent linewidths are determined approximately by the dephasing time of
the exciton due to the exciton-phonon interactions. Based on the homogeneous linewidth,
the exciton-dephasing time is evaluated from 350 fs at 90 K to more than 940 fs at 5 K.
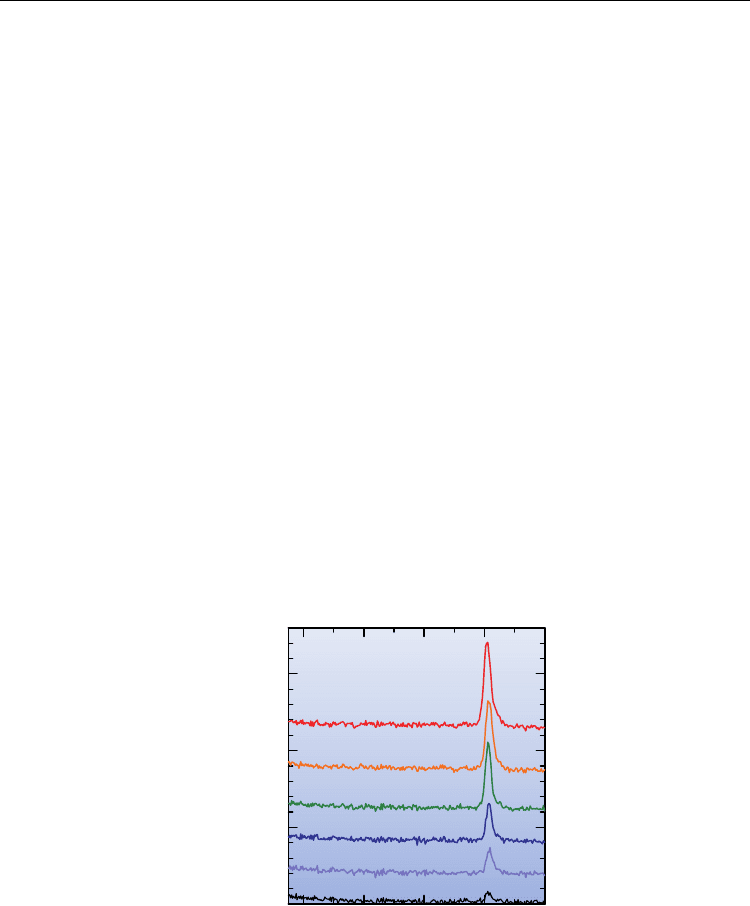
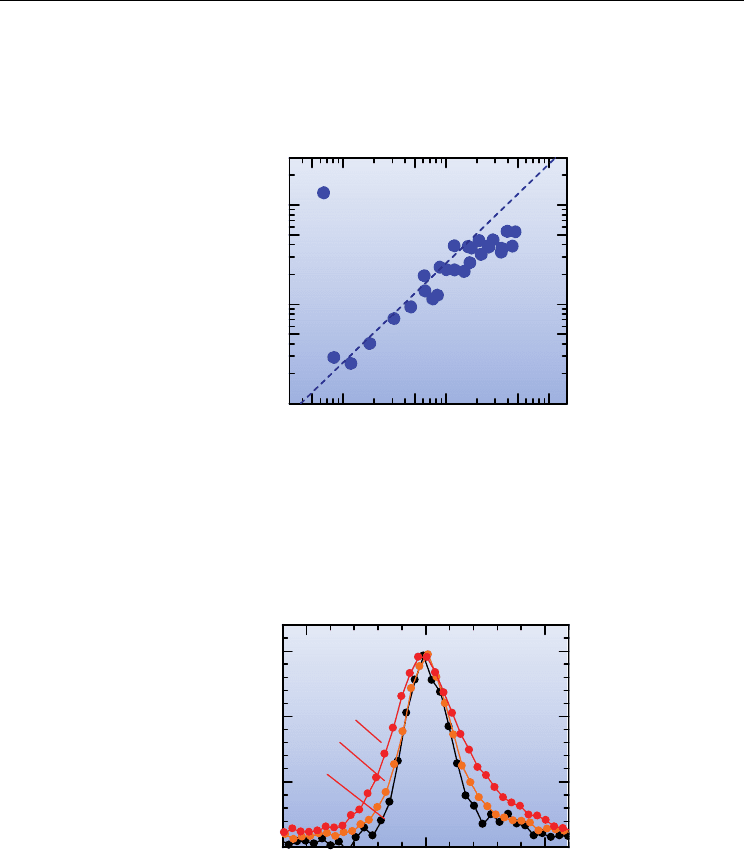
Figure 11 shows PL spectra obtained from a typical single SWNT [assigned chiral index: (11,
4)] at 30 K and at various excitation intensities of 1.72-eV and 150-fs laser pulses. Each
spectrum has a single peak located at 0.941 eV. Even in the high-excitation region above
about 15 pJ per pulse, the PL spectrum shows a single peak, without a change in the peak
energy. Furthermore, additional spectral structures are not observed in any lower energy
regions. Similarly, the PL bands due to biexcitons and inelastic exciton scattering are not
observed in this spectral region.
Spectrally integrated PL intensities are plotted as a function of excitation laser intensity in
Fig. 12. In a low excitation region below 10 pJ, the PL intensity grows almost linearly with
excitation intensity (as indicated by a dotted line). Conversely, in the higher excitation
intensity region (> 20 pJ), saturation of the PL intensity is clearly apparent. We show
normalized PL spectra for a single SWNT, excited with different intensities, on an expanded
energy scale in Fig. 13. The spectral linewidth broadens with increasing excitation intensity.
0.88 0.90 0.92 0.94 0.96
0
500
1000
1500
Photon Energy (eV)
PL Intensity (arb. units)
(11,4)
30 K
1.3
5.0
13
8.8
17
49 pJ
Fig. 11. Excitation power dependence of PL spectra of single SWNT at 30 K (Reprinted with
permission from [Matsuda et al, 2008]. Copyright, American Physical Society).
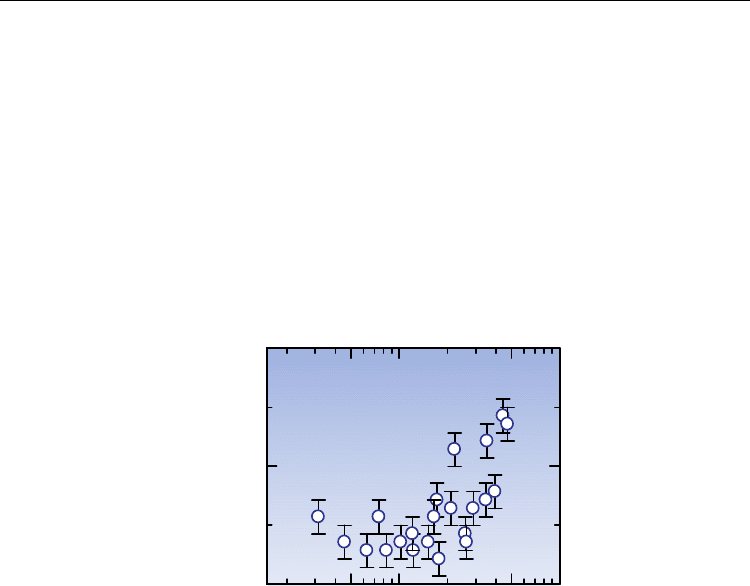
The homogeneous linewidth is plotted in Fig. 14 as a function of excitation intensity, with
the FWHM of the linewidth broadening nonlinearly. This broadening cannot be explained
Exciton Dephasing in a Single Carbon Nanotube Studied by Photoluminescence Spectroscopy
363
by laser heating effects because the nonlinear broadening behavior contradicts the linear
temperature dependence of the linewidth broadening [see Fig. 7]. This excitation intensity-
dependent linewidth broadening indicates that the exciton dynamics are strongly affected
by the multiple excitons present in a SWNT.
10
0
10
1
10
2
10
1
10
2
10
3
Excitation Intensity (pJ)
PL Intensity (arb. units)
exp.
Fig. 12. Integrated PL intensity as a function of excitation intensity. Dotted line corresponds
to linear dependence (Reprinted with permission from [Matsuda et al, 2008]. Copyright,
American Physical Society).
-5 0 5
0
50
100
150
Norm. PL Intensity (arb. units
)
Photon Energy (meV)
(11,4)30 K
48 pJ
13
6.3
Fig. 13. Normalized PL spectra of a single SWNT on an expanded energy scale excited with
different intensities (Reprinted with permission from [Matsuda et al, 2008]. Copyright,
American Physical Society).
Under higher excitation conditions, when additional homogeneous linewidth broadening
and saturation of the PL intensity occur, more than one exciton is created in a SWNT,
leading to a remarkable scattering process between excitons. Exciton-exciton annihilation
Electronic Properties of Carbon Nanotubes
364
occurs due to the rapid Auger nonradiative recombination process through strong Coulomb
interactions (Wang et al., 2004, Ma et al., 2005, Haung et al., 2006, & Wang et al., 2006).
The PL intensity saturation at higher excitation regions, as shown in Fig. 12, can be
explained by the opening of the nonradiative relaxation path due to the exciton-exciton
annihilation.
The homogeneous linewidth Γ in Fig. 14 is determined by both the excitation power
independent exciton-phonon interaction term Γ
ex-ph
and the excitation power dependent
Auger term Γ
ex-ex
,
.
ex ph ex ex
(6)
The homogeneous linewidth broadening at higher excitation regions can be explained by
the shortening of exciton lifetime due to the Auger process.
5 10 50 100
2
3
4
Excitation Intensity (pJ)
Linewidth (meV)
Fig. 14. Homogeneous linewidths as a function of excitation intensity (Reprinted with
permission from [Matsuda et al, 2008]. Copyright, American Physical Society).
From the experimental results, the derived exciton-exciton annihilation constant of 1.6
ps/m is almost consistent with the theoretically calculated value based on perturbation
theory (Wang 2006). From this result, it was found that the multiparticle Auger process
occurs very efficiently with an Auger recombination time estimated at 800 fs for 1 m-long
SWNT when two excitons are present in a SWNT. This very short, in comparison to bulk
semiconductors, time constant is characteristics of low-dimensional systems, and is
comparable to the exciton-dephasing time at low temperature. These results indicate that
the exciton dephasing is limited under high excitation conditions, not by the exciton-phonon
interactions, but by the exciton-exciton interactions.
4. Conclusion
In this chapter, we studied the temperature and chirality dependence of the PL linewidth of
single carbon nanotubes using single SWNT spectroscopy to clarify the mechanism of
exciton dephasing. The PL linewidth of a single carbon nanotube broadened linearly with
increasing temperature, indicating that the linewidth and exciton dephasing are determined