Lallart M. Ferroelectrics: Characterization and Modeling
Подождите немного. Документ загружается.

All-Ceramic Percolative Composites with a Colossal Dielectric Response
119
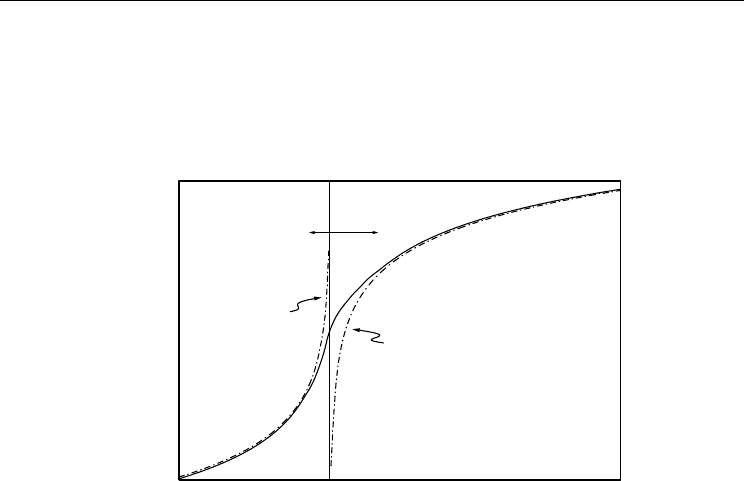
σ
=
σ
metal
[(p-p
c
)/p
c
]
t
, (2)
which holds true for p>p
c
. σ
matrix
and σ
metal
are conductivities of the dielectric and metallic
phases, respectively (of course h=σ
matrix
/σ
metal
<<1). This behavior is depicted in Fig. 2,
which also reveals that a smooth transition from Eq. (1) to Eq. (2) occurs in some small
interval Δ near the percolation point.
01
Δ
2
1
p
c
0
log h
log(σ/σ
metal
)
volume fraction of metallic regions
Fig. 2. The theoretical dependence of the effective electrical conductivity σ (solid line) for a
system consisting of randomly distributed metallic and dielectric regions. A smooth
transition between behaviors described by Eqs. (1) and (2) (dash-dotted lines) occurs in
small interval Δ near the percolation point p
c
(vertical line).
Very high dielectric constants can thus be achieved in metal-insulator composites close to
the percolation point. However, up to now mainly organic percolative composites (Dang et
al., 2003; Huang et al., 2004; Xu & Wong, 2005) and inorganic composites comprising metal
particles dispersed in a dielectric matrix (Deepa et al., 2007; Grannan et al., 1981; Li et al.,
2001; Yoshida, 1990) have been developed. In organic percolative composites values of the
dielectric constant as high as 7000 were obtained (Huang & Zhang, 2004). As the dielectric
constant of a polymer is typically less than 100, i.e., far below the values of inorganic
ferroelectrics, which reach several thousands, it is not surprising that the dielectric constant
in percolative composites with an inorganic matrix can reach values as high as 80000
(Pecharroman et al., 2001).
2.1 All-ceramic percolative composites
Composites of ferroelectric ceramics and conductive ceramic particles can offer a major
advantage in the development of high dielectric constant materials, as percolative systems
comprising ceramics and metal particles are relatively sensitive to processing. The latter can
be sintered in air only if a noble metal is used; however, if the conductive component is
based on a non-noble metal, the system has to be fired in a neutral or reducing atmosphere.
Such a procedure can negatively influence the electrical properties of ferroelectric ceramics,
which are, due to the relatively high dielectric constant, very suitable for the matrix in a

Ferroelectrics - Characterization and Modeling
120
percolative system. For example, insulating ferroelectric BaTiO
3
or Pb(Zr,Ti)O
3
systems can
become semiconducting as a result of reduction (Raymond & Smyth, 1996). The combination
of insulating and conducting ceramics is thus inherently better than the combination of
oxide ceramics and metallic particles, as the all-oxide ceramic systems can be sintered in air.
On the other hand, all-ceramic systems could suffer from reactions between both
constituents during high-temperature sintering, resulting in new compounds or solid
solutions with undesirable characteristics. The compatibility between the chosen ceramic
matrix and the conductive ceramics must therefore be carefully evaluated.
3. Processing and structural analysis
3.1 Synthesis of all-ceramic percolative composites
3.1.1 Pb(Zr,Ti)O
3
–Pb
2
Ru
2
O
6.5
system
Pb(Zr,Ti)O
3
–Pb
2
Ru
2
O
6.5
all-ceramic percolative system was made from PbZr
0.53
Ti
0.47
O
3
(PZT)
and Pb
2
Ru
2
O
6.5
powders. These two systems have been chosen as Pb
2
Ru
2
O
6.5
is a very good
electrical conductor, having the resistivity of 270×10
-8
Ωm (Pierce et al., 1982), and as
investigations of the phase equilibrium in the Pb–Zr–Ti–Ru–O system showed that PZT is
compatible with Pb
2
Ru
2
O
6.5
at least up to 1000ºC (Hrovat et al., 2001). PZT powder with a 6
mol.% excess of PbO was prepared by mechanochemical synthesis (Kuščer et al., 2006) from
high-purity PbO, ZrO
2
, and TiO
2
. The excess lead oxide was added to compensate for its
evaporation during the synthesis. Pb
2
Ru
2
O
6.5
powder was prepared by solid-state synthesis
from PbO and RuO
2
by repeated firing with intermediate grinding (three times) at 850ºC.
Prereactered PZT and Pb
2
Ru
2
O
6.5
powders were mixed, pressed into pellets and fired on
platinum foils at 850ºC for 15 min.
3.1.2 0.65Pb(Mg
1/3
Nb
2/3
)O
3
-0.35PbTiO
3
–Pb
2
Ru
2
O
6.5
system
Although values of the dielectric constant as high as 40000 were detected in the PZT-
Pb
2
Ru
2
O
6.5
composite (Bobnar et al., 2008), a further challenge was to find another ceramic
system, with much higher dielectric constant as those of PZT if possible, which would also
be compatible with the Pb
2
Ru
2
O
6.5
system. 0.65Pb(Mg
1/3
Nb
2/3
)O
3
-0.35PbTiO
3
(PMN-35PT)
perovskite ferroelectric, which has a very high dielectric constant as this composition is close
to the morphotropic phase boundary (Priya et al., 2002), was found to be such a system, and,
consequently, in the developed PMN-35PT–Pb
2
Ru
2
O
6.5
composite values of the dielectric
constant higher than 10
5
were detected (Bobnar et al., 2009a). Similarly to the PZT, PMN-
35PT powder was prepared by mechanochemical synthesis (Kuščer et al., 2007). A mixture
of PbO, MgO, TiO
2
, and Nb
2
O
5
in the molar ratio corresponding to the stoichiometry of
0.65PMN–0.35PT with 2 mol % of the PbO excess was high-energy milled in a planetary mill
for 64 hours. A total of 200 g of powder was placed in the vial. Finally, prereactered PMN-
35PT and Pb
2
Ru
2
O
6.5
powders were mixed, pressed into pellets and fired on platinum foils
at 1000ºC for 4 hours.
3.1.3 Lead-free K
0.5
Na
0.5
NbO
3
–RuO
2
composite
As lead represents a possible ecological hazard, a great deal of current materials research is
oriented toward environmentally friendly lead-free materials. Thus, K
0.5
Na
0.5
NbO
3
–RuO
2
(KNN-RuO
2
) lead-free percolative composite has also been developed (Bobnar et al., 2009b):
RuO
2
is a very good electrical conductor with the resistivity of 40×10
-8
Ωm (van Loan, 1972)

All-Ceramic Percolative Composites with a Colossal Dielectric Response
121
and it has been found that there is no reaction between KNN and RuO
2
at temperatures
even higher than 1000ºC. K
0.5
Na
0.5
NbO
3
powder was prepared by solid-state synthesis from
K
2
CO
3
, Na
2
CO
3
, and Nb
2
O
5
. A total of 2 wt.% of potassium-sodium germanate was added to
lower the sintering-temperature of KNN. The powder mixtures were homogenized, calcined
at 900ºC for 4 hours and milled to yield submicron-sized powders. KNN and RuO
2
powders
were then mixed in acetone in a ball mill. The powders were pressed into pellets and fired
on platinum foils at 1000ºC for 2 hours.
3.2 Characterization methods
The phase composition of the PZT, PMN-35PT, KNN, and Pb
2
Ru
2
O
6.5
powders was checked
by X-ray powder diffraction using a Philips PW 1710 X-ray diffractometer with Cu Kα
radiation. The X-ray spectra were measured from 2Θ=20º to 2Θ=70º.
Fired PZT–Pb
2
Ru
2
O
6.5
, PMN-35PT–Pb
2
Ru
2
O
6.5
, and KNN–RuO
2
samples were
characterized using X-ray powder diffraction. A JEOL 5800 scanning electron microscope
(SEM) equipped with a link ISIS 300 energy-dispersive X-ray analyzer (EDS) was used for
the overall microstructural and compositional analyses. The samples prepared for the
SEM were mounted in epoxy in a cross-sectional orientation and then polished using
standard metallographic techniques. Prior to analysis in the SEM, the samples were
coated with carbon to provide electrical conductivity and avoid charging effects. The
microstructures of the polished samples were studied using back-scattered electron
imaging and compositional contrast to distinguish between the phases that differ in
density (average atomic number Z).
3.3 Structural properties
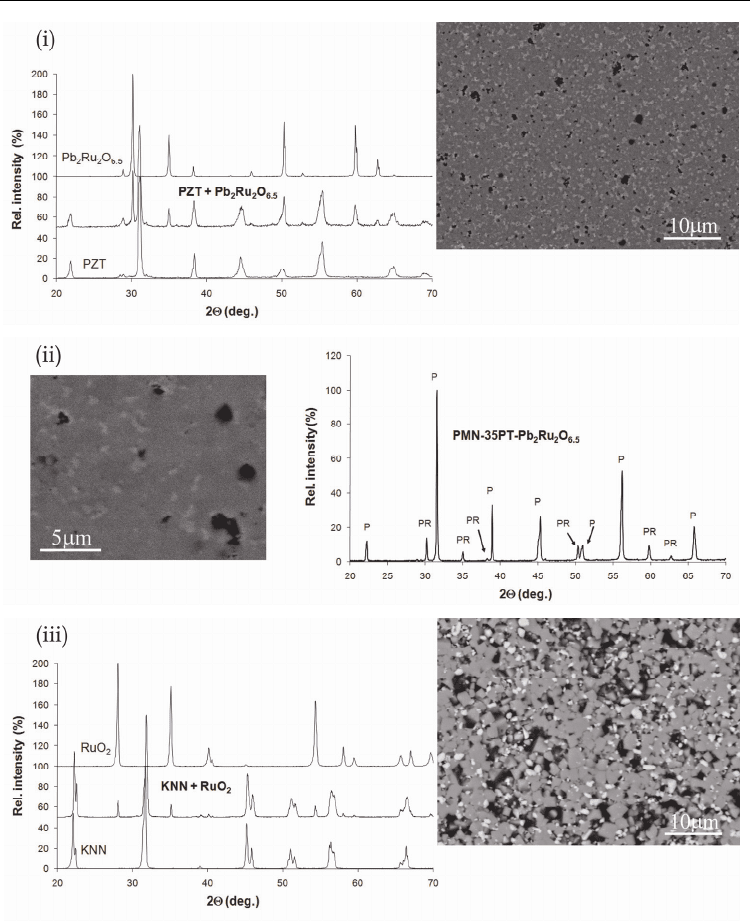
Microstructures and X-ray spectra of developed all-ceramic percolative composites are
shown in Fig. 3. The microstructure of the PZT–Pb
2
Ru
2
O
6.5
composite with 15 vol.% of
Pb
2
Ru
2
O
6.5
consists of small, light-grey inclusions (Pb
2
Ru
2
O
6.5
) in a dark-grey matrix
(sintered PZT). The small black spots are pores. PMN-35PT–Pb
2
Ru
2
O
6.5
microstructure
(also the sample with 15 vol. % of Pb
2
Ru
2
O
6.5
) consists of small, light-grey Pb
2
Ru
2
O
6.5
inclusions, a dark-grey PMN-PT matrix, and a few pores. The microstructure of the lead-
free KNN–RuO
2
sample with 15 vol.% of RuO
2
reveals that the grey KNN matrix consists
of cubic-shaped grains, while the light-grey inclusions are RuO
2
grains.
In each of the three composites the conductive filler is uniformly distributed throughout the
matrix. The EDS microanalysis did not detect any solid solubility in developed composites,
which confirms the results obtained with X-ray analyses: Only the peaks of the initial
compounds are present in the fired samples and, furthermore, no shifts in the peaks’
positions were observed (for comparison, the X-ray spectra of individual PZT, KNN, and
Pb
2
Ru
2
O
6.5
constituents are included in Fig. 3). The results therefore indicate that (i) PZT and
Pb
2
Ru
2
O
6.5
, (ii) PMN-35PT and Pb
2
Ru
2
O
6.5
, as well as (iii) KNN and RuO
2
are compatible at
the firing temperatures.
Structural analysis thus revealed a demanded structure of composites – there is no reaction
and no solid solubility between constituents and the conductive filler is uniformly
distributed throughout the matrix. Consequently, the dielectric response of the developed
PZT–Pb
2
Ru
2
O
6.5
, PMN-35PT–Pb
2
Ru
2
O
6.5
, and KNN-RuO
2
composites should follow the
predictions of the percolation theory.
Ferroelectrics - Characterization and Modeling
122
Fig. 3. Microstructures and X-ray spectra of developed all-ceramic percolative composites:
(i) PZT–Pb
2
Ru
2
O
6.5
with 15 vol. % of Pb
2
Ru
2
O
6.5
; (ii) PMN-35PT–Pb
2
Ru
2
O
6.5
with 15 vol. % of
Pb
2
Ru
2
O
6.5
; (iii) KNN–RuO
2
with 15 vol. % of RuO
2
. For comparison, the X-ray spectra of
individual PZT, KNN, and Pb
2
Ru
2
O
6.5
constituents are included in (i) and (iii), while in the
PMN-35PT–Pb
2
Ru
2
O
6.5
X-ray spectrum peaks of the PMN-35PT and Pb
2
Ru
2
O
6.5
are denoted
with P and PR, respectively.

All-Ceramic Percolative Composites with a Colossal Dielectric Response
123
4. Dielectric response of composites
Samples of 5–6 mm in diameter with sputtered gold electrodes on both surfaces were used
for dielectric characterization. The complex dielectric constant ε*(ν,T)=ε'-iε'' was measured
as a function of the frequency (ν; 20 Hz to 1 MHz) and temperature (T; heating and cooling
rates of ±0.5°Cmin
-1
) using an HP4284A precision LCR meter. The amplitude of the probing
ac electric signal, applied to samples with a thickness of ≈300 μm, was 1 V. The temperature
was stabilized using a lock-in bridge technique with a Pt100 resistor as a thermometer. The
real part of the complex ac-conductivity σ*(ν,T)=σ'+iσ'' was calculated via σ'=2πνε
0
ε'' with ε
0
being the permittivity of free space.
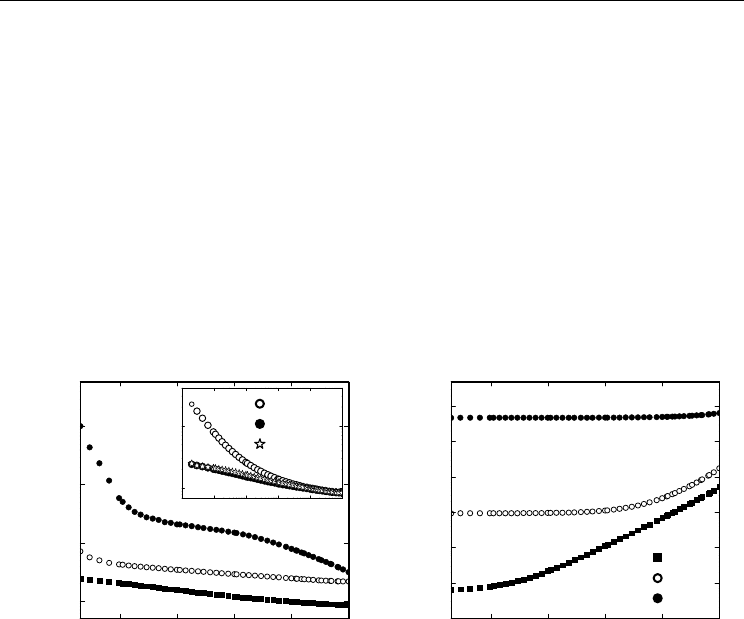
4.1 Qualitative description of the frequency spectra
The frequency dependence of the room-temperature dielectric constant ε' and conductivity
σ' in PZT–Pb
2
Ru
2
O
6.5
samples with different Pb
2
Ru
2
O
6.5
volume concentrations is shown in
Fig. 4. There exist several mixing formulae, or even different approaches, which predict or
describe the dielectric response of a two-component heterogeneous system. For example, a
detected behavior of the electrical conductivity – at higher frequencies σ' increases, while at
lower frequencies values tend toward the dc-conductivity plateau – could easily be modeled
by an equivalent circuit composed of two RC circuits connected in serial. The resistivity of
the low-frequency plateau is then R
1
+R
2
, while at higher frequencies the conductivity
follows a ν
2
law if R
2
>>R
1
(Efros & Shklovskii, 1976), as is, evidently, the case in a
percolative composite (then the value of the low-frequency plateau is just the resistivity of
the matrix). However, although a crossover from the plateau to the ν
2
dependence has in
fact been observed in the Al
6
Si
2
O
13
-molybdenum composite (Pecharroman & Moya, 2000),
the σ'(ν) increase here is much weaker. This is not surprising, as for granular systems, rather
than modeling the spectra by various equivalent circuits with frequency-independent
elements, more physically transparent models are needed in order to adequately describe
their effective dielectric response.
The complex electrical conductivity of different metal-insulator composites can often be
described by the two exponent phenomenological percolation equation – an excellent review
of this method is given in (Chiteme et al., 2007). The equation is also known as the general
effective medium equation. In fact, by using the effective medium approach (EMA –
assuming that the probing field is homogeneous within the individual particles) it has been
derived that the ac conductivity in a random system follows a ν
s
behavior with s<1
(Springett, 1973), as has in fact been detected in our composites. In the limit of EMA also a
rather general approach has been formulated (Petzelt & Rychetsky, 2005), which states that
for any two-component composite with sharp particle boundaries the dielectric response
can be composed of two additive parts. One part describes the sum of the original bulk
responses weighted by the relative volumes, while the second part describes the localized
particles affected by the depolarization field depending on particle shape and its
surroundings. Within this approach, the spherical shape of inclusions leads to a percolation
threshold of 1/3 (Rychetsky et al., 1999), thus a more general particle form and topology
would be needed to describe smaller threshold, as is frequently observed (also in our case,
as will be shown in the next subsection). However, the detected dielectric response of all
developed composites (see PZT–Pb
2
Ru
2
O
6.5
in Fig. 4, PMN-PT–Pb
2
Ru
2
O
6.5
in Fig. 5, and
KNN-RuO
2
in Fig. 6) can be qualitatively understood:
Ferroelectrics - Characterization and Modeling
124
At lower frequencies the conductivity of the Pb
2
Ru
2
O
6.5
or RuO
2
inclusions is effectively
blocked, while at sufficiently high frequencies their higher conductivity is revealed since
most of the charge carriers have no time to feel the blocking boundaries. The effective ac-
conductivity σ' therefore increases with frequency (and would increase up to the high-
frequency plateau corresponding to the value of the Pb
2
Ru
2
O
6.5
or RuO
2
conductivity). As
even for an inhomogeneous system the Kramers-Kronig relations must be satisfied, the
increasing σ' contribute to the static dielectric constant via a strong dielectric relaxation. In
systems with the composition very close to the percolation threshold (the PZT–Pb
2
Ru
2
O
6.5
composite with 17 vol. % of Pb
2
Ru
2
O
6.5
in Fig. 4 and the lead-free KNN-RuO
2
composite
with 20 vol. % of RuO
2
in Fig. 6), ac-conductivity is almost frequency-independent in the
entire experimental range. Considering the Kramers-Kronig relations, we may conclude that
here the strong conductivity dispersion shifts below 10 Hz, as, on the other hand, the
dielectric constant in these samples strongly increases at lower frequencies.
10
2
10
3
10
4
10
5
10
6
10
3
10
4
10
5
10
6
vol. % Pb
2
Ru
2
O
6.5
10 16.5
12.5 17
15.5
ν
(Hz)
ε'
10
2
10
3
10
4
10
5
10
6
10
-8
10
-6
10
-4
10
-2
PZT-Pb
2
Ru
2
O
6.5
σ'
(Ω
-1
cm
-1
)
ν
(Hz)
Fig. 4. Frequency dependence of the real parts of the complex dielectric constant ε' and
conductivity σ' measured at room temperature for PZT–Pb
2
Ru
2
O
6.5
samples with different
volume concentrations of Pb
2
Ru
2
O
6.5
.
10
2
10
3
10
4
10
5
10
6
10
3
10
4
10
5
PMN-35PT-Pb
2
Ru
2
O
6.5
10
15
17
ν
(Hz)
ε'
10
2
10
3
10
4
10
5
10
6
10
-4
10
-3
10
-2
10
-1
10
0
vol. % Pb
2
Ru
2
O
6.5
σ'
(Ω
-1
cm
-1
)
ν
(Hz)
Fig. 5. Room-temperature dielectric constant and conductivity as a function of the frequency
for PMN-35PT–Pb
2
Ru
2
O
6.5
samples with different Pb
2
Ru
2
O
6.5
volume concentrations.
All-Ceramic Percolative Composites with a Colossal Dielectric Response
125
In contrast to both lead-based systems, the experimental condition plays an important role
in the KNN-RuO
2
composite, as being emphasized in Fig. 6. Here, the main frames show the
frequency dependence of ε' and σ' in samples with different RuO
2
volume concentration,
measured at room temperature under vacuum. While the evaluation of data on increasing
RuO
2
content is very similar to that in the PZT–Pb
2
Ru
2
O
6.5
and PMN-35PT–Pb
2
Ru
2
O
6.5
systems, the low-pressure condition is very important. The inset namely clearly reveals that
ε', measured in air, additionally strongly increases at lower frequencies. Most probably this
is due to the conductivity contribution of water in the pores – in the KNN-RuO
2
these are
much larger than in the lead-based composites (see Fig. 3). This is further endorsed by the
fact that data taken under atmospheric pressure but with highly-hygroscopic silica-gel
placed in the sample cell are almost identical to those detected under vacuum. Thus, all
results, hereupon presented for the KNN-RuO
2
system, were obtained under vacuum, while
the pressure condition did not play any role in denser lead-based PZT–Pb
2
Ru
2
O
6.5
and
PMN-35PT–Pb
2
Ru
2
O
6.5
systems.
10
2
10
3
10
4
10
5
10
6
10
3
10
4
10
5
10
6
vol.
% RuO
2
15
17.5
20
ν
(Hz)
ε'
10
2
10
3
10
4
10
5
10
6
10
-8
10
-6
10
-4
10
-2
KNN-RuO
2
σ'
(Ω
-1
cm
-1
)
ν
(Hz)
10
2
10
4
10
6
10
3
10
4
air
vacuum
silica gel
Fig. 6. Frequency dependence of ε' and σ' measured under vacuum at room temperature in
KNN–RuO
2
samples with different volume concentrations of RuO
2
. The inset shows data
obtained in the sample with 15 vol. % of RuO
2
after three different treatment procedures.
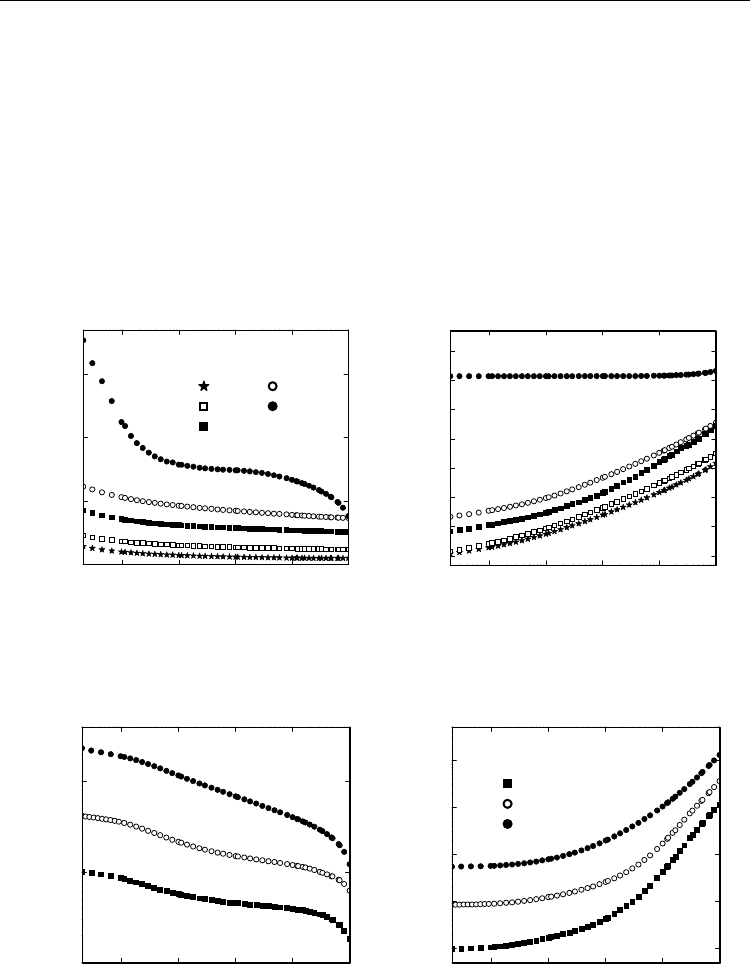
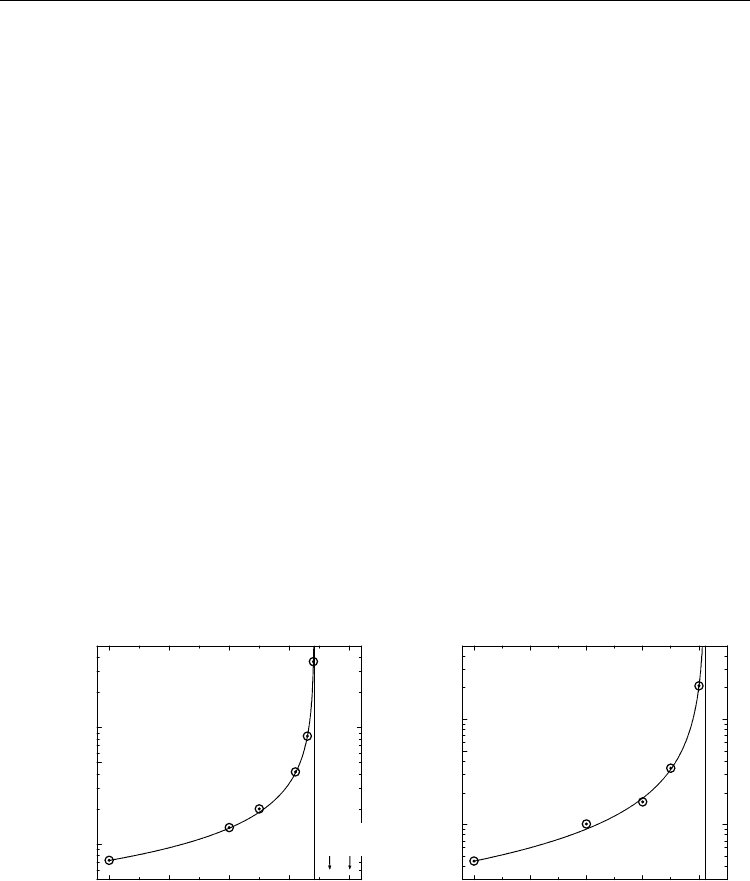
4.2 Evolution of the dielectric constant vs. the conductive filler volume concentration
Values of the real part of the complex dielectric constant evidently strongly increase with
higher conductive filler volume concentration (see ε'(ν) spectra for samples with different
compositions in Figs. 4 to 6). This dependence is clearly depicted in Figs. 7 and 8, which
show the evolution of ε' (measured at room temperature at the frequency of 1 kHz) in all
developed all-ceramic percolative composites versus the conductive filler volume content.
The solid line represents the fit of the experimental data to an expression derived from
general percolation theories (Bergman & Imry, 1977; Efros & Shklovskii, 1976)
ε'
=
ε
m
[(p
c
-p)/p
c
]
-q
, (3)
which has been, up to now, successfully applied to several organic and inorganic percolative
composites (Huang et al., 2004; Pecharroman et al., 2001; Song et al., 1986). Here, ε
m
is the
Ferroelectrics - Characterization and Modeling
126
real part of the complex dielectric constant of the insulator matrix, p is the volume
concentration of the conductive admixture, p
c
is the percolation threshold for the conduction
(unambiguously defined in the ideal composite with the zero conductivity of the matrix via
σ
dc
=0 for p<p
c
), and q is the critical exponent. Several values for the percolation critical
exponents and the threshold value have been proposed on the basis of theoretical
derivations (Bergman & Imry, 1977; Efros & Shklovskii, 1976; Feng et al., 1987) or numerical
calculations (Straley, 1977; Webman et al., 1975). While standard percolation theories on
three-dimensional lattices assume q≈0.9 and p
c
≈0.16 (Kirkpatrick, 1973), rather different
values (usually a much higher p
c
) have been experimentally detected in various percolative
systems, which can be explained in terms of the continuous percolation theory (Feng et al.,
1987). Here, the fit of the PZT–Pb
2
Ru
2
O
6.5
data yields q=0.723±0.004 and p
c
=0.171±0.001. It is
interesting that almost identical value of q has been detected in the samples consisting of
small Ag particles, randomly embedded in a non-conducting KCL host (Grannan et al.,
1981) and also predicted by numerical calculations performed on a cubic lattice of resistors
with two possible values of resistance (Straley, 1977). The fit of the KNN–RuO
2
data yields
q=1.05±0.04 (q=1 is obtained in the framework of the effective medium approach regardless
of the space dimensionality (Efros & Shklovskii, 1976)) and p
c
=0.205±0.004, and the fit of the
PMN-35PT–Pb
2
Ru
2
O
6.5
data yields q=0.89±0.04 and p
c
=0.174±0.003. However, the most
important fact is that exact fits of ε' in Figs. 7 and 8 further confirms the perfect outgrowth of
the PZT–Pb
2
Ru
2
O
6.5
, PMN-35PT–Pb
2
Ru
2
O
6.5
, and KNN–RuO
2
composites, with the dielectric
constant near the percolation threshold being for two orders of magnitude higher than in the
pure matrix (PZT, PMN-35PT, or KNN) ferroelectric ceramics – this hold true also for the
PMN-35PT–Pb
2
Ru
2
O
6.5
and KNN–RuO
2
composites, where a significant fraction of porosity,
which can clearly be seen in Fig. 3 (and is many times observed in KNN-based ceramic
composites (Sun et al., 2008)) undoubtedly alters the dielectric response, i.e., decreases the
dielectric constant.
0 5 10 15 20
300
1000
5000
10000
50000
KNN-RuO
2
ε'
p
c
vol. % RuO
2
0 5 10 15 20
500
1000
5000
10000
50000
PZT-Pb
2
Ru
2
O
6.5
percolative
p
c
ε'
vol. % Pb
2
Ru
2
O
6.5
Fig. 7. The real part of the complex dielectric constant of the PZT–Pb
2
Ru
2
O
6.5
and KNN–
RuO
2
composites vs. the conductive filler volume content, measured at room temperature at
the frequency of 1 kHz. Solid lines represent fits of the experimental data to Eq. (3), while
vertical lines indicate the percolation threshold p
c
. Arrows indicate two percolative, i.e.,
electrically conductive PZT–Pb
2
Ru
2
O
6.5
samples – their ε' values cannot be determined.
All-Ceramic Percolative Composites with a Colossal Dielectric Response
127
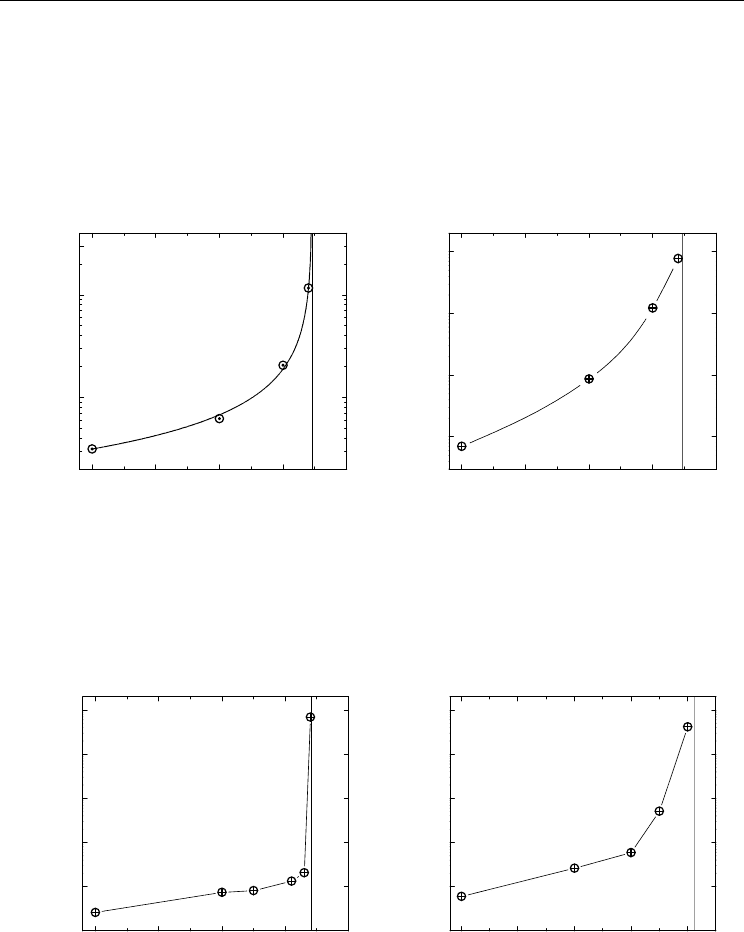
It should once again be stressed out that the effective conductivity, similar as the effective
dielectric constant (Eq. (3)), exhibits a critical behavior in the vicinity of p
c
(see Eqs. (1) and
(2)), while at the percolation point σ' undergoes an abrupt discontinuity. Such a behavior is
clearly depicted in Fig. 8 for the PMN-35PT–Pb
2
Ru
2
O
6.5
system. Consequently, the dielectric
loss factor tanδ=ε''/ε' becomes extremely high near p
c
(see Fig. 9). Thus, percolative samples
with compositions near the percolation threshold are by default not suitable for applications
where the dielectric loss factor should be small. However, the electrical conductivity in
samples with lower conductive filler concentration, where dielectric constant is still much
0 5 10 15 20
2
10
100
300
PMN-35PT-Pb
2
Ru
2
O
6.5
ε'/1000
p
c
vol.
% Pb
2
Ru
2
O
6.5
0 5 10 15 20
10
-5
10
-4
10
-3
10
-2
PMN-35PT-Pb
2
Ru
2
O
6.5
p
c
σ'
(Ω
-1
cm
-1
)
vol.
% Pb
2
Ru
2
O
6.5
Fig. 8. Evolution of the dielectric constant and the dependence of the electrical conductivity
on the Pb
2
Ru
2
O
6.5
volume content in PMN-35PT–Pb
2
Ru
2
O
6.5
samples at room temperature at
the frequency of 1 kHz. The solid line through the ε' experimental data is the fit to Eq. (3).
The solid line through the σ' data is a guide to the eye, while vertical lines in both graphs
denote the percolation threshold.
0 5 10 15 20
10
-2
10
-1
10
0
10
1
10
2
10
3
p
c
KNN-RuO
2
tan
δ
vol. % RuO
2
0 5 10 15 20
10
-2
10
-1
10
0
10
1
10
2
10
3
p
c
PZT-Pb
2
Ru
2
O
6.5
tan
δ
vol. % Pb
2
Ru
2
O
6.5
Fig. 9. Dependence of the dielectric loss factor tanδ=ε''/ε' on the conductive filler volume
concentration in the PZT–Pb
2
Ru
2
O
6.5
and KNN–RuO
2
all-ceramic percolative composites.
Solid lines are guides to the eye.
Ferroelectrics - Characterization and Modeling
128
higher than in the pure matrix ceramic system, are supposedly acceptable for applications –
for example, PZT–Pb
2
Ru
2
O
6.5
samples with p<0.165 (see Figs. 7 and 9), where tanδ<0.1,
while dielectric constant still reaches values above 5000.
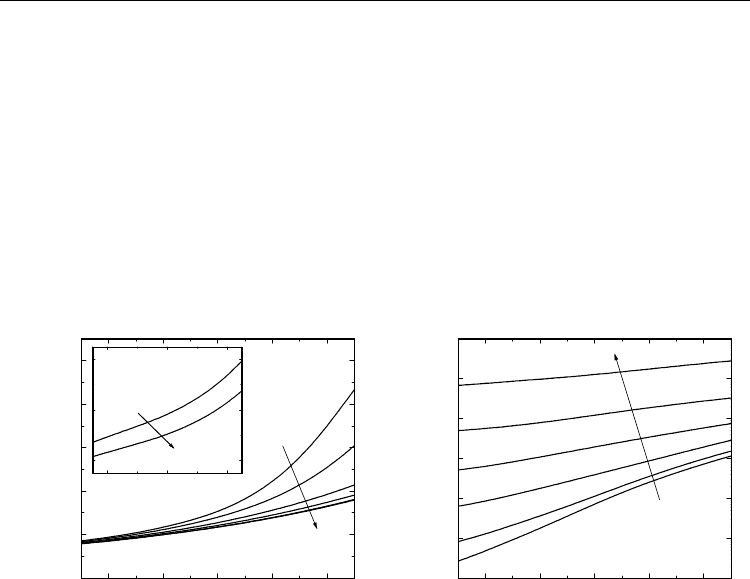
4.3 Temperature stability of the response
The temperature dependence of the dielectric constant ε' and ac electrical conductivity σ',
measured at various frequencies in the PZT–Pb
2
Ru
2
O
6.5
sample (10 vol. % of Pb
2
Ru
2
O
6.5
), is
shown in Fig. 10 for the temperature interval of -125ºC−125ºC. Although above room
temperature, due to the increasing conductivity, ε' at lower frequencies strongly increases,
the detected dependences are rather smooth around room temperature. Similar conclusion
applies for the KNN–RuO
2
system – ε'(T) detected at two frequencies in the sample with 15
vol. % of RuO
2
is shown in the inset to Fig. 10.
-100 -50 0 50 100
0
1000
2000
3000
4000
5000
ν
ν
ε'
PZT-Pb
2
Ru
2
O
6.5
T
(
o
C)
ε'
-100 -50 0 50 100
10
-10
10
-8
10
-6
10
-4
ν
PZT-Pb
2
Ru
2
O
6.5
σ'
(Ω
-1
cm
-1
)
T
(
o
C)
-100 0 100
700
1100
1500
KNN-RuO
2
T
(
o
C)
Fig. 10. Temperature dependence of the dielectric constant and ac electrical conductivity,
measured at several frequencies (30 Hz, 100 Hz, 1 kHz, 10 kHz, 100 kHz, 1 MHz, order
indicated by arrows) in the PZT–Pb
2
Ru
2
O
6.5
sample with 10 vol. % of Pb
2
Ru
2
O
6.5
. The inset
shows ε' measured as a function of the temperature at two frequencies (100 kHz, 1 MHz) in
the KNN–RuO
2
sample with 15 vol. % of RuO
2
.
While temperatures of the paraelectric-to-ferroelectric phase transition in the PZT and KNN
systems are much above the highest measured temperature (≈370ºC in the PZT and ≈420ºC
in the KNN), this phase transition, taking place in the matrix, dominates the temperature
dependence of the PMN-35PT–Pb
2
Ru
2
O
6.5
composite in the measured temperature range.
Fig. 11 shows the temperature dependence of the dielectric constant and ac electrical
conductivity, detected at various frequencies in the PMN-35PT–Pb
2
Ru
2
O
6.5
sample with 15
vol. % of Pb
2
Ru
2
O
6.5
. The paraelectric-to-ferroelectric phase transition in the pure PMN-PT
system of this composition takes place at T
c
≈165ºC (Colla et al., 1998), but, as can be seen in
Fig. 11, becomes slightly diffusive in a heterogeneous composite system – the ε'(T) and σ'(T)
maxima are frequency dependent here and at temperatures lower than T
c
. We may,
however, as in the case of PZT–Pb
2
Ru
2
O
6.5
and KNN–RuO
2
systems, still conclude that at
higher frequencies the temperature dependence is relatively smooth in the range around
room temperature, i.e., in the temperature range most interesting for eventual applications.