Kumar E.S. (ed.) Integrated Waste Management. V.I
Подождите немного. Документ загружается.


Comparison of the Suitability
of Two LCA Procedures in Selecting the Best MSW Management System
441
avoided by energy recovery as well as recycling of matter. The operation of boundaries
expansion is necessary in any LCA procedure in order to eliminate the potential
environmental impacts that would be induced by the avoided processes of primary
production (due to secondary production) from the results of the system analyzed.
The next step of the LCA procedure is the Inventory Analysis (compilation and
quantification of inputs and outputs), which is the most important phase of the activity
because it allows for the acquisition of all the information which is useful in compiling and
quantifying the flows of matter and energy in input and output from each phase for the
quantification of emissions.
Data about the Inventory Analysis of the WISARD procedure are reported in De Feo and
Malvano (2009), which contains all the information pertaining to the mass and energy
balances of the treatment plants of any MSW components. While, the full details of the
Inventory Analysis of the SimaPro procedure are presented here.
The following modules, described in greater detail later, were implemented: Packaging
Glass Green at Plant, Aluminium Secondary, from old scrap at Plant, Recycling Paper, with
deinking at Plant, Recycling Plastics, Compost, at Plant, Glass Virgin, Aluminium Primary,
at Plant, Thermomechanical Pulp, at Plan, PET, HDPE, LDPE, Ammonium Nitrate, Single
Superphosphate, Potassium Sulphate, Landfill, Municipal Waste Incineration Plant,
Wastewater Treatment Plant (PRé Consultants, 2007a, b).
The utilized data were deduced from average European plants as well as Italian specific
plants that best approximate the systems to be adopted on a provincial level as well as best
meet the requirements during the Goal and Scope definition of the study. The analysis was
carried out on three levels. In fact, the Inventory was drawn up simultaneously taking into
account:
raw materials and energy used;
transport of products, waste treatment and construction, dismantling and disposal of
production sites;
characterization of the machinery necessary for production and processing.
In particular, data were deduced from two principal sources: the Ecoinvent database and
real data relating to MSW treatment and disposal plants operating in Italy and, particularly,
in the Campania region. The MSW management model was constructed on the basis of
several hypothesis, further verified with specific evaluation tests. In particular, assumptions
were made in relation to the type of goods produced by “primary production” and
“secondary production”. Moreover, selection, recovery and recycling efficiencies for all
types of materials were adopted. The basic assumption is that 1 kg of material produced by
recycling replaces 1 kg of material produced from raw materials (Rigamonti et al., 2009).
Table 2 and 3 respectively show the type of packaging products and selection, recovery and
recycling efficiencies adopted in the study.
Material Primary Production Secondary Production
Aluminium Ingot Ingot
Glass Container Container
Paper Thermomechanical Paper Pulp
Plastic Grains of PET, HDPE, LDPE,
LLDPE, PP
Grains of PET, HDPE, Mix (LDPE,
LLDPE, PP)
Table 2. Type of packaging products (Rigamonti et al., 2009)

Integrated Waste Management – Volume I
442
Material Efficiency of Selection
(%weight)
Efficiency of Recovery
(%weight)
Efficiency of Recycling
(%weight)
Aluminium 95 93 88.3
Glass 94 100 94
Paper 95 90 85.5
Plastic 80 73.5 58.7
Garden Waste 80 37.5 30
Table 3. Selection, recovery and recycling efficiencies (Rigamonti et al., 2009)
2.3.1 Composting plant
Putrescibles are treated by means of an aerobic composting process for the production of
high quality compost to be used for farming in substitution of traditional chemical
fertilizers. The basic assumption is that 1 kg of compost replaces a certain amount of
artificial fertilizer so that the intake of nutrients N, P and K remains unchanged. A ton of
compost contains: 6.2 kg N, 2.0 kg P and 4.5 kg K. Table 4 shows the general characteristics
as well as consumption data of the composting plan t, useful for the Inventory Analysis.
Energy required, type and quantity of polluting emissions as well as waste production
relating to a treatment capacity of 10,000 tonnes of putrescibles per year. Moreover, they
relate to a specific production of 1 kg of compost with a final water content of 50% by
weight (Ecoinvent Data).
Composting Plant – Compost, at plant
General Characteristics
Life Time (year) Treated Tonnes (t/m) Type
10 – Stationarity Machinery
5 – Mobile Machinery
25 – Structural elements
10,000 Mechanized
Consumption
Diesel (kg) Electricity (kWh) Water (l)
2.65E-3 1.18E-2 0
Table 4. Characteristics of the composting plant (modified by Nemecek et al., 2004)
2.3.2 Glass recycling plant
The recovery of glass was analyzed both in terms of preparation and selection of glass waste
from separate collection as well as in terms of recycling activity (fusion, secondary
packaging production, cooling, packaging and transporting to end users). The treated
materials are crushed and selected by means of both manual and automatic processes with
the removal of 100% of the impurities originally present. Table 5 shows the general
characteristics as well as consumption data of the glass recycling plant, useful for the
Inventory Analysis.

Comparison of the Suitability
of Two LCA Procedures in Selecting the Best MSW Management System
443
Glass Recycling Plant – Packaging Glass Green at plant
General Characteristics
Life Time (year) Treated Tonnes (t/m) Type
20 – Stationarity Machinery
5 – Mobile Machinery
50 – Structural Elements
100,000 Mechanized
Consumption
Diesel (kg) Electricity (kWh) Water (l)
4.19E-2 2.44E-1 1.98E-3
Oil (MJ) Natural Gas (MJ) -
4.33E-2 3.57 -
Table 5. Characteristics of the glass recycling plant (modified by Hischier, 2007)
2.3.3 Paper recycling plant
The management of paper and cardboard waste involves the following phases: collecting,
selecting and transporting to the recovery facilities. The recovery process considered was
recycling without deinking with consumption of electricity and subsidiary materials,
emission of pollutants into the air and wastewater treatment. Only natural gas was used as
fuel for the heat production. While, a fuel mix of 16.1% coal, 70.3% methane and 13.6% fuel
oil was used for electricity production. The recycling treatment was compared with the
classical process of paper production from raw materials. The technology used is the
thermal-mechanical treatment for the removal of fibres from wood chips. Table 6 shows the
general characteristics as well as consumption data of the paper recycling plant, useful for
the Inventory Analysis.
Paper Recycling Plant – Recycling Paper without deinking at plant
General Characteristics
Life Time (year) Treated Tonnes (t/m) Type
20 – Stationarity Machinery
5 – Mobile Machinery
50 – Structural Elements
33,000 Mechanized
Consumption
Diesel (kg) Diesel (kg) Diesel (kg)
0.6555 7.9E-1 1.07E-2
Oil (MJ) Natural Gas (MJ) Coal (MJ)
0.6555 6.7769 1.552
Table 6. Characteristics of the paper recycling plant (modified by Hischier, 2007)
2.3.4 Aluminium recycling plant
Aluminium deriving from MSW separate collection is sent to facilities for the selection and
subsequent recycling for the production of secondary aluminium products. The process is
based on the use of “old” scrap deriving from separate collection and prepared by means of
the selection and removal of organic matter in order to be suitable for the subsequent fusion
process. The efficiency of recycling was assumed equal to 93%. The Life Cycle Analysis
considers emissions from aluminium production from raw materials, as well. In particular,

Integrated Waste Management – Volume I
444
data from the Ecoinvent database and references concerning the best technologies used in
industry for the production of non-ferrous metals are shown in Table 7.
Aluminium Recycling Plant – Aluminium Secondary, from old scrap at plant
General Characteristics
Life Time (year) Life Time (year) Life Time (year)
50 10,000 Mechanized
Consumption
Oil (MJ) Electricity (kWh) Water (l)
5.13 2.88E-1 0
Natural Gas (MJ) - -
8.27 - -
Table 7. Characteristics of an aluminium recycling plant (modified by Althaus et al., 2004)
2.3.5 Plastic recycling plant and mechanical–biological plant
In the Inventory Analysis developed for the waste treatment and disposal plants, the
available data have allowed for a precise and detailed characterization of all the process
units with the exception of those relating to the plants of plastics recycling plants and plants
of mechanical and biological treatment (MBT) of dry residue as designed in the Campania
region. For plastic recycling and MBT plants, in particular, the analysis only took into
account the information relating to the consumption of matter and energy of the process,
without considering the consumption of a second or third level related to the construction of
the production site as well as production of machineries contained in the plants.
Tables 7, 8 and 9 show the summary data of the energy balance relating to plastic recycling
and MBT plants, respectively.
Plastic Recycling Plant
Plastics Selection
Fuel (kWh/t) Diesel (MJ/t)
26.6 84
PET Recovery
Fuel (kWh/t
R-PET
) Methane (MJ/t
R-PET
)
258 2500
HDPE Recovery
Fuel (kWh/t
R-HDPE
) Methane (MJ/t
R-HDPE
)
379 650
Table 8. Data of the energy balance relating to plastic recycling plants (Rigamonti et al, 2009)
3. Results and discussions
3.1 Summary of results obtained with WISARD
With the WISARD procedure, only scenarios 1-10, 20 and 21 were studied. The outputs from
each option modelled were analysed under eleven environmental effect categories as
suggested by the WISARD procedure with the aim of carrying out a synthetic study of
the data available (Pricewaterhouse Coopers, 2006). The impact assessment categories

Comparison of the Suitability
of Two LCA Procedures in Selecting the Best MSW Management System
445
Mechanical –Biological Plant
General Characteristics
Polyethylene Film (kg) Water (l)
1.6E-4 0.088
Wire (kg) Electricity (MJ)
3.00E-4 0.051
Diesel (MJ)
0.01
Table 9. Data of the energy balance relating to MBT plants (Arena, 2003)
suggested are as follows: renewable energy use, non-renewable energy use, total energy use,
water, suspended solids and oxydable matters index, mineral and quarried matters,
greenhouse gases, acidification, eutrophication, hazardous waste, non-hazardous waste (De
Feo and Malvano, 2009).
Attention was given to both measuring the overall impact due to the application of the
entire MSW management system adopted, as well as the evaluation of the specific
contribution produced by each phase of the MSW management system. In fact, each system
was subdivided into the following sixteen phases: glass collection logistics (GCL), glass
collection recycling (GCR), glass collection disposal (GCD), paper collection logistics (PaCL),
paper collection recycling (PaCR), paper collection disposal (PaCD), plastics and metals
collection logistics (Pl&MCL), plastics and metals collection recycling (Pl&MCR), plastics
and metals collection disposal (Pl&MCD), putrescibles collection logistics (PCL),
putrescibles collection composting (PCC), putrescibles collection disposal (PCD), dry
residue collection logistics (DRCL), dry residue collection recycling (DRCR), dry residue
collection RDF incineration (DRCI), and dry residue collection disposal (DRCD) (De Feo and
Malvano, 2009).
Therefore, 192 management phases were considered (corresponding to the product of 16
phases for 12 scenarios), while 2112 single impact values were analysed and compared
(corresponding to the product of 11 impact categories for 192 management phases).
Moreover, 132 total impact values were analysed and compared (corresponding to the
product of 11 impact categories and 12 management scenarios) (De Feo and Malvano, 2009).
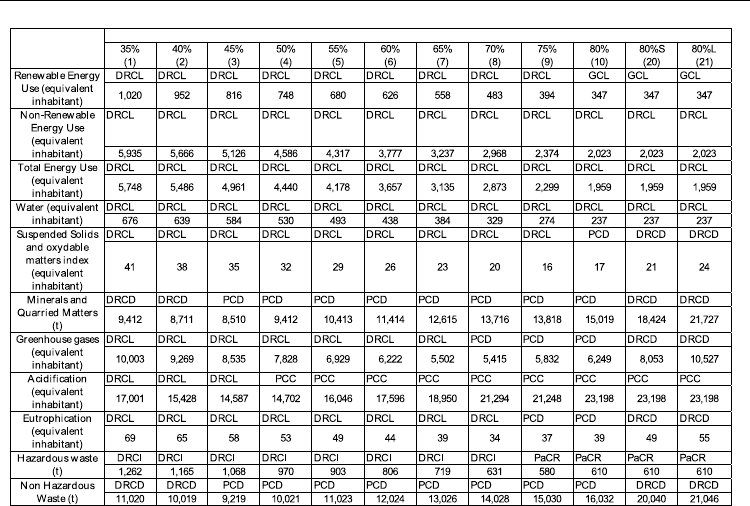
The goal of the study was to evaluate the results obtained (values of avoided or produced
impact) in order to highlight the most environmentally sound scenarios for each
environmental impact category, as well as the trend associated with the percentage of
separate collection (for the first ten MSW management scenarios), thus evaluating the
positive and negative effects of recycling and/or composting (Table 10). The LCA software
tool calculates impact values, performing mass and energy balances on the basis of the
amount of waste to be treated. For scenarios 1–10, these quantities vary linearly with the
percentage of separate collection and therefore the impact values for each management
phase also vary in the same manner. Since the sum of the linear function is a linear function,
the total impact values for each category also have to vary linearly. Moreover, for each
impact category and MSW management scenario developed, the management phase with
the greatest avoided impact (Table 11) and the management phase with the greatest
produced impact (Table 12) were highlighted. Finally, scenarios 10, 20 and 21 were
compared in order to highlight for which impact categories for high percentages of separate

Integrated Waste Management – Volume I
446
collection a management system based on recovery and recycling but without incineration
would be preferable (De Feo and Malvano, 2009).
In summary, the following outcomes were obtained with the WISARD procedure (De Feo
and Malvano, 2009):
Scenario number 21 (80% separate collection, no RDF incineration, dry residue sorting)
was the most environmentally sound option for the following six impact categories:
renewable energy use, total energy use, water, suspended solids and oxydable matters
index, eutrophication, and hazardous waste;
Scenario number 10 (80% separate collection, RDF production and incineration) was the
most environmentally sound option for the following three impact categories: non-
renewable energy use, greenhouse gases, and acidification;
Scenario number 1 (35% separate collection, RDF production and incineration) was the
most environmentally sound option for the following two impact categories: mineral
and quarried matters, and non-hazardous waste;
For the following eight impact categories (of the eleven considered), all the MSW
management scenarios considered produced negative impacts, and the highest
percentage of separate collection corresponded to the highest avoided impact:
Renewable Energy Use, Non-Renewable Energy Use, Total Energy Use, Water,
Suspended Solids and Oxydable Matters Index, Acidification, Eutrophication, and
Hazardous Waste;
For ‘‘Mineral and Quarried Matters” the MSW management scenarios considered
produced positive and negative impacts, and the highest percentage of separate
collection corresponded to the highest produced impact;
For ‘‘Greenhouse Gases”, the MSW management scenarios considered produced
positive and negative impacts, and the highest percentage of separate collection
corresponded to the highest avoided impact;
For ‘‘Non-Hazardous Waste” all the MSW management scenarios considered produced
positive impacts, and the highest percentage of separate collection corresponded to the
highest produced impact;
For the following six impact categories (of the eleven considered), for high percentages
of separate collection (80%), a management system based on recovery and recycling but
without incineration would be preferable: Renewable Energy Use, Total Energy Use,
Water, Suspended Solids and Oxydable Matters Index, Eutrophication and Hazardous
Waste;
‘‘Paper Collection Recycling” was the system component with the greatest avoided
impact for 45.5% of the cases considered;
‘‘Dry Residue Collection Logistic” was the system component with the greatest
produced for 54.5% of the cases considered.
3.1 Results obtained with SimaPro
The results obtained with the SimaPro procedure were evaluated by means of three keys.
The first key evaluates the results of the Inventory Analysis consisting of the data on the
emissions of pollutants into the environment due to the different phases of the MSW
management system, focusing on the treatment activities of the several MSW components.
Thus, it was possible to compare in quantitative environmental terms, the impacts generated

Comparison of the Suitability
of Two LCA Procedures in Selecting the Best MSW Management System
447
Table 10. Summary of the numerical results obtained with WISARD for MSW management
scenarios 1-10 developed in terms of avoided or produced impact (De Feo and Malvano,
2009)
Table 11. Management phase with the greatest avoided impact for each impact category and
for MSW management scenarios 1-10 developed in the study performed with WISARD.
DRCL = dry residue collection logistics; DRCD = dry residue collection disposal; DRCR =
dry residue collection recycling; PaCR = paper collection recycling; Pl&MCR = plastics and
metals collection recycling; GCR = glass collection recycling; PCC = putrescibles collection
composting; PCD = putrescibles collection disposal (De Feo and Malvano, 2009)
Integrated Waste Management – Volume I
448
Table 12. Management phase with the greatest produced impact for each impact category
and for MSW management scenarios 1-10 developed in the study performed with WISARD.
DRCD = dry residue collection disposal; DRCL = dry residue collection logistics; DRCI =
dry residue collection RDF incineration; DRCR = dry residue collection recycling; GCL =
glass collection logistics; PaCR = paper collection recycling; Pl&MCR = plastics and metals
collection recycling; PCC = putrescibles collection composting; PCD = putrescibles collection
disposal (De Feo and Malvano, 2009)
by the production units of materials from raw materials and impacts resulting from
treatment processes that lead to the production of secondary materials deriving from the
separate collection.
The second interpretation key directly derives from the evaluation model adopted, which
allows for the definition of the damage level induced by the MSW management system with
reference to the following macro-categories: Human Health, Ecosystem Quality and
Resource Consumption. Thus, it was possible to compare different scenarios and express
judgments about the influence of the percentage of separate collection on the impacts
produced. In particular, the damage category “Human Health” includes the following
damage/impact sub-categories: Carcinogens, Respiration Organics, Respiration Inorganics,
Climate Change, Radiation, Ozone Layer. While, “Ecosystem Quality” is the combination of
data related to the following damage/impact sub-categories: Ecotoxicity,
Acidification/Eutrophication, Land Use. Finally, “Resources consumption” comprises the
sub-categories Minerals and Fossil Fuels.
The third and final key relates to the identification of the management phases having a
significant impact on the overall impact as well as how these results vary with the scenarios
considered.

Comparison of the Suitability
of Two LCA Procedures in Selecting the Best MSW Management System
449
3.1.1 Results of the inventory analysis
The analysis of the emission data related to the packaging materials highlighted that, in
most cases, the pollutant emissions from secondary production were lower than that for
primary production for each impact category. Tables 13, 14 and 15 show the results obtained
for the packaging materials of glass, aluminium and paper, respectively.
Emissions Primary Production Secondary Production
CO
2
955 g 880.9 g
CO 1.42 g 0.825 g
NO
X
1.43 g 3.24 g
SO
X
5.07 g 4.85 g
BOD
5
0.584 mg 1.74 g
COD 0.011.9 g 2.18 g
Tot. Nitrogen 11.5 mg 10.1 mg
Sand 562 g 1.99 mg
Table 13. Comparison between the emissions due to the primary production of glass and
recycling of the same quantity of glass (secondary production)
Emissions Primary Production Secondary Production
Dust (< 2.5 µm) 4.97 g 269 mg
Dust (> 10 µm) 12.3 g 622 mg
Dust (> 2.5 µm <10 µm) 7.43 g 232 mg
NOx 19.8 g 2.58 g
Cadmium 628 µm 243 µm
BOD
5
20.7 g 1.86 g
COD 33.4 g 4.07 g
PAH 424 µm 23.4 µm
Chrome VI 18.9 mg 4.36 mg
Table 14. Comparison between the emissions due to the primary production of aluminium
and recycling of the same quantity of aluminium (secondary production)
Emissions Primary Production Secondary Production
Water 16.8 m
3
590 l
Wood 1.2 mm
3
2.45 mm
3
CO
2
856 g 809.6 g
CO 586.4 mg 593.6 mg
Chrome VI 11 µm 15.9 µm
BOD
5
1.38 g 647 mg
Chlorine 3.96 g 3.73 g
COD 5.05 g 1.94 g
Mercury 11.5 µm 5.04 µm
Suspended Solid 1.35 g 308 mg
Table 15. Comparison between the emissions due to the primary production of paper and
recycling of the same quantity of paper (secondary production)
Integrated Waste Management – Volume I
450
The presentation of the results of the Impact Assessment in terms of Environmental Damage
makes it possible to analyze the problem of potential impacts in general terms. While, it is
subsequently possible to extrapolate more peculiar considerations (PRè Consultants, 2000).
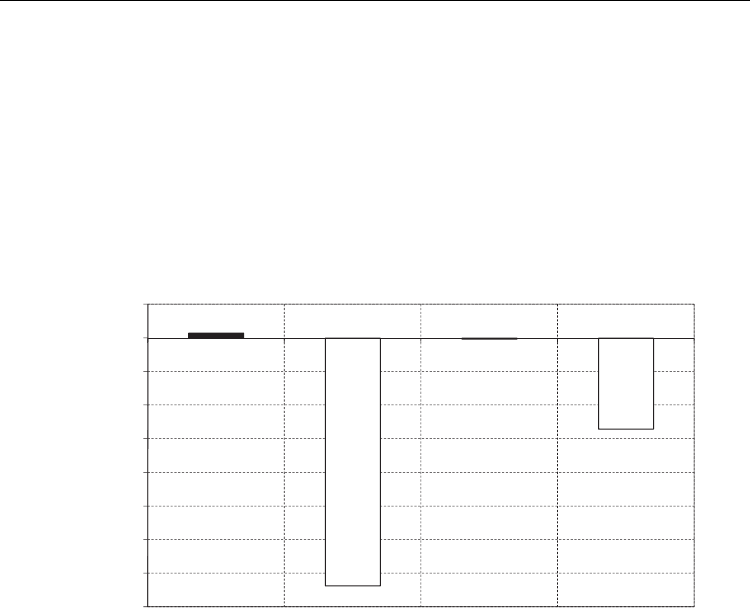
Figures 4, 5 and 6 show the differences between the impact of secondary and primary
production of glass, aluminium, paper and compost, for the damage categories Human
Health, Ecosystem Quality and Resource Consumption, respectively. A positive value of the
difference indicates an induced impact. Thus, for glass and paper the recycling process
induce impacts both in terms of Human Health and Resource Consumption.
-1.60E-05
-1.40E-05
-1.20E-05
-1.00E-05
-8.00E-06
-6.00E-06
-4.00E-06
-2.00E-06
0.00E+00
2.00E-06
Glass Aluminium Paper Compost
DALY
Human Health
Fig. 4. Difference between impact due to primary production and secondary production of
packaging materials and compost in terms of “Human Health” damage category (the
disability-adjusted life year, DALY, is a measure of overall disease burden, expressed as the
number of years lost due to ill-health, disability or early death)
In general, identical to the results obtained with WISARD, with reference to all the
management scenarios considered it was highlighted that the environmental impact linearly
decreases with the percentage of separate collection for each damage category. Only the
subcategory “Acidification/Eutrophication” of the damage macro-category “Ecosystem
Quality” showed an induced impact increasing with the percentage of separate collection
(Table 16). Moreover, the MSW management system determines avoided impacts for the
damage categories “Human Health” and “Resources Consumption”, while it determines
induced impacts for the damage category “Ecosystem Quality”.
Taking into account the contribution of the different MSW management phases, it was noted
that all the considered scenarios have negative impact indicators in terms of Human Health
and Resource Consumption, thus indirectly indicating that in these cases an integrated
management of MSW is more environmentally sound than traditional methods of
production of materials and energy. Dry residue incineration, landfill disposal, composting
and glass production were the MSW management phases with the greatest influence on the
final results in terms of environmental impacts.