Kumar E.S. (ed.) Integrated Waste Management. V.I
Подождите немного. Документ загружается.


Benefits from GIS Based Modelling for Municipal Solid Waste Management
421
It should be noticed that for most of the aforementioned functions the geographic
background (in digital format) of the area under investigation is required. Figure 1
demonstrates the data flow of the adopted procedure. Sumanthi et al. (2008) underline that
the main advantages of applying GIS technology in the landfill siting process are: “the
selection of objective zone exclusion process according to the set of provided screening criteria, the
zoning and buffering function, the potential implementation of ‘what if’ data analysis and
investigating different potential scenarios related to population growth and area development, as well
as checking the importance of the various influencing factors etc., the handling and correlating large
amounts of complex geographical data, and the advanced visualization of the output results through
graphical representation.”
Additionally, the incorporation of various spatial analysis methods, such as geostatistics,
analytical hierarchy process, fuzzy logic modelling and many others, constitutes a major
advantage of a GIS-based modelling approach. Finally, a particularly useful option of a GIS-
based decision making model is the combination of experts knowledge with the opinions of
citizens and stakeholders (Geneletti, 2010).
3. GIS modelling for the optimisation of waste collection and transport
The optimisation of the routing system for collection and transport of municipal solid waste
is a crucial factor of an environmentally friendly and cost effective solid waste management
system. The development of optimal routing scenarios is a very complex task, based on
various selection criteria, most of which are spatial in nature. The problem of vehicle routing
is a common one: each vehicle must travel in the study area and visit all the waste bins, in a
way that minimises the total travel cost: most often defined on the basis of distance or time
but also fuel consumption, CO
2
emissions etc. This is very similar to the classic Travelling
Salesman Problem (TSP) (Dantzig et al., 1954). However, the problem of optimising routing
of solid waste collection networks is an asymmetric TSP (ATSP) due to road network
restrictions; therefore adaptations to the classic TSP algorithm are required, making the
problem more complex.
As the success of the decision making process depends largely on the quantity and quality
of information that is made available to the decision makers, the use of GIS modelling as a
support tool has grown in recent years, due to both technology maturation and increase of
the quantity and complexity of spatial information handled (Santos et al., 2008). In this
context, several authors have investigated route optimisation, regarding both waste
collection in urban and rural environments and transport minimisation, through improved
siting of transfer stations (Esmaili, 1972), landfills (Despotakis & Economopoulos, 2007) and
treatment installations for integrated regional waste management (Adamides et al., 2009;
Zsigraiova et al., 2009).
Optimisation of WC&T making use of the novel tools offered by spatial modelling
techniques and GIS may provide significant economic and environmental savings through
the reduction of travel time, distance, fuel consumption and pollutants emissions
(Johansson, 2006; Kim et al., 2006; Sahoo et al., 2005; Tavares et al., 2008). These systems are
particularly rare in Greek local authorities, where WC&T is typically organised empirically
and in some cases irrationally, under public pressures.
According to Tavares et al. (2008) “effective decision making in the field of management systems
requires the implementation of vehicle routing techniques capable of taking advantage of new
technologies such as the geographic information systems”. Using GIS 3D modelling in the island

Integrated Waste Management – Volume I
422
of Santo Antao, Republic of Cape Verde, an area with complex topography, they achieved
up to 52% fuel savings compared to the shortest distance, even travelling a 34% longer
distance. Nevertheless, most of the previous work relating to optimal routing for solid waste
collection is based on the minimisation of the travelled distance and/or time (Apaydin &
Gonullu, 2007; Lopez et al., 2008), which is considered a sufficient calculator parameter for
fuel consumption and emissions minimisation in flat relief (Brodrick et al., 2002).
Sahoo et al. (2005) presented a comprehensive route-management system, the WasteRoute
for the optimal management of nearly 26000 collection and transfer vehicles that collect over
80 million tons of garbage every year for more than 48 states of USA. The Implementation of
WasteRoute across the USA from March 2003 to the end of 2003 yielded 984 fewer routes,
saving $18 million.
Alvarez et al. (2008) presented a methodology for the design of routes for the “bin to bin”
collection of paper and cardboard waste in five shopping areas of the city of Leganés
(Community of Madrid, Spain). Their proposed system was based on GIS technology and
optimised urban routes according to different restrictions. From the comparison of their
system with the previous situation they concluded that the proposed “bin to bin” system
improved the quality of the paper and cardboard in the containers, avoiding overflow and
reducing the percentage of rejected material.
Teixeira et al. (2004) applied heuristic techniques to solve a collection model in order to
define the geographic zones served by the vehicles, as well as the collection routes for
recyclable waste collection of the centre-littoral region of Portugal. The study indicated that
proper modelling of the collection procedure can provide cost effective solutions.
Nuortio el al. (2006) developed a GIS-based method for the optimisation of waste collection
routes in Eastern Finland. They estimated an average route improvement in comparison
with the existing practice of about 12%. Moreover they proposed a combination of routing
and rescheduling optimisation. This combination in some cases introduced extremely
significant savings (~40%). They concluded that by allowing rescheduling it is possible to
significantly increase the improvement rate.
Karadimas & Loumos (2008) proposed a method for the estimation of municipal solid waste
generation, optimal waste collection and calculation of the optimal number of waste bins
and their allocation. This method uses a spatial Geodatabase, integrated in a GIS
environment and was tested in a part of the municipality of Athens, Greece. After the
reallocation of the waste bins, their total number was reduced by more than 30%. This
reduction had a direct positive impact on collection time and distance.
Chalkias & Lasaridi (2009) developed a model in ArcGIS Network Analyst in order to
improve the efficiency of waste collection and transport in the Municipality of Nikea,
Athens, Greece, via the reallocation of waste collection bins and the optimisation of vehicle
routing in terms of distance and time travelled. First results demonstrated that all the
examined scenarios provided savings compared to the existing empirical collection
organisation, in terms of both collection time (savings of 3.0% -17.0%) and travel distance
(savings of 5.5% - 12.5%).
Apaydin & Gonullu (2006) developed an integrated system with the combination of GIS and
GPS technology in order to optimise the routing of MSW collection in Trabzon city,
northeast Turkey. The comparison of the proposed optimised routes with the existing ones
revealed savings of 4–59% in terms of distance and 14-65% in terms of time, with a benefit of
24% in total cost.

Benefits from GIS Based Modelling for Municipal Solid Waste Management
423
Finally, Kanchanabhan et al. (2008) attempted to design and develop an appropriate storage,
collection and routing system for Tambaram Municipality in South Chennai, India using
GIS. The optimal routing was investigated, based on population density, waste generation
capacity, road network, storage bins and collection vehicles. They roughly estimated 30%
cost-savings with this approach.
4. The Nikea case study, in Greece
The total cost for waste collection and transport (WC&T) in Greece frequently accounts for
more than 70% of the total municipal solid waste (MSW) management costs. Thus, it is
crucial to improve the WC&T system through routing optimisation.
Here we present a general methodology for the optimisation of the waste collection and
transport system, based on GIS, technology for the municipality of Nikea (MoN), Athens,
Greece. This methodology was developed using standard GIS and network analysis
procedures in order to improve the efficiency of WC&T in the study area via: (a) the
reallocation of waste collection bins; and (b) the optimisation of vehicle routing in terms of
distance and time travelled, via GIS routing. The outputs of various different scenarios
examined are finally compared with the empirical routing, which is the current vehicle
routing practice. Benefits are assessed in terms of minimising collection time, distance
travelled and man-effort, and, consequently, financial and environmental costs of the
collection system.
In Greece Local Authorities (LAs) are by law responsible for waste management (Decrees
25/1975 and 429/1976). Waste collection and transport are provided at the individual
municipality level, usually directly through their Waste Management Department.
Currently, WC&T of commingled MSW in the country is responsible for a large portion of
the total waste management cost (70% - 100%), which is considerably higher than the typical
values, of between 50 and 75%, reported for modern waste management systems (Sonesson,
2000). This is observed because the largest fraction of the waste stream is currently landfilled
at very low cost, without pre-treatment for materials and/or energy recovery, while in some
cases illegal dumping may be still practiced (Lasaridi, 2009).
4.1 The study area and the existing collection system
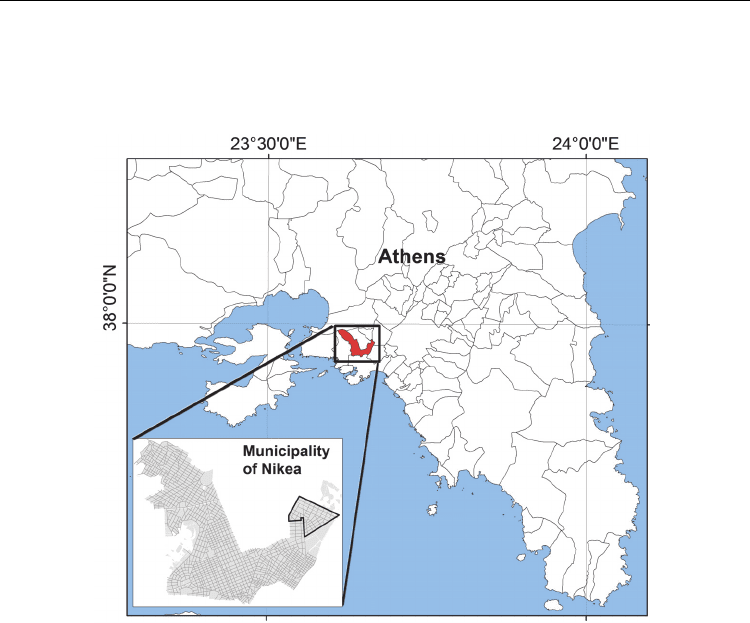
The MoN (Fig. 2) is one of the largest in the Attica Region, lying in the SW part of Athens
metropolitan area. It has a permanent population of 95,798 habitants according to the 2001
Census (National Statistical Service of Greece - NSSG, 2001) and a total area of 6.65 km
2
.
Nikea is a typical Greek urban municipality, characterised by multi-storey apartment
buildings, combined by lower multiple dwellings (2-4 apartments) and mixed residential
and commercial land uses in many neighbourhoods. The annual MSW production in MoN
is estimated at 45,625 tn, or 1.30 kg/ca/d.
Waste collection is carried out mechanically, using 12,107 wheelie bins and 17 rear-end
loaded compaction trucks with 9 tn average capacity. Most of the bins are small, of 120 and
240 L capacity, but a few larger ones exist in some central points. The total storage capacity
of the bin system is 3.4 million litres. The crew size on the collection vehicle is three persons,
a driver who never leaves the truck (as required by safety regulations) and two workers
who move and align the bins with the hydraulic lifting mechanism of the truck.
Nevertheless, due to traffic restrictions and narrow roads, it is estimated that only 70% of
the bins are really mechanically collected, with the content of the rest being manually
Integrated Waste Management – Volume I
424
transferred in other bins, by an extra worker walking ahead of the collection vehicle. The
Municipality is empirically divided into 15 sectors (collection zones), each of which is
further divided into two sub-sectors. Waste is collected in each sub-sector four times per
week.
Fig. 2. The study area: Municipality of Nikea, Athens, Greece.
This work applies the developed waste collection and transport optimisation methodology
in a typical sector (Sector 1) of the municipality with mainly residential land uses. However,
some commercial establishments, schools, stadiums and parks are also found in the area.
The served equivalent population in Sector 1 (i.e. taking into account the MSW load created
by non-residential land uses) is 6,790 people, divided in 63 parcels (building blocks). The
total average waste production is 2,610 ton/yr, according to the weighing sheets of the
collection vehicles in the period 2005-2007. This corresponds to an average daily
commingled waste production of 1.053 kg/ca eq. This is not in contrast with the
municipality average reported above, as the former is calculated on the basis of the 2001
census population, while the latter also takes into account the equivalent population
corresponding to the non-residential land uses.
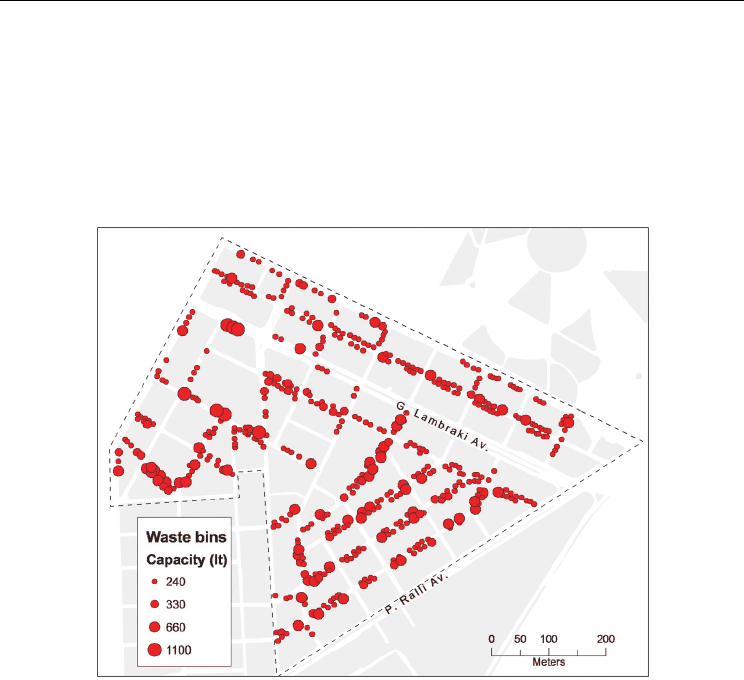
In the current waste collection system, 714 bins are located in Sector 1 (Fig.3), of which 501
are mechanically collected, with total capacity of 157,000 L. The content of the rest is
manually transferred to the mechanically collected ones by the extra worker mentioned
above. Since Sector 1 is rather flat (mean elevation ~ 50 m) it is assumed that fuel
consumption and emissions are linearly related to collection time (Brodrick et al., 2002).
For waste collection purposes Sector 1 is divided into two sub-sectors both served by one
waste collection vehicle. Waste in each sub-sector is collected four times per week, in
Benefits from GIS Based Modelling for Municipal Solid Waste Management
425
alternate week days, resulting into eight collection trips per week. Collected waste is
disposed of at the Fyli landfill site, about 25 km north-west from Sector 1. The key points to
the proposed optimisation approach are: a) the replacement of the existing large number of
small bins (120 and 240 L) with a reduced number of larger bins (1100 L); b) the
resectorisation; and finally, c) the optimal routing. Using the collected data and the
analytical tools of the GIS software, specific proposals are developed regarding the
optimisation of the existing WC&T system of commingled MSW. For results assessment
both the vehicle trip within the sector and travel to and from the landfill are considered.
Fig. 3. Waste bins in the study area.
4.2 Data collection and spatial database description
To efficiently manage the municipal solid waste system, detailed spatial information is
required. This information is related to the geographical background of the area under
investigation, as well as to spatial data related to the waste collection procedure. A large
amount of waste management data for the period 1998-2007 has been collected and
statistically analysed regarding the static and dynamic data of each existing collection
program: population density; waste generation rate for mixed waste and for specific waste
streams; number, type and positions of waste bins; the road network and the related traffic;
the current routing system of the collection vehicles; truck capacities and their
characteristics; and the geographic boarders and characteristics of the waste collection
sectors. The range of data acquired and utilised is illustrated in Table1.
For the optimisation of the collection process a spatial geodatabase was constructed, in a
standard commercial GIS environment (ArcGIS, ESRI). This choice ensures compatibility
with the available data from the municipality and access to many network analysis routines
available from the software. The content of the spatial database is summarised in Table 2.

Integrated Waste Management – Volume I
426
Background spatial data for road network, existing routes, bins and building parcels were
obtained from MoN. These data were updated with field work and other non spatial data
such as road name, road type, vehicle average speed, travel time, road slope, bin number,
bin type/capacity, bin collection time were added. Furthermore, special attributes of road
network were registered. These attributes include traffic rules, traffic marks, topological
conditions and special restrictions (e.g. turn restrictions) in order to efficiently model the
real world road network conditions.
Data Source
Study area boundary (MoN Corporation)
Detailed urban plan of the municipality (official toposheet plan)
Population density distribution (National Statistical Service of Greece: NSSG)
Land use of the study area (NSSG)
Satellite image of the municipality (Google Earth)
Road network of the study area (official toposheet plan, , field work)
Road class information: restrictions and
traffic volume details
(official toposheet plan, MoN Corporation,
field work)
Location of waste bins (MoN Corporation, field work)
Capacities of bins (MoN Corporation, field work)
Time schedule for the collection process (MoN Corporation, field work)
Existing collection routes (MoN Corporation, field work)
Vehicle speed, fuel consumption, CO
2
and
other gas emissions of the compactors
(MoN Corporation, field work, literature).
Table 1. Data collected and their source.
Spatial Data Type Geometry
Road network vector Line
Waste bins vector Point
Urban plan / parcels vector Polygon
Existing run routes vector Line
Street address tabular -
Road network attributes / restrictions tabular -
Waste bins’ attributes tabular -
Population data tabular (join with parcels)
Land use data tabular -
Satellite image of the MoN Raster -
Table 2. The spatial database - type of data and corresponding geometry.
4.3 Methodology
The key point of the proposed analysis is GIS technology. GIS provides a powerful context
to import, manage and analyse spatially based data. The methodology implemented in this
study comprised of three general steps (Fig. 4). Step 1 establishes the spatial database of the
study area as described previously. Step 2 is dedicated on the reallocation of waste
collection bins with the use of GIS spatial analysis functions. Finally, Step 3 consists of the
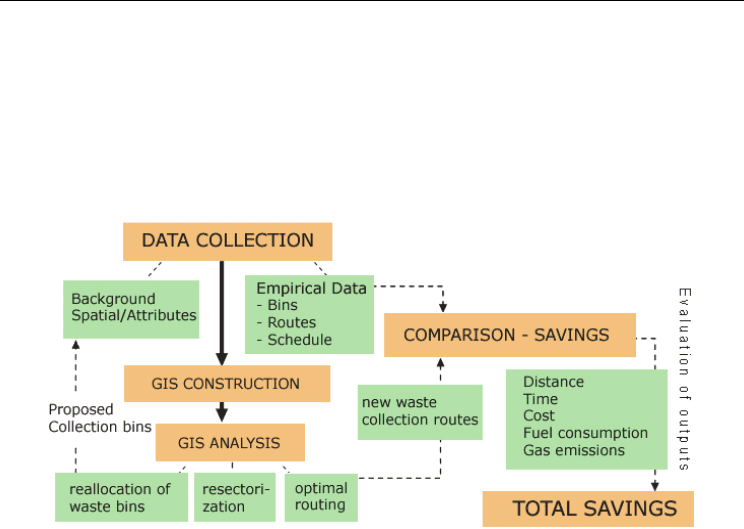
Benefits from GIS Based Modelling for Municipal Solid Waste Management
427
waste collection routing optimisation for minimum time, distance, fuel consumption and
gas emissions. The waste collection optimisation model was developed with the use of
ArcGIS 9.2 Network Analyst (NA) GIS software.
To analyse the spatial data for the optimisation of the waste collection scheme in MoN, a
spatial database (SDB), within a GIS framework, was constructed, as previously described,
using: (a) analogue maps from MoN; (b) digital data from various official providers (e.g.
National Statistical Service); (c) data derived from field work /on-site data capture with the
use of GPS technology.
Fig. 4. Data flow of the proposed methodology
4.3.1 Reallocation of waste collection bins and resectorisation
The next phase of the proposed methodology is related to the reallocation of waste
collection bins. This analysis was implemented in a GIS environment with the use of the
proper spatial analysis functions. The allocation of waste collection bins in their newly
proposed locations was based on the following criteria /restrictions:
i. On the basis of the population density and the type of buildings in the study area, bins
of 1100L capacity were considered preferable, in order to minimise the number of
required bins and vehicle stops. This is the typical bin type used in most Municipalities
in the wider Athens area.
ii. The required number of bins (N) was calculated to cover the waste production of the
sector for a five trips per week schedule (D=7/5), assuming a waste density in the bin of
ρ=110 kg.m
-3
, and a coefficient of filling the bin, ε = 0.80 of its capacity, according to the
equation (1):
D
N W x D / V x x
(1)
where WD (kg) is the daily waste quantity and V (m
3
) is the bin capacity. A 10% safety
margin was added to this number (Panagiotakopoulos, 2002).
Thus, instead of the existing 501 bins of various sizes (§2.2) Sector 1 is covered by 142
large bins (1100L).
iii.
Next, these bins are allocated in the study area according to the following rules: a)
allocate bins on the road network (intersections are preferable); b) install proposed bins
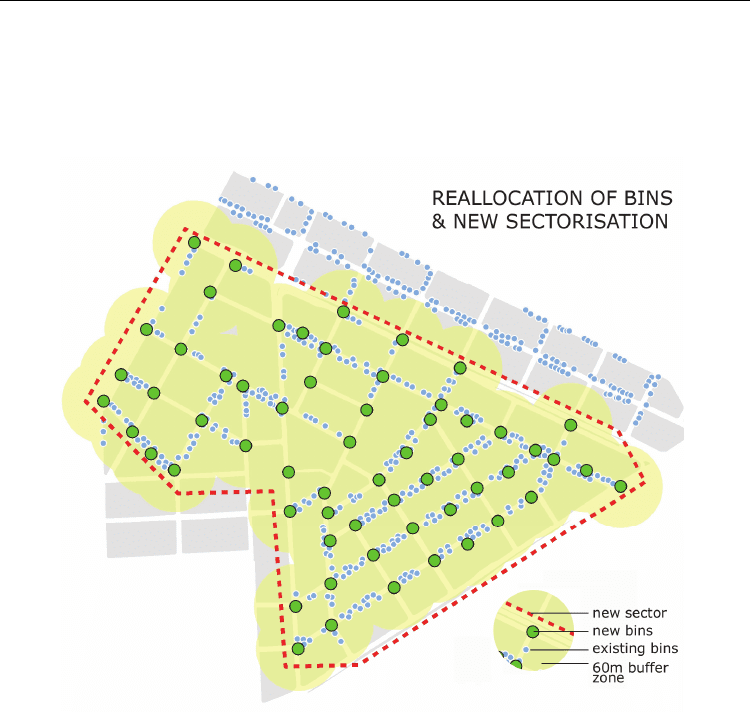
Integrated Waste Management – Volume I
428
near an existing bin location (in a buffer zone of 60 m radius); and, c) allow the
placement of more than one bin in the same intersection. The number of bins sharing
the same intersection point is related to the land use and population of the covered
area.
Figure 5 illustrates the proposed reallocation of waste bins in the sector under investigation.
Fig. 5. Reallocation of waste collection bins in the new sector
The definition of the new sectors is restricted by the capacity of the available waste
collection vehicles. Thus, the size (in terms of the number of bins) of a new sector was
estimated at the 2/3 of the existing sector. Therefore, instead of 4 routes per week for each of
the two subsectors (total: 8 routes per week) we designed smaller sectors and schedule 5
routes per week in these new sectors.
As a result of the above mentioned approach, each new sector should contain 95 bins, which
can be collected in one vehicle trip. The reallocation of bins was based on travel distance
from each residence to the nearest bin and the general intention to decrease the total number
of bins. A maximum travel distance of 60 meters from each resident to the proposed new
site of the bin was allowed. Moreover, the introduction of new bins with larger capacity, to
accommodate for the same waste quantity, ensures the decrease in the total number of bins
and collection stops. A higher priority for the allocation of the new bins was given to
locations of bins in the existing system and to crossroads in order to facilitate social
acceptance and collection vehicle travel.
Benefits from GIS Based Modelling for Municipal Solid Waste Management
429
Summarising, we assume a new waste collection planning: the MoN is divided into 22 new
sectors and each collection vehicle should make 5 collections per week in each of these
sectors. Thus we propose an improved collection schedule for the study area, as the vehicle
collects each bin 5 times per week instead of 4, according to the existing situation. For this
study we did not proceed to the full re-sectorisation for the total area of the municipality,
but limited our approach within Sector1. Thus, we assumed a new sector (Sector_N1) within
Sector1, with the properties described above (2/3 of the size of Sector 1, 5 collections per
week). The evaluation of the results of the proposed modelling approach was based on the
comparison between Sector_N1 and corresponding part of Sector1.
4.3.2 Routing – Network Analysis
After the reallocation of the waste collection bins and the definition of Sector_N1 the
optimisation of waste collection vehicle routing was performed, using the ArcGIS Network
Analyst modelling package. The optimal path finding algorithm of NA is an alteration of the
classic Dijkstra's algorithm (Dijkstra, 1959) which solves the problem of optimal route
selection on an undirected, nonnegative weighted graph in a reasonable computational
time.
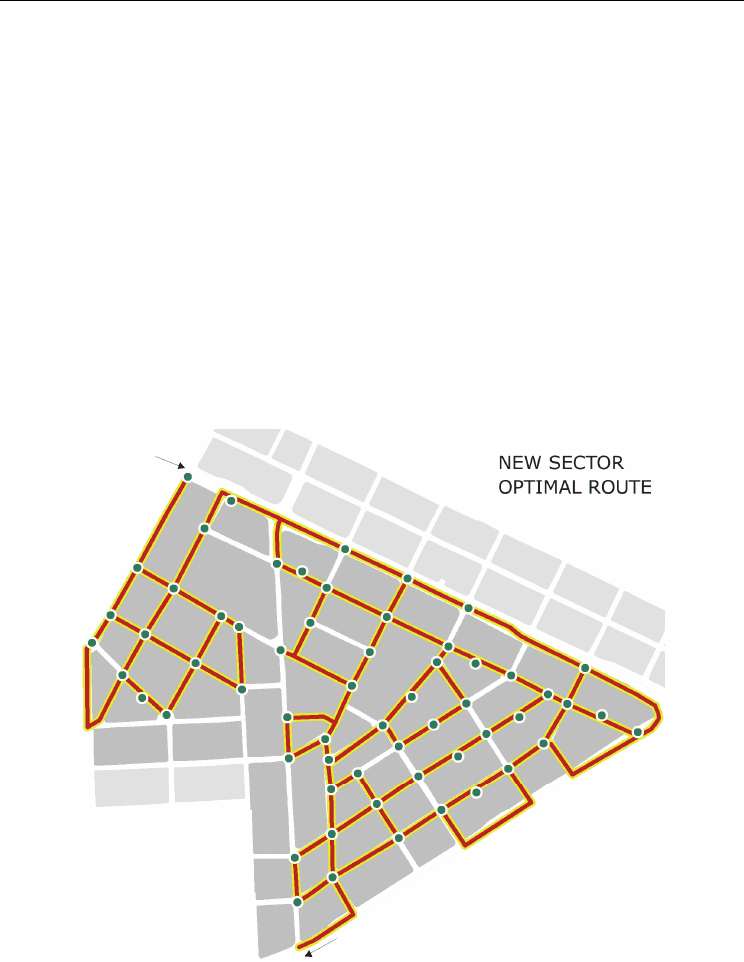
Fig. 6. Optimal waste collection route.
In the literature, many modifications and new algorithms have been used for the
incorporation of the aforementioned restrictions. In the context of ArcGIS Network Analyst
commercial GIS software, this algorithm is improved further, using effective data structures

Integrated Waste Management – Volume I
430
such as d-heaps (ESRI, 2006). To use it within the context of real transportation data, this
algorithm must be modified in order to respect real problem restrictions, such as one-way
roads, prohibited turns (e.g. U-turns), demand at intersections (nodes) and along the roads,
and side-of-street constraints while minimising a user-specified cost attribute. The key point
is to build a cost matrix containing the costs between origins and destinations. These points
correspond to pairs of vehicle stops (waste bins).
The total vehicle travel time is the sum of the travel time for each road segment plus the
collection time for emptying of the bins. The user can define all the relevant traffic
restrictions described above, the time delay for each stop for bin collection, as well as the
first and last collection stop within the sector. The final output is the optimal solution in
terms of distance or time criteria (fig. 6).
4.4 Results and discussion
The method described above was applied to simulate the waste collection procedure of the
study area. Based on the methodology presented in the previous sections and the criteria
and restrictions introduced in ArcGIS Network Analyst, different routing solutions were
created for the collection of the new bins (95 bins of 1100 L) in their new location within
Sector_N1. Evaluation of the results of the developed methodology is based on the
comparison of the proposed waste collection scenario (Sp) with the existing one (Se). The
time needed during waste collection has three distinct components: 1) time for hauling;
(assumed as 25+25 km with average speed 50 km/h); 2) time for driving during collection;
and, 3) time for emptying the bins.
The parameters input to the model were based on real data provided by the MoN and verified
by field studies. More specifically, the time for emptying of the bins (bin loading, emptying
and unloading – component 3) is 30 sec for bins with capacity up to 330 L and 60sec for bins
with capacity equal to or larger than 660 L. The time for driving during collection (component
2) is determined by the average speed of the collection vehicle in the travel between stops and
the total distance travelled in the collection segment of the route. For MoN the average speed
is 5, 10 and 15 km/hr for 1-way, 2-way and central roads, respectively.
Both parameters are not readily available and default literature values are scarce. Sonesson
(2000) reports values for the time required for bin emptying from empirical data for the
wider Uppsala area in Sweden, as follows: 68.4 sec for inner city, 43.2 sec for suburbia and
57.4 sec for rural areas. Although the bin size is not defined, these values are in good
agreement with the observed figures in the MoN. The author also reports an average
collection speed of 20, 30 and 50 km/h for inner city, suburbs and rural areas, respectively.
This is higher than the values achieved in MoN (conditions comparable with the inner city
in Uppsala). Possible explanation is twofold: 1) different conditions of the road network and
traffic in the two cities; and, 2) a denser matrix of collection points, due to a higher
population density, allowing for shorter distances travelled between collection points and
therefore lower speed. Nevertheless, the vehicle speed used for central roads in Nikea (15
km/h) compares well with the inner city collection speed in Uppsala (20 km/h).
The comparison of results, on a weekly basis, between the existing collection scenario (Se)
and the proposed one (Sp) is illustrated in Table 3. The optimal solution expressed in
Scenario Sp (Fig. 6) corresponds to 287 km of distance travelled by the waste collection
vehicle on a weekly basis. This provides a 3% improvement when compared to the existing
equivalent empirical route (Se). The improvement is more significant if assessed in terms of
the total travel time in the optimal route, defined as the runtime of the collection vehicle