Kim Y.J. (Ed.) Advanced Environmental Monitoring
Подождите немного. Документ загружается.

122 Y. Iwasaka et al.
total mass of mineral dust transported by westerly from the Taklamakan desert to
downwind will be about 1.4 × 10
7
ton/year. From those values it is suggested that
background Asian dust transported from the Taklamakan desert is very important
and more investigations are desired to clarify the effect of the background Asian
dust to environment and climate in east Asia and west Pacific regions.
Keywords: Background Asian dust, background KOSA, balloon-borne measure-
ment, mass flux of Asian dust particle
9.1 Introduction
Asian dust layers with the peak height of about 4–6 km and layer thickness of about
0.5–2 km were frequently detected in Japan, Korea, and China by lidar (e.g., Iwasaka
et al. 1988; Kwon et al. 1997; Sakai et al. 2000; Murayama et al. 2001). Those Asian
dust events have been called background KOSA (or weak KOSA) since meteorologi-
cal observatories give no report of dust and few typical dust storms are identified in
arid and/or semi-arid regions of China and Mongolia. Additionally it is hardly possi-
ble to detect such types of dust events through satellite imaging.
Recently aircraft-borne measurements were made to understand the nature of
background KOSA (Mori et al. 1999; Trochkine et al. 2002; Matsuki et al. 2002,
2003) since it is hardly possible, from lidar measurements, to know the mixing state
of KOSA particles and other types of aerosols such as sea salt, sulfate particles and
others, and consequently we cannot estimate mass concentration and/or mass flux
of background KOSA.
It has been believed for a long time that the effect of the Asian continental air
becomes extremely small in Japan, Korea, and east coast of China in summer since
the global air-circulation pattern and land surface vegetation largely change in sum-
mer in the Asian-Pacific region. However, this is speculative since there have been
few observations of long-range transport of atmospheric constituents in the free trop-
osphere owing to technical difficulty. Matsuki et al. (2003) suggested that the effect
of Pacific high is very strong below about 4 km over Japan islands but not above
about 4-km altitude even in summer, and that major particles were mineral dust par-
ticles in coarse mode above about 4 km even in summer since westerly winds actively
transports atmospheric constituents including KOSA particles in the free
troposphere.
Iwasaka et al. (2004) suggested, on the basis of lidar measurements made at
Dunhuang, China, the Taklamakan desert as a possible pool which can flow out
Asian background dust in every season. Both mountain-valley winds and westerly
above about 5 km were suggested as important system transporting background
Asian dust from the Taklamakan desert to down wind (Iwasaka et al. 2003b and
2004). However it is hardly possible, as mentioned above, to estimate quantitatively
outflow rate or mass flux of dust particles from their lidar measurements.
9 Mass Transport of Background Asian Dust Revealed by Balloon-Borne Measurement 123
In 2004, balloon-borne measurements have been made, following the balloon
and lidar measurements in 2001–2003, at Dunhuang (40°00′ N, 94°30′ E), China to
understand the mass flux of dust particles supplied in to the atmosphere from the
Taklamakan desert under calm weather conditions. The observations showed that
lots of dust particles diffused up to the free troposphere (∼5 km) and were
transported out by westerly over the Taklamakan desert (here we called it Asian
background dust and distinguish it from the Asian dust caused by cyclone in the
Asian continent). Here we showed how to measure and to estimate the mass
of background Asian dust and discussed possible importance of contribution of
background dust in mass budget in Asia-Pacific regions.
9.2 Mass Flux of Dust Due to Westerly over Taklamakan Desert
9.2.1 Balloon-Borne OPC to Measure Aerosol Size
and Concentration
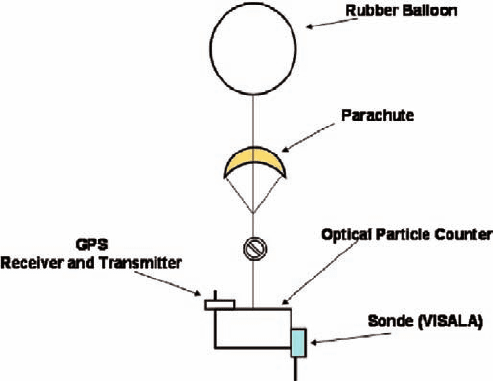
Figure 9.1 shows the balloon train (configuration of instruments) to measure aer-
osol size and number concentration with balloon-borne optical particle counter
(OPC). The detailed specification of the balloon-borne OPC was described
already (e.g., Hayashi et al. 1998) and we shortly described the outline of it here.
We used the forward scattering effect of particles to measure particle size and
number concentration, and the OPC contained semi-conductor laser as light
source and photodiode as detector of scattering light from the aerosols. The
Fig. 9.1 Balloon train to measure aerosol number concentration and size by balloon-borne optical
particle counter
124 Y. Iwasaka et al.
output signals from the detector were transferred by radio wave with wavelength
of 400 MHz. Particle sizing was made at particle diameters of 0.3, 0.5, 0.8, 1.2
and 3.6 µm, and modified those to diameters of 0.3, 0.5, 0.8, 1.2, 2.0, 3.0, 5.0 and
7.0 µm in measurements on October 24, 2004 to obtain more detailed number-
size distributions.
9.2.2 Observation of Wind Speed and Direction
The receiving antenna of GPS (geographical positioning system) signal and
transmitter which transfers the signal to the balloon launching site was mounted
on the balloon to monitor the balloon position during the flight of the balloon.
Wind speeds and directions were estimated from analysis of the balloon
trajectories.
9.2.3 Atmospheric Temperature and Humidity
Atmospheric temperature and humidity were monitored by meteorological radio
sonde of VISALA Co. Ltd. and those signals also were transferred by radio with
wavelength of 400 MHz. The humidity sensor, according to VISALA Go. Ltd., can
not work properly under the atmospheric temperatures lower than 213 K (−60°C), and
therefore the values of relative humidity shown in Fig. 9.2 have some uncertainties
above 13 km.
9.2.4 Measurements Under Calm Weather Condition
The balloon-borne measurements were made under the calm weather conditions;
wind speeds lower than 2 m/s near the ground and cloudiness lower than 1/8,
and therefore the observed results can be recognized as ones showing back-
ground levels. The local meteorological observatory gave no reports of dust
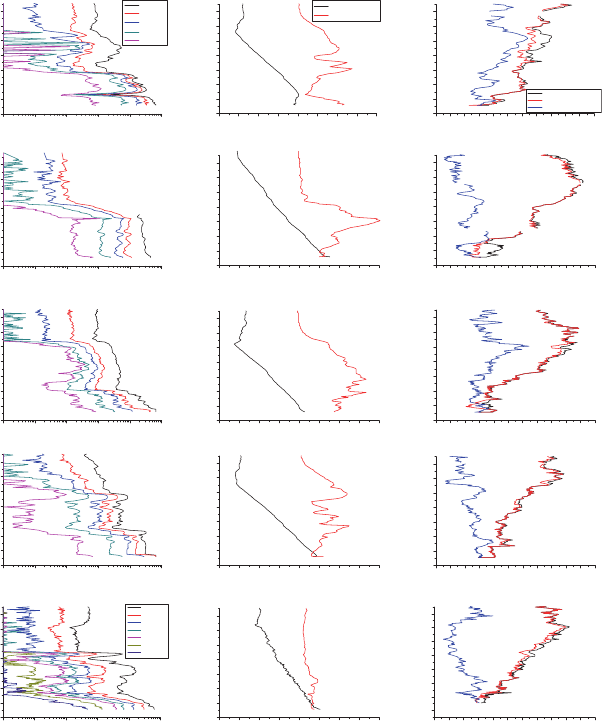
storm. Figure. 9.2 shows aerosol number and size distributions, atmospheric
temperatures, and wind speeds over Dunhuang (40°00′ N, 94°30′ E), China on
January 11, 2002; August 27, 2002; February 24, 2003; March 24, 2003 and
October 24, 2004.
The particle concentrations were high near the ground and gradually decreased
according to increase of height, but many peaks of aerosol layer were identified and
corresponded well to temperature inversion and humidity changes. Roughly speaking
the coarse particles with their radius larger than 1.2 µm seem to be well mixed from
near the boundary to about 5 km and westerly wind dominated above about 5 km.
Those features are found also in the measurements made on other days (August 17,
9 Mass Transport of Background Asian Dust Revealed by Balloon-Borne Measurement 125
2001; October 17, 2001; April 30, 2002; and March 22, 2004, those measurements
were made without GPS signal detection and are not shown here and available to
see in Kim et al. 2003 and Iwasaka et al. 2003b)
0
2000
4000
6000
8000
10000
12000
14000
1E-3 0.01 0.1 1 10 100
1E-3 0.01 0.1 1 10 100
OPC 2002/8/27
Number Conc. cm
−3
Number Conc. cm
−3
1E-3 0.01 0.1 1 10 100
Number Conc. cm
−3
1E-3 0.01 0.1 1 10 100
Number Conc. cm
−3
Altitude (m)
0
2000
4000
6000
8000
10000
12000
14000
Altitude (m)
0
2000
4000
6000
8000
10000
12000
14000
Altitude (m)
0
2000
4000
6000
8000
10000
12000
14000
Altitude (m)
0
2000
4000
6000
8000
10000
12000
14000
2004/10/24
Altitude (m)
>0.3µm
>0.5µm
>0.8µm
>1.2µm
>2.0µm
>3.0µm
>5.0µm
OPC 2004/10/24
0
0
0
0
0
0
0
2004/10/24
2003/3/24
2003/3/24
OPC 2003/3/24
2003/2/24
2003/2/24
OPC 2003/2/24
0
2000
4000
6000
8000
10000
12000
14000
−60 −40 −20 0 20 40 60 80 100 120 140 160
−60 −40 −20 0 20 40 60 80 100 120 140 160
−60 −40 −20 0 20 40 60 80 100 120 140 160
−60 −40 −20 0 20 40 60 80 100 120 140 160
Altitude (m)
0
2000
4000
6000
8000
10000
12000
14000
Altitude (m)
0
2000
4000
6000
8000
10000
12000
14000
Altitude (m)
2002/8/27
0
2000
4000
6000
8000
10000
12000
14000
−80 −60 −40 −20 0 20 40 60 80
−80 −60 −40 −20 0 20 40 60 80
−80 −60 −40 −20 0 20 40 60 80
−80 −60 −40 −20 0 20 40 60 80
Altitude (m)
0
2000
4000
6000
8000
10000
12000
14000
Altitude (m)
0
2000
4000
6000
8000
10000
12000
14000
Altitude (m)
0
2000
4000
6000
8000
10000
12000
14000
Altitude (m)
2002/8/27
0
2000
4000
6000
8000
10000
12000
14000
−80 −60 −40 −200 20406080
Altitude (m)
Temp (degree)
RH (%)
2002/1/11
0
2000
4000
6000
8000
10000
12000
14000
−60 −40 −20 0 20 40 60 80 100 120 140 160
Altitude (m)
Wind speed (km/h)
U-wind (km/h)
V-wind (km/h)
2002/1/11
0
2000
4000
6000
8000
10000
12000
14000
1E-3 0.01 0.1 1 10 100
Number Conc. cm
−3
Altitude (m)
>0.3µm
>0.5µm
>0.8µm
>1.2µm
>3.6µm
OPC 2002/1/11
Fig. 9.2 Vertical profile of number-size distribution (cm
−3
), Atmospheric temperature (°C),
Relative Humidity (%), Wind speed (km/h), U-wind speed (km/h) and V-wind speed (km/h) on
January 11, 2002, August 27, 2002, February 24, 2003, March 24, 2003 and October 24, 2004.
U-wind represent the longitudinal components of wind, positive values in U-wind indicate
westerly flows. V-wind represent the latitudinal components of wind, positive values in V-wind
indicate northerly flows
126 Y. Iwasaka et al.
The wind, here, is divided to two components: U-wind and V-wind. U-wind and
V-wind refer to the longitudinal component (positive values indicate westerly) and
latitudinal component (positive values indicate northerly flows) of winds, respectively.
9.3 Mass Flux of Background Asian Dust Transported
by Westerly over Taklamakan Desert
Iwasaka et al. (2003a) and Yamada et al. (2005), on the basis of chemical element
analysis and observation of morphology of the particles collected with the balloon-
borne impactor during the campaign of balloon-borne measurements made at
Dunhuang, China corresponding to the balloon-borne OPC measurements, showed
that dust particles dominated in the coarse mode size in the free troposphere over the
Taklamakan desert (for example; 86% in August 29, 2002 and 99% in March 24,
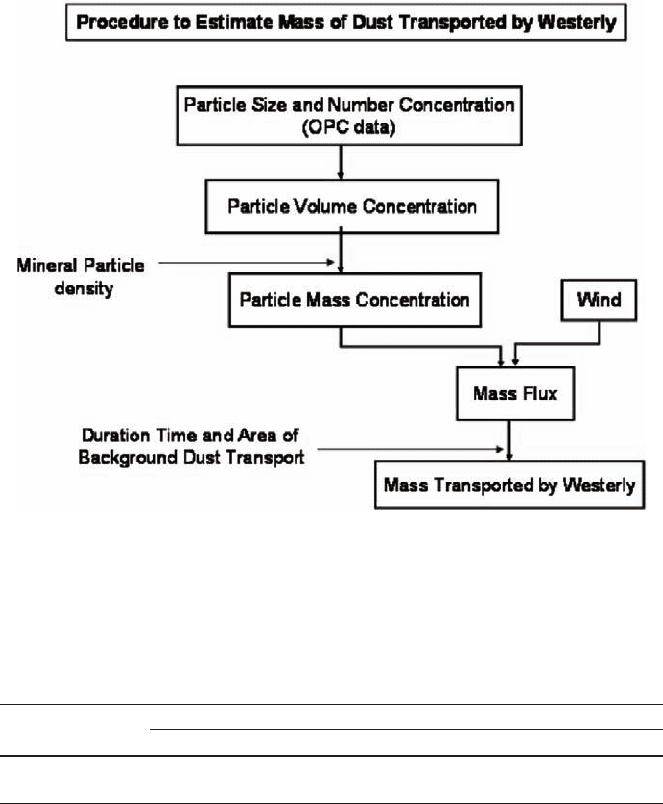
2003). Therefore we, according to the analytical procedure presented by Trochkine
et al. (2002) and Matsuki et al. (2002), estimated mass flux of dust due to dominating
westerly in the free troposphere over the Taklamakan desert from the particle size and
number concentrations, and winds observed with the OPC sonde assuming that
coarse mode particles are mostly composed of dust particles (Fig. 9.3).
We first estimate volume concentration with equation (1) on the assumption
that the shape of coarse mode particles (certainly dust particles) was oval having
long axis a and short axis b (Okada et al. 2001) in order to confirm quantitatively
that coarse mode particles were dominant in volume (and mass) concentration of
particulate matter. V
j
, the volume concentration of aerosol (cm
3
/cm
3
) in altitude
layer j,
Vabnrj
jiiii
= (4/3)
2
p
()
∑
(1)
where, r
i
is the geometric mean radius of the i
th
size-bin, n(r
i
)
j
is the number con-
centration of particles within in layer j, and j is the layer number. The values of a,
b, and r have the following relations (Okada et al. 2001),
ab r
ii i
×=,
(2)
and
1.4 : 1ab: =
(3)
As shown in Table 9.1, the total volume percentage of large particles (diameter >
1.2 µm) ranged from 88.2% to 94.6% in the height region of 2–10 km, and it is
strongly suggested that mass of the particulate matter is largely dependent on
coarse mode particle mass and possible to neglect contribution of the fine particles
to total mass of particulate matter.
Multiplying the volume concentration at j-layer by the density of mineral dust,
we can obtain the mass concentration of aerosol particle (g/cm
3
) at the j-layer, C
j
,
9 Mass Transport of Background Asian Dust Revealed by Balloon-Borne Measurement 127
Fig. 9.3 Mass of background Asian dust transported by westerly wind is evaluated on the basis
of measurements of aerosol size and number concentrations. Mineral particle density (or external
mixing ratio of dust particles) is deduced from analysis of particulate matter collected in the free
troposphere
MV
jj
=×
r
,
(4)
where r is the density of mineral and 2.6 g/cm
3
was assumed (Ishizaka and Ono
1982). From the wind speeds and directions at j-layer, we can estimate mass flux
over the Taklamakan desert area from the following relation,
FMWind
jj j
=× ,
(5)
Table 9.1 Volume percentage of large particles
Date
Size range Jan 11, 2002 Aug 27, 2002 Feb 24, 2003 Mar 24, 3003 Oct 24, 2004
Diameter > 0.8 µm 98.5% 93.3% 97.3% 95.5% 96.0%
Diameter > 1.2 µm 94.6% 88.2% 94.5% 86.9% 92.2%

128 Y. Iwasaka et al.
As described before, we focus on mass of dust particles transported long-range by
westerly. Equation (3) was modified to equation (4) to obtain the mass flux due to
the westerly, F
j
westerly,
FM
jj
westerly [westerly component of Wind ]
j
=×
(6)
9.4 Results and Discussion
It is suggested, from intensive observations of dust particles from the Taklamakan
desert, that the geomorphological feature of the Talim basin and local wind systems
on the Taklamakan desert were important factors causing background Asian
dust (Iwasaka et al. 2003b, 2004). Therefore it is of interest to discuss mass of
the Asian background dust transported by westerly from the Taklamakan desert
to downwind.
9.4.1 Mass Concentration Obtained from the Balloon-Borne
Measurements in the Free Troposphere
The mass concentrations of mineral dust estimated on the basis of equations (1) and
(2) are listed in Table 9.2. High values were frequently observed in the ground
atmosphere (1–2 km), and interestingly relatively high concentrations (50 µg/m
3
or
larger than it) were frequently detected above about 2 km. Most of the observations
showed that mass concentration rapidly decreased above about 5 km, and strongly
Table 9.2 Mass concentration in the height region where westerly wind dominated (µg/m
3
)
Date
Jan 11, Aug 27, Feb 24, Mar 24, Oct 24,
Height 2002 2002 2003 2003 2004 Average
4–5 169.8 59.8 10.4 24.2 3.1 53.5
5–6 71.4 60.0 28.7 3.5 3.6 33.4
6–7 1.0 80.9 41.0 4.9 3.8 26.3
7–8 0.8 10.0 71.0 4.8 0.8 17.5
8–9 3.8 * 32.4 4.4 0.8 10.4
9–10 7.4 * 29.3 20.4 0.0 14.3
10–11 0.3 * 3.6 6.3 0.0 2.6
11–12 0.4 * 0.1 0.9 0.0 0.4
12–13 0.1 * 0.1 0.1 0.0 0.1
13–14 0.1 * 0.1 0.1 0.1 0.1
14–15 0.1 * 0.1 0.1 0.1 0.1
* The values were not estimated since measurements of number concentration of the particles with
D > 0.3 µm were not good
9 Mass Transport of Background Asian Dust Revealed by Balloon-Borne Measurement 129
confirmed suggestion that dust particles were actively removed by westerly winds
whose speeds increased above about 5 km (Iwasaka et al. 2003b, 2004).
Iwasaka et al. (1988), from lidar measurements at Japan, estimated total mass
loading of weak KOSA centered around the altitude of 300 K potential temperature
(1.5–4.5 km) as 1.9–25 µg/m
3
assuming that most of the particles were composed
of dust particles and size distribution of particulate matter at those heights was the
same with the measurements made near the ground. Therefore this value contained
some uncertainties. Trochkine et al. (2002), from aircraft borne measurements over
Japan islands, showed dust particle load of 2.3–2.6 µg/m
3
in the altitudes of 3–5 km
and suggested importance of long-range transport of dust particles in the free tropo-
sphere during calm weather periods.
Taking into consideration that background dust concentrations possibly decrease
during long-range transport from the source area to down wind through gravitational
deposition and others, the concentration of background KOSA observed over Japan
islands is expected to be lower than the values obtained over the Taklamakan desert.
9.4.2 Horizontal Mass Flux Estimated From the Balloon-Borne
Measurements
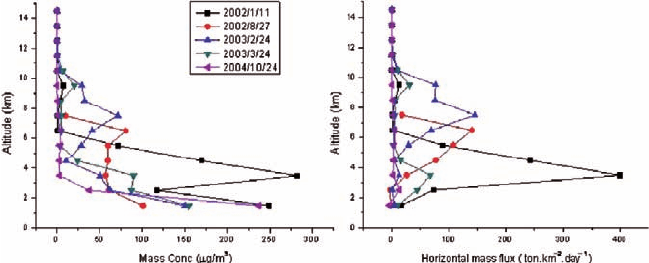
Figure 9.4 shows the vertical profile of horizontal mass fluxes by westerly winds
estimated from the values in Fig 9.2 with equations (1), (2) and (3). Most of the
profiles suggested active transport of dust in the region where westerly dominated,
but fluxes were found to be extremely low on October 24, 2004 compared with
other values possibly due to appearance of very stable atmosphere. The lapse rate
of temperature is obviously less than the dry adiabatic lapse rate just above the
Fig. 9.4 Vertical profile of estimated mass concentration (µg/m
3
) and horizontal mass flux (ton/
km
2
/day) on January 11, 2002; April 30, 2002; August 27, 2002; February 24, 2003; March 24,
2003 and October 24, 2004

130 Y. Iwasaka et al.
ground, and the relative humidity was quite low (<25%). Under the very stable
atmospheric conditions, vertical mixing of dust particles becomes very low and
supply of dust particles to the regions above about 5 km will be depressed.
The vertical distribution of minimum, average and maximum horizontal mass
fluxes of dust are summarized in Table 9.3, showing that the average horizontal
mass flux was about in the range of 44.0–68.7 ton/km
2
/day in the region of 4–7 km
where westerly winds are strong and transport actively dust particles diffusing up
from the ground surface of the desert.
It can be strongly suggested, from large horizontal mass flux in the free tropo-
sphere shown in Fig. 9.4 and Table 9.3, that mineral dust are effectively transported
long-range to downwind by westerly wind in the troposphere, especially on the
surface of about 300 K potential temperature, over the Taklamakan desert.
Iwasaka et al. (1988) and Matsuki et al. (2002) stressed the important contribu-
tion of background KOSA to biogeochemical cycle of metals and atmospheric
constituents in east Asia–west Pacific region since their mass flux in the free tropo-
sphere is not negligible comparing with the values of severe KOSA. Matsuki et al.
(2002), on the basis of aircraft borne measurements during the days without dust
storm episode, estimated the horizontal fluxes due to westerly wind to be in the
range of 0.2–7 ton/km
2
/day in 2–6 km over Nagoya, Japan. As described before,
various deposition and dilution processes are expected during long-range transport
of dust, and therefore the difference between the values of both regions possibly
suggested those removal and dilution processes.
Zhao et al. (2003), from their model simulations of dust transports in spring of
2001, estimated the horizontal mass fluxes in spring to be in the range of 0.06–
2.9 ton/km
2
/day over the Sea of Japan and in the range of 0.06–0.35 ton/km
2
/day
over the North Pacific. It is reported that nearly 20 sandstorm events happened in
2001 spring, at China, and their results can be recognized as examples showing
effect of severe KOSA events.
In Table 9.4, the horizontal mass flux estimated here is compared with those
obtained over the Sea of Japan, Japan and North Pacific Ocean. In this study,
average fluxes during five observations were in the range of 30–68 ton/km
−2
/day
at heights of 4–10 km (Table 9.3). The comparison is made on the basis of very
limited measurements and model calculations but possible important contribution
of background Asian dust is strongly suggested.
Table 9.3 Average, maximum and minimum horizontal mass fluxes of dust (Unit: ton/km
2
/day)
Height (km)
Flux 4–5 5–6 6–7 7–8 8–9 9–10 10–11 11–12 12–13 13–14 14–15
Average flux 68.7 46.8 44.0 34.3 22.0 30.4 5.3 0.8 0.3 0.2 0.1
Maximum 242.8 108.1 140.2 145.3 75.8 77.1 10.7 2.1 0.4 0.3 0.1
Minimum 3.0 2.5 1.4 1.2 1.3 0.1 0.1 0.1 0.1 0.1 0.1

9 Mass Transport of Background Asian Dust Revealed by Balloon-Borne Measurement 131
9.4.3 Importance of Mass of Dust Particles Transported
Under Calm Weather Conditions
As described before, horizontal mass flux of dust particles by westerly winds is
very large in the free troposphere and it is expected that lots of dust particles are
transported by westerly to downwind. The mass transported by westerly winds is
given by following relation (Fig. 9.5),
Mass = F (horizontal flux) × cross section of the region where westerly
is dominant × Duration time (7)
where mass flux by westerly winds was already defined by equation (6) and
duration time means the time when background dust is transported by westerly
winds in calm weather over the Taklamakan desert.
Mass of the dust transported by westerly winds as background dust is roughly
estimated to be about 1.4 × 10
7
ton/year assuming that flux is 5.78 × 10
2
tons/km
2
/
day averaging values of 4–5 and 5–6 km in Table 9.3, cross section 800 km
2
consid-
ering approximately area of 2 km (height) × 400 km (length in south–north direc-
tion), and duration time of 300 days a year.
This value, if westerly wind transports most of the particles which diffuse up
to about 5 km from the ground, can be considered as mass of particles which are
supplied into the atmosphere and transported long-range as background dust from
the Taklamakan desert. The emission of background dust per unit surface area is
estimated to be about 4.4 × 10 ton/km
2
/year assuming about 3.2 × 10
5
km
2
of the
surface of Taklamakan desert (emission of background Asian dust). Iwasaka
Table 9.4 Horizontal mass fluxes of dust particles: Comparison with other investigations
References Present study Zhao et al. 2003
Matsuki et al.
2002 Zhao et al. 2003
Site Dunhuang,
China
Japan Sea
(40°N, 130°E)
Nagoya, Japan North Pacific Ocean
(42°N, 140°W)
Condition Calm weather Spring Spring (Calm
weather)
Spring
Method Balloon-borne
measure-
ment
NARCM (Northern
aerosol regional
climate model)
Aircraft
observation
NARCM (Northern
aerosol regional
climate model)
Altitude (km) 4–10 1–10 2–6 1–10
Flux (ton/
km
2
/day)
30–68
(Average
value)
0.06–2.9 (5–250 µg/
m
2
/s)
0.2–7 0.06–0.35 (5–30 µg/
m
2
/s)