Kamimura H., Ushio H., Matsuno S., Hamada T.Theory of Copper Oxide Superconductors
Подождите немного. Документ загружается.

12 2 Experimental Results of High Temperature Superconducting Cuprates
amount of experiments have been performed. Here we concentrate on de-
scribing just a few of them which are closely related to the topics of this
book.
2.2.1 The Phase Diagram of Cuprates
As we have just mentioned, we can vary the hole concentrations of super-
conducting cuprates by the substitution of metallic atoms, by adding excess
oxygen atoms or by reducing oxygen atoms. The range of the hole concen-
tration, which can be realized by the above-mentioned methods, varies with
matrix materials, but it is widely believed that all cuprates have the same
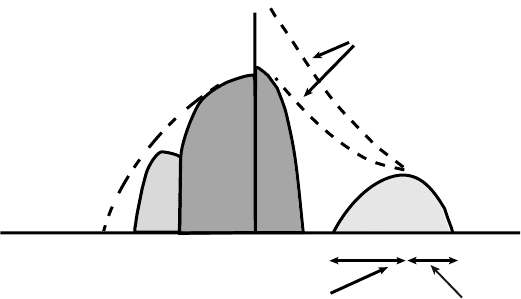
phase diagram schematically shown in Fig. 2.3.
SC
SC
T
electron-doped system
hole-doped system
Normal Metal
Normal Metal
hole concentration x
x
opt
underdoped
overdoped
“pseudogap” transition
3D AF
SC
low-energy pseudogap
high-energy pseudogap
Fig. 2.3. Phase diagram of cuprates. The dash lines in the electron-doped system
represent the electron-doping concentration dependence of the N´eel temperature
T
N
when oxygen is not reduced
Let us first discuss the phase diagram of hole-doped materials. When the
hole concentration x is very small, there exists a static three-dimensional
(3D) antiferromagnetic (AF) N´eel order. Upon doping, this AF-structure is
destroyed rapidly and vanishes at about x ∼ 0.05 for LSCO, and simulta-
neously superconductivity (SC) appears. By further doping, the supercon-
ducting transition temperature T
c
rises but it reaches a maximum value at
the concentration x
opt
∼ 0.15 for LSCO [35]. Then upon further doping, T
c
decreases and finally it reaches 0 K. For other materials, x
opt
takes a larger
value, but if we estimate the number of holes per CuO
2
-layer p by exper-
iments and regard T
c
as a function of p, it is known that the optimum p
c
where T
c
takes the maximum value does not vary so much by materials [38].
As for the maximum value of T
c
, it varies depending on matrix materials;
2.2 Experimental Results of Cuprates 13
from about 40 K of the first-discovered LSCO to 164 K of the HgCaCuO at
31 GPa. We call the hole-concentration region where T
c
goes upward by the
increase of hole-concentration “underdoped region”, and the region where
T
c
goes downward, “overdoped” region. The hole-concentration at which T
c
reaches a maximum value is called “optimum doping”.
The characteristic feature of x-dependence of T
c
, T
c
(x), is that it is bell-
shaped as schematically shown in Fig. 2.3. If the presence of the 3D AF-order
at low hole-concentration has a decisive effect on suppressing the occurrence
of superconductivity, the T
c
(x) curve is expected to rise steeply immediately
as the AF-order vanishes. But this is not the case for hole-doped cuprates,
because T
c
(x) increases gradually with increasing x. This means that the
AF-correlation has some role in superconducting properties.
In connection with the x-dependence of T
c
, a phase diagram shown in
Fig. 2.3 has been suggested for hole-doped cuprates by various experimental
results such as NMR [39, 40, 41, 42], ARPES [43, 44, 45], tunneling [46, 47],
electronic transports and magnetism [48, 49], electronic specific heat [50, 51],
neutron scattering [52, 53], optical properties [54, 55], etc. According to this
phase diagram, there are two kinds of “transition-lines” in addition to T
c
(x),
which are often called “low-energy pseudogap” and “high-energy pseudogap”.
We will discuss their origins in Chap. 12.
As for electron-doped materials such as Nd
2−x
Ce
x
CuO
4
, 3D AF-order
remains for larger doping concentration as shown schematically in Fig. 2.3. If
electron-doped materials are not reduced by oxygen, it is known that no su-
perconductivity occurs at all. By the small reduction of oxygen, 3D AF-order
disappear more quickly by electron doping and superconductivity appears
immediately after 3D AF-order vanishes. Then it takes the maximum T
c
of
23 K at around electron concentration x ∼ 0.18 for Nd
2−x
Ce
x
CuO
4−δ
and
T
c
becomes zero at around x ∼ 0.22.
2.2.2 The Symmetry of the Gap
The high resolution of angle resolved photo-emission spectroscopy (ARPES)
achieved in the last decade enables us to investigate the k-dependence of
the gap function of superconducting cuprates. Many experiments suggested
that the amplitude of the gap function vanishes along the lines k
x
= ±k
y
[44, 56, 57]. Existence of “nodes” on the gap function has been strongly sug-
gested from various other experiments, too. For example, NMR relaxation
rate experiments showed that there are no Hebel–Slichter peaks on temper-
ature dependence of relaxation rates (T
1
T )
−1
and (T
1
T )
−1
decreases with
temperature T in powers of T [58, 59]. In the case of ordinary superconduc-
tors, it is known that (T
1
T )
−1
has a peak just below T
c
and then it decreases
with temperature T decreasing as exp(−∆/T ), reflecting the non-vanishing
s-wave gap symmetry (see, for example, [60]). Strong evidence for d-wave
symmetry is also obtained from experiments such as penetration depth mea-
surement [61, 62, 63], specific heat [64, 65, 66], Raman scattering [67, 68],
14 2 Experimental Results of High Temperature Superconducting Cuprates
YBCO
A
B
Pb
+
+
--
+
+
--
+
+
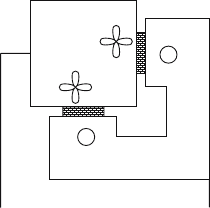
Fig. 2.4. Schematic configuration of π-junction experiment. If HTSC has d-
symmetry, cancellation of phase factor causes zero current for zero flux modulo
quantum flux while maximum tunneling current is achieved for half quantum flux
modulo quantum flux
tunneling [69, 70], etc. These experimental results are naturally understood
if we adopt a picture of d
x
2
−y
2
-symmetry for the symmetry of the super-
conducting gap. However, there is one more possibility for the anisotropy of
the gap function; the strongly anisotropic s-wave symmetry. We cannot deter-
mine either of the symmetry, d
x
2
−y
2
-symmetry or the anisotropic s-symmetry
(extended s-symmetry), is true for HTSC from ARPES experiments alone.
Distinguishing the d
x
2
−y
2
-symmetry from the anisotropic s-symmetry is
possible by experimental methods which can detect the phase of the gap
function directly. One such experimental method, which uses Josephson tun-
neling between cuprates and ordinary s-wave superconductors was proposed
by Sigrist and Rice [71]. Since it detects the sign change, i.e., the change of
phase by π, it is called “π-junction experiment”. Schematic configuration of
the π-junction experiment is shown in Fig. 2.4. Similar kinds of experiments
were actually performed for hole-doped YBCO by Wollam et al. [72] and
by Tsuei et al. [73]. Their results support d-wave symmetry and now the
same kind of experiments have been done for various kinds of hole-doped
cuprates [74, 75]. As for electron-doped materials, early experimental re-
sults suggested s-symmetry but recently π-junction experiments were also
performed for electron-doped materials [76] and from these experimental re-
sults, it seems that cuprates always have d
x
2
−y
2
-symmetry, although several
arguments have been made for the appearance of other symmetries. (see [77]
for example)
So far we have described experimental results which are directly related to
the contents of the present book. Experimental results which are specifically
related to the K–S model will be discussed in respective chapters.
3 Brief Review of Models of High-Temperature
Superconducting Cuprates
3.1 Introduction
In the present chapter we give a brief review of theories of high temperature
superconductivity (HTSC). A considerable number of theories have been pro-
posed since the discovery of HTSC, but here we review just a few of them
which have a different nature. Roughly speaking, we can classify them into
two models: Theories that essentially rely on the Fermi liquid picture and
those which presume a much more exotic picture as the basic electronic struc-
ture of cuprates. Many theories adopt a view that strong electron-correlation
plays an important roll in determining the electronic structure of cuprates,
and since there is no standard method to treat strongly correlated electronic
systems, theories differ even in the understanding of the normal state of
HTSC. In the following we mainly discuss theories with strong electron-
correlation.
Before explaining theories of HTSC, let us first look at some basic features
of cuprates. As we mentioned, all cuprates have quasi-two dimensional struc-
tures with layers consisting of Cu and O, and there are three basic structures
for the CuO
2
-layer: one consisting of CuO
6
octahedrons, one consisting of
CuO
5
pyramids, and one consisting of CuO
4
planes, as shown in Fig. 3.1. In
every case, we have a two-dimensional sheet consisting of CuO
2
as a unit.
Thus we distinguish oxygen atoms which surround a Cu atom in two ways;
in-plane O and apical O.
(a)
(b)
(c)
Fig. 3.1. Schematic picture for basic elements of CuO
2
-layer in cuprates. (a) CuO
4
plane, (b)CuO
5
pyramid, and (c)CuO
6
octahedron
16 3 Brief Review of Models of High-Temperature Superconducting Cuprates
It is known that in some cuprate materials, such as the first-discovered La-
system, undoped materials show no superconductivity and they are even
insulators with static antiferromagnetic order. Upon doping, they become
metallic and show superconductivity. From a naive point of view, since they
have odd numbers of electron per unit cell, they should be half-filled metals.
This discrepancy between the “naive” theoretical consideration and experi-
mental results can be easily understood if we take account of the effect of the
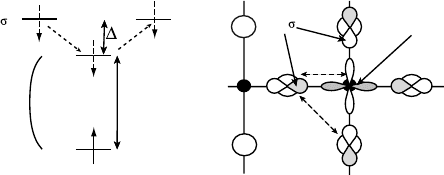
strong Coulomb repulsion. As shown in Fig. 3.2(a), electrons at each Cu-site
cannot be itinerant due to the strong on-site Coulomb repulsion U and also
due to the energy difference ∆ of one-electron states between the Cu 3d
x
2
−y
2
state and O 2p
σ
state. This physical picture also enables us to explain why
such insulating materials show anti-ferromagnetism. Virtual processes shown
in Fig. 3.2(b) gives rise to an anti-ferromagnetic (AF) superexchange interac-
tion J between neighbouring localized electrons on Cu-sites via intervening
O
2−
ions.
Upon doping, the AF-transition temperature T
N
falls quickly and systems
become metallic. And by further doping, superconductivity appears and the
transition temperature T
c
becomes higher and then reaches a maximum value.
By further doping, T
c
decreases and drops to 0 K. These features are already
shown in Fig. 2.3 in Chap. 2.
Now let us introduce various theories proposed for HTSC.
t
U
3d
x -y
2
2
Cu O
2p
3d
x -y
2
2
Cu
(a)
t
U
3d
x -y
2
2
Cu
O
2p
3d
x -y
2
2
Cu
1.
2.
4.
3.
t
(b)
Fig. 3.2. Schematic diagram of the electronic state of the insulating phase in copper
oxides. U denotes the on-site Coulomb repulsion (the Hubbard U), t the transfer
integral between Cu 3d
x
2
−y
2
and O 2pσ orbitals, and ∆ the difference of one-
electron energy between Cu 3d
x
2
−y
2
and O 2pσ orbitals. (a) Because of the large
value of U, electrons are localized on each Cu site. (b) Schematic picture showing
the origin of superexchange interaction J between two neighbouring Cu-site spins.
Successive virtual transfer of localized electrons shown in the perturbation processes
(4 to 1) apparently favors the antiferromagnetic configuration of the two electrons
3.2 Brief Review of Theories for HTSC 17
3.2 Brief Review of Theories for HTSC
3.2.1 Jahn–Teller Polarons and Bipolarons
ACu
2+
ion in a crystal placed in surroundings of octahedral symmetry has
a ground state which is orbitally doubly-degenerate. As a result, it is subject
to the Jahn–Teller distortion according to the Jahn–Teller theorem [78]. As
described in a previous chapter, the crystal structure of undoped La
2
CuO
4
is
tetragonal at high temperatures. This lower symmetry of La
2
CuO
4
has been
considered to be due to the Jahn–Teller distortion. Then, when hole-carriers
are introduced into La
2
CuO
4
by substituting Sr
2+
ions for La
3+
ions, api-
cal oxygen in a CuO
6
octahedron in La
2
CuO
4
tends to approach Cu ions
by the “anti-Jahn–Teller effect” so that a CuO
6
elongated octahedron in
La
2
CuO
4
deforms in such a way that the Cu-apical O distance is contracted
in La
2−x
Sr
x
CuO
4
(abbreviated as LSCO hereafter), as we described in a pre-
vious section. We call the former and the latter “elongated” and “deformed”
octahedrons, respectively. When these hole-carriers interact with distorted
CuO
6
octahedrons via electron-lattice interactions, they become polarons.
These polarons are called “Jahn–Teller (JT) polarons” [79, 80, 81, 82, 83, 84].
When the transfer integral of a hole-carrier t is much smaller than the Jahn–
Teller stabilization energy E
JT
, a severely confined self-trapped state around
an octahedron site is produced. Such a state is called a “small polaron”. On
the other hand, when t is much larger than E
JT
, a hole-carrier can distort
CuO
6
octahedrons over many lattice distances. Such a hole-carrier is called
a “large polaron” [84, 85, 86].
When an electron–phonon coupling constant is large, Alexandrov and
Mott [87] argued a possible appearance of a bipolaronic charged Bose liquid.
They argued that two JT-polarons form a bounded pair in the real space
which they call a “bipolaron”, and the superconductivity of cuprates comes
from the Bose condensation of these bipolarons in cuprates. From the stand-
point that superconducting cuprates are heavily-doped ionic insulators with
local distortions, the formations of various types of bipolaron, such as small
bipolarons, large bipolarons, JT-bipolarons, etc. have been suggested as a
mechanism of high temperature superconductivity [20, 80, 81, 84, 86, 87, 88].
In fact, Bednorz and M¨uller [3] made a discovery of superconducting cuprates
by considering that materials with a strong JT effect may reveal superconduc-
tivity with high T
c
. So far we have described a qualitative aspect of the bipo-
laron mechanism. From a quantitative perspective, there are various problems
to be clarified. In particular, recent Angle-Resolved-Photoemission (ARPES)
experiments by Yoshida and his coworkers [23, 24, 25] clearly showed the
existence of “Fermi arcs” for LSCO, which may be considered as the arc sec-
tion of a Fermi surface. These experimental results are not compatible with
bipolaron models in which hole-carriers form bosonic particles. Further, a
hopping process from deformed octahedrons to elongated octahedrons some-
times makes polarons localized, or makes the mass of a polaron heavier. As a
18 3 Brief Review of Models of High-Temperature Superconducting Cuprates
result a superconducting transition temperature T
c
may not be high enough
to produce high temperature superconductors. In this book, we will investi-
gate these problems quantitatively.
3.2.2 The Resonating Valence Bond (RVB) State
and Quasi-particle Excitations
Assuming that the hole-carriers itinerate in the CuO
2
planes, the RVB state
[89] is represented by the single-band Hubbard Hamiltonian,
H =
nmσ
t{c
†
nσ
c
mσ
+ h.c.} +
Un
n↑
n
n↓
, (3.1)
where c
nσ
(c
(†)
nσ
) denotes the annihilation (creation) operator of an electron
with spin σ on the Cu 3d
x
2
−y
2
(hereafter d
x
2
−y
2
)atthenth site of a CuO
2
-
layer, n
nσ
the number operator with spin σ at the nth site, while t denotes
the transfer between neighbouring Cu d
x
2
−y
2
sites, U the on-site Coulomb
repulsion, i.e., the Hubbard interaction between electrons on the same copper
site with different spins. As seen from the model Hamiltonian it only consid-
ers the highest occupied level of CuO
2
-layer, the Cu d
x
2
−y
2
level. If we start
from the half-filled state, i.e., the system with one hole per Cu atom, because
of the strong on-site Hubbard interaction U, the system is considered to be
an antiferromagnetic insulating system with the superexchange interaction
J = t
2
/U. Anderson considered that the ground state of the system is well
described by the so-called resonating valence bond (RVB) state, which was
first introduced by Anderson himself for other antiferromagnetic Heisenberg
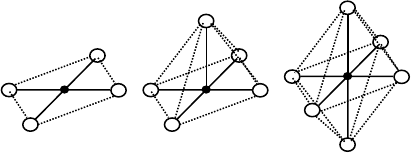
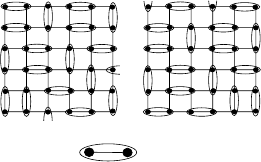
spin systems [90]. The RVB state is expressed by the superposition of many
configurations of the local singlet pairs (spin singlet states consist of two
neighbouring Cu localized d
x
2
−y
2
spins) as illustrated in Fig. 3.3. Reflecting
the low dimensionality of CuO
2
-layers, localized spins should have a strong
quantum fluctuation effect and Anderson proposed the RVB state as a can-
didate for the ground state of the single Hubbard model of two-dimensional
square lattice system at the half-filling. We readily see that the RVB state
has no long-range antiferromagnetic order from Fig. 3.3.
+
+etc.,
singlet pair
Fig. 3.3. Schematic picture for the RVB ground state. Localized Cu spins form a
local singlet pair and the RVB ground state is expressed as the superposition of all
configurations of states like those illustrated in the figure
3.2 Brief Review of Theories for HTSC 19
Using the second quantization, the RVB state is written as follows.
Ψ
RVB
∝P
N
n,m
δ
±u
i
,n−m
c
†
n↑
c
†
m↓
N
Ψ
0
, (3.2)
where c
†
nσ
is the creation operator of an electron with spin σ at the nth site
and P
N
is the projection operator to the fixed total number N state with no
doubly occupied states on each Cu atom sites. The u
i
s with i =1, 2 denote
the unit vectors of the square lattice system, which connect neighbouring Cu
sites, and the summation for n and m is taken all over the lattice sites, 2N
being the number of Cu atoms in the system. The summation in (3.2) is taken
over all neighbouring Cu sites n and m. On the other hand, it is known that
the BCS ground state with N
-Cooper pairs can be written as [60]
Ψ
BCS
∝P
N
n,m
g(n − m
c
†
n↑
c
†
m↓
)
N
Ψ
0
, (3.3)
where g(n) is a pair function of the BCS state and P
N
is the projection op-
erator to the fixed total number N
state. One readily sees a strong analogy
in the form of two wave functions Ψ
RVB
and Ψ
BCS
. From this observation,
Anderson argued that the ground state of the hole-doped CuO
2
-layer be-
comes superconducting with the ground state wave function Ψ
RVB
,whichis
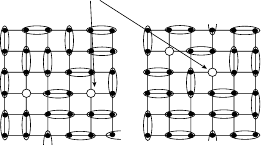
illustrated in Fig. 3.4.
+
+etc.
holons
Fig. 3.4. Schematic picture for the RVB ground state with a finite hole concentra-
tion. In this case, local singlet pairs are formed by all Cu sites except for vacant
sites as shown in the figure. In the figure we have two holons
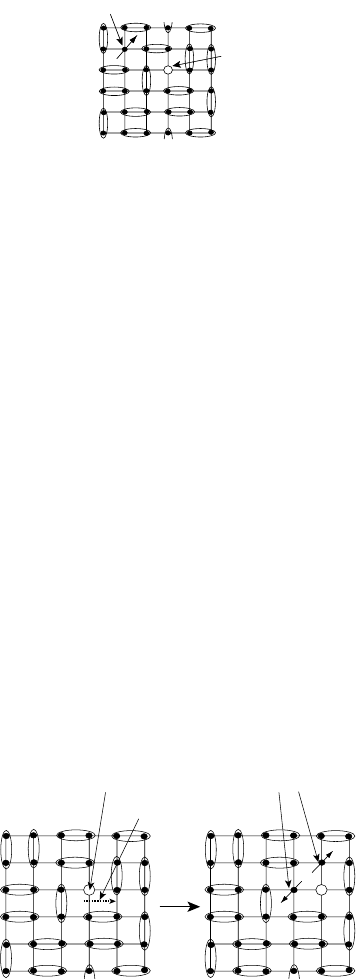
As for the one-particle excitation, Anderson predicted a much more exotic
picture. If we introduce a hole in the half-filled RVB state, inevitably there
appears an unpaired electron spin and a vacant state with charge +e as seen
from Fig. 3.5. From the energetic point of view there is no need for the
unpaired spin and the vacant site to be bounded each other. Then Anderson
concluded that the unpaired spin and vacant site can itinerate independently
20 3 Brief Review of Models of High-Temperature Superconducting Cuprates
+etc.
spinon
holon
Fig. 3.5. Schematic picture for spinon, holon excitations in the RVB model
with the aid of transfer integral t. As a result we have two kinds of quasi-
particle excitations in the RVB state. The neutral spin 1/2 excitation is called
“spinon” excitation and the +e charged spin 0 excitation is called “holon”
excitation. The ground state of the RVB state for finite hole concentration x
(3.3) is then regarded as the Bose condensed state of holon excitations.
The effective Hamiltonian for low-energy phenomena is derived from the
single-band Hubbard Hamiltonian (3.1) by an appropriate canonical trans-
formation and it is written as follows.
H
RVB
=
nmσ
t{P
n
c
†
nσ
c
mσ
P
m
+ h.c.} +
nm
Js
n
· s
m
, (3.4)
where P
n
=1−n
n↑
n
n↓
is the projection operator at the nth site to exclude
the doubly occupied state and s
n
denotes the spin operator at the nth Cu
site if there is just one electron on this site, otherwise the zero operator. The
RVB Hamiltonian, which has far less degrees of freedom compared with the
single Hubbard Hamiltonian, is still practically unsolvable. The reduction is
expressed by P
n
, which has abstract, mathematical form, so that the treat-
ment of this term is a main difficulty in solving the problem. On the other
hand, the spinon–holon picture can be understood intuitively. That is, we
see some features of the model without solving the problem rigorously. As
we see from Fig. 3.6, a holon motion inevitably destroys local singlet cou-
pling of the RVB state. Then it is expected that the effective transfers for
unpaired spinon
holon
holon transfer
Fig. 3.6. Schematic diagram explaining the frustration effect of a holon motion. If
a holon transfers to the neighbouring Cu site, it inevitably destroys the local singlet
pair formed in that site, and as a result two unpaired spins appear
3.2 Brief Review of Theories for HTSC 21
holon-excitations are much reduced from the bare t because of this frustra-
tion effect. Since the superconducting transition in the RVB state can be
treated as the Bose condensation of holons, the reduction of the transfer of
a holon, i.e., enhancement of the effective mass of a holon, suppresses the
superconducting transition temperature T
c
.
3.2.3 The d–p Model
From optical [91, 92] and X-ray absorption (XAS) [93, 94] experiments, it
is revealed that O 2p orbitals play significant roles in the electronic state of
hole-doped systems. Taking this fact into account, Emery [95] proposed a
model Hamiltonian which includes O 2p
σ
orbitals in a CuO
2
-layer. Because
this model considers not only the Cu d
x
2
−y
2
orbitals but also in-plane O 2p
σ
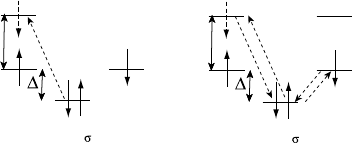
orbitals, it is called the d–p model. A schematic picture of the d–p model
is given in Fig. 3.7. The figure is written from the hole picture so that the
“one electron” level of O 2p
σ
orbital is higher than that of Cu d
x
2
−y
2
and
all the O 2p
σ
levels are empty at the half filling state. When we introduce
one hole in this system, it is accommodated in an O 2p
σ
orbital or an upper
Hubbard level of Cu d
x
2
−y
2
as shown in Fig. 3.7(a). Then a hole becomes
itinerant by the mixing of these two levels, which form a band with typical
energy level between the O 2p
σ
level and the upper Hubbard Cu d
x
2
−y
2
level.
Emery and others who support the d–p model assigned this band to the
so-called “mid-gap state” found in optical and X-ray absorption experiments
of cuprates [91, 93]. The important point is that this “mid-gap state” energy
t
U
3d
x -y
2
2
Cu
O
2p
O
Cu
(a)
(b)
t
U.H.
L.H.
Cu 3d
x -y
2
2
O
2p
t
pp
t
pd
Fig. 3.7. Schematic diagram describing the d–p model in the hole picture. (a)
Schematic diagram for the Hubbard interaction U, difference of one-electron level
∆ between O 2p
σ
and Cu d
x
2
−y
2
, and the transfer integral t
dp
between O 2p
σ
and Cu d
x
2
−y
2
in the d–p model. Solid arrows represent localized spins while a
dashed arrow represents a doped hole. UH denotes the upper Hubbard level and
LH the lower Hubbard level of Cu d
x
2
−y
2
. Here, the hole picture is taken so that
empty orbitals of O 2p
σ
levels correspond to the fully occupied state in the ordinary
picture. (b) Schematic picture of O 2p
σ
orbitals and Cu d
x
2
−y
2
orbital, and the
transfer t
dp
between O 2p
σ
and Cu d
x
2
−y
2
, the transfer t
pp
between O 2p
σ
sare
shown