Investment Banking, valuation and M&A
Подождите немного. Документ загружается.


P1: ABC/ABC P2:c/d QC:e/f T1:g
c05 JWBT063-Rosenbaum March 18, 2009 15:37 Printer Name: Hamilton
LBO Analysis
235
As shown in Exhibit 5.42, for the ValueCo LBO, we assumed a fixed leverage
level of 5.1x LTM 9/30/08 EBITDA of $146.7 million and a 2013E exit year, while
sensitizing entry and exit multiples. For our IRR analysis, we focused on entry and
exit multiple combinations that produced an IRR in the 20% area, assuming an
equity contribution range of 25% to 35%.
EXHIBIT 5.42
IRR Sensitivity Analysis – Entry and Exit Multiples
EntryEquity Enterprise
Value
Contribution Multiple 7.25x7.00x6.75x6.50x 7.50x 8.00x7.75x
6.50x23.5% $953.3 34.7%33.5%32.2%30.9%29.5%28.1%26.6%
6.75x26.2% 990.0 23.0% 24.5% 30.9%29.7%28.5%27.2%25.9%
7.00x28.7% 1,026.7 21.4%19.9% 22.7% 27.7%26.5%25.3%24.1%
7.25x31.0% 1,063.3 20.0%18.7%17.3% 21.3% 24.9%23.7%22.6%
33.2% 1,100.0 7.50x 18.9%17.7%16.4%15.0% 20.1% 22.4%21.3%
7.75x35.2% 1,136.7 20.2%19.1%18.0%16.8%15.5%14.3%12.9%
8.00x37.2% 1,173.3 18.2%17.1%16.0%14.8%13.6%12.4%11.0%
IRR - Assuming Exit in 2013E
Exit Multiple
For example, a 7.5x entry and exit multiple provides an IRR of 20.1% while
requiring a 33.2% equity contribution given the proposed leverage. A 7.75x entry
and exit multiple, however, yields an IRR of 19.1% while requiring an equity con-
tribution of 35.2%. At the low end of the range, a 6.75x entry and exit multiple
provides an IRR of 24.5% while requiring a 26.2% equity contribution.
It is also common to perform sensitivity analysis on a combination of exit mul-
tiples and exit years. As shown in Exhibit 5.43, we assumed fixed total leverage and
entry multiples of 5.1x and 7.5x LTM 9/30/08 EBITDA, respectively, and examined
the resulting IRRs for a range of exit years from 2011E to 2015E and exit multiples
from 6.5x to 8.5x.
EXHIBIT 5.43
IRR Sensitivity Analysis – Exit Multiple and Exit Year
IRR - Assuming 7.5x Entry Multiple
Exit Year
20122011 2013 20152014
6.5x 14.8%14.9%15.0%14.7%13.7%
7.0xExit 19.4% 17.0%17.7%18.5% 16.3%
Multiple 7.5x 24.6% 21.9% 20.1% 18.8% 17.8%
8.0x 29.4% 20.5%22.4%25.1% 19.1%
8.5x 20.4%22.1%24.5%28.0%33.9%
Step V(c): Determine Valuation
As previously discussed, sponsors base their valuation of an LBO target in large part
on their comfort with realizing acceptable returns at a given purchase price. This
analysis assumes a given set of financial projections, purchase price, and financing
structure, as well as exit multiple and year. At the same time, sponsors are guided
by the other valuation methodologies discussed in this book.
LBO analysis is also informative for strategic buyers by providing perspective
on the price a competing sponsor bidder might be willing to pay for a given target
in an organized sale process. This data point allows strategic buyers to frame their
bids accordingly. As a result, the banker is expected to employ LBO analysis as a
P1: ABC/ABC P2:c/d QC:e/f T1:g
c05 JWBT063-Rosenbaum March 18, 2009 15:37 Printer Name: Hamilton
236 LEVERAGED BUYOUTS
valuation technique while serving as an M&A advisor in both buy-side and sell-side
situations.
Traditionally, the valuation implied by LBO analysis is toward the lower end
of a comprehensive analysis when compared to other methodologies, particularly
precedent transactions and DCF analysis. This is largely due to the constraints im-
posed by an LBO, including leverage capacity, credit market conditions, and the
sponsor’s own IRR hurdles. Furthermore, strategic buyers are typically able to re-
alize synergies from the target, thereby enhancing their ability to earn a targeted
return on their invested capital at a higher purchase price. However, in robust debt
financing environments, such as during the credit boom of the mid-2000s, sponsors
were able to compete with strategic buyers on purchase price. The multiples paid in
LBO transactions during this period were supported by the use of a high proportion
of low-cost debt in the capital structure, translating into a relatively lower overall
cost of capital for the target.
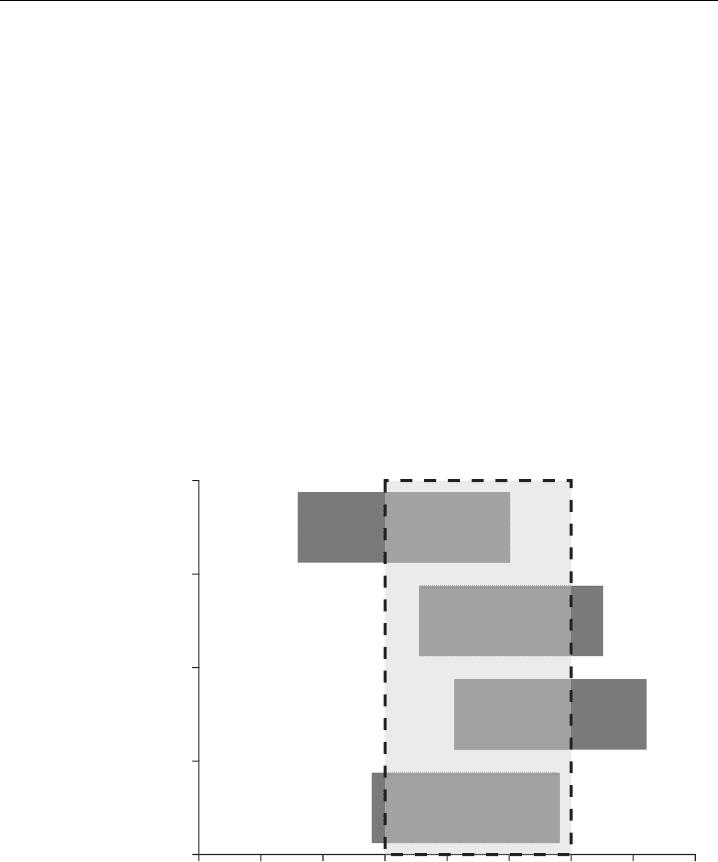
EXHIBIT 5.44
ValueCo Football Field Displaying Comparable Companies, Precedent Trans-
actions, DCF Analysis, and LBO Analysis
$850 $1,250$1,200$1,150$1,100$1,050$1,000$950$900
LBO Analysis
5.1x Total Debt / LTM EBITDA
20% IRR and 5-year Exit
25% - 35% Equity Contribution
DCF Analysis
10.5% – 11.5% WACC
6.5x – 7.5x Exit Multiple
Precedent Transactions
7.0x – 8.0x LTM EBITDA
Comparable Companies
6.5x – 7.5x LTM EBITDA
6.25x – 7.25x 2008E EBITDA
5.75x – 6.75x 2009E EBITDA
($ in millions)
As with the DCF, the implied valuation range for ValueCo was derived from
sensitivity analysis output tables (see Exhibit 5.42). For the ValueCo LBO, we focused
on a range of entry and exit multiples that produced IRRs in the 20% area, given
an equity contribution range of 25% of 35%. This approach led us to determine a
valuation range of 6.75x to 7.75x LTM 9/30/08 EBITDA, or approximately $990
million to $1,135 million (see Exhibit 5.44).
Step V(d): Create Transaction Summary Page
Once the LBO model is fully functional, all the essential model outputs are linked to
a transaction summary page (see Exhibit 5.46). This page provides an overview of

P1: ABC/ABC P2:c/d QC:e/f T1:g
c05 JWBT063-Rosenbaum March 18, 2009 15:37 Printer Name: Hamilton
LBO Analysis
237
the LBO analysis in a user-friendly format, typically displaying the sources and uses
of funds, acquisition multiples, summary returns analysis, and summary financial
data, as well as projected capitalization and credit statistics. This format allows the
deal team to quickly review and spot-check the analysis and make adjustments to
the purchase price, financing structure, operating assumptions, and other key inputs
as necessary.
The transaction summary page also typically contains the toggle cells that allow
the banker to switch among various financing structures and operating scenarios, as
well as activate other functionality. The outputs on this page (and throughout the
entire model) change accordingly as the toggle cells are changed.

P1: ABC/ABC P2:c/d QC:e/f T1:g
c05 JWBT063-Rosenbaum March 18, 2009 15:37 Printer Name: Hamilton
238 LEVERAGED BUYOUTS
ILLUSTRATIVE LBO ANALYSIS FOR VALUECO
The following pages display the full LBO model for ValueCo based on the step-
by-step approach outlined in this chapter. Exhibit 5.45 lists these pages, which are
shown in Exhibits 5.46 to 5.54.
EXHIBIT 5.45
LBO Model Pages
LBO Model
I. Transaction Summary
II. Income Statement
III. Balance Sheet
IV. Cash Flow Statement
V. Debt Schedule
VI. Returns Analysis
Assumptions Pages
I. Assumptions Page 1—Income Statement and Cash Flow Statement
II. Assumptions Page 2—Balance Sheet
III. Assumptions Page 3—Financing Structures and Fees
P1: ABC/ABC P2:c/d QC:e/f T1:g
c05 JWBT063-Rosenbaum March 18, 2009 15:37 Printer Name: Hamilton
EXHIBIT 5.46
ValueCo LBO Transaction Summary
ValueCo Corporation
Leveraged Buyout Analysis
Structure 1
Financing Structure:
($ in millions, fiscal year ending December 31)
Base
Operating Scenario:
Sources of Funds
Uses of Funds
Purchase Price
Return Analysis
% of Total
Multiple of EBITDA
% of Total
-
Offer Price per Share
2013
Exit Year
Amount
Sources
9/30/2008
Cumulative
Pricing
Amount
Uses
-
Fully Diluted Shares
Entry Multiple
7.5x
-
Revolving Credit Facility
- x
- x
- %
$825.0
Purchase ValueCo Equity
L+325 bps
71.1%
Equity Purchase Price
$825.0
Exit Multiple
7.5x
-
Term Loan A
- x
- x
- %
300.0
Repay Existing Debt
AN
25.9%
0.572
Plus: Existing Net Debt
IRR
20%
450.0
Term Loan B
3.1x
3.1x
38.8%
-
Tender / Call Premiums
spb053+L
- %
0.001,1$
Enterprise Value
Cash Return
2.5x
-
Term Loan C
- x 3.1x
- %
NA
20.0
Financing Fees
1.7%
-
2nd Lien
- x 3.1x
- %
NA
15.0
Other Fees and Expenses
1.3%
Transaction Multiples
Options
-
Senior Notes
- x 3.1x
- %
NA
Financing Structure
Enterprise Value / Sales
1
300.0
Senior Subordinated Notes
5.1x
2.0x
25.9%
10.000%
$977.8
LTM 9/30/2008
1.1x
Operating Scenario
1
385.0
Equity Contribution
7.7x
2.6x
33.2%
1,000.0
2008E
1.1x
Cash Flow Sweep
1
-
Rollover Equity
- x 7.7x
- %
Enterprise Value / EBITDA
Cash Balance
1
25.0
Cash on Hand
2.2%
0.2x
7.9x
$146.7
LTM 9/30/2008
7.5x
Average Interest
1
0.061,1$
secruoSlatoT
100.0% 7.9x
7.9x
0.061,1$
sesUlatoT
100.0%
150.0
2008E
7.3x
Financing Fees
1
Projection Period
LTM Pro forma
Year 1
Year 2
Year 3
Year 4
Year 5
Year 6
Year 7
Year 8
Year 9 Year 10
2005
2006
2007
9/30/2008
2008
2009
2010
2011
2012
2013
2014
2015
2016
2017
2018
0.087$
selaS
$850.0
$925.0
$977.8
$1,000.0
$1,080.0
$1,144.8
$1,190.6
$1,226.3
$1,263.1
$1,301.0
$1,340.0
$1,380.2
$1,421.6
$1,464.3
%0.9
AN
htworg%
8.8%
NA
8.1%
8.0%
6.0%
4.0%
3.0%
3.0%
3.0%
3.0%
3.0%
3.0%
3.0%
1.803$
tiforPssorG
$337.9
$370.0
$391.1
$400.0
$432.0
$457.9
$476.2
$490.5
$505.2
$520.4
$536.0
$552.1
$568.7
$585.7
%5.93
nigram%
39.8%
40.0%
40.0%
40.0%
40.0%
40.0%
40.0%
40.0%
40.0%
40.0%
40.0%
40.0%
40.0%
40.0%
EBITDA
$109.2
$123.3
$138.8
$146.7
$150.0
$162.0
$171.7
$178.6
$183.9
$189.5
$195.1
$201.0
$207.0
$213.2
$219.6
%0.41
n
ig
r
a
m%
14.5%
15.0%
15.0%
15.0%
15.0%
15.0%
15.0%
15.0%
15.0%
15.0%
15.0%
15.0%
15.0%
15.0%
Capital Expenditures
15.0
18.0
18.5
19.6
20.0
21.6
22.9
23.8
24.5
25.3
26.0
26.8
27.6
28.4
29.3
%9.1
selas%
2.1%
2.0%
2.0%
2.0%
2.0%
2.0%
2.0%
2.0%
2.0%
2.0%
2.0%
2.0%
2.0%
2.0%
Cash Interest Expense
59.9
58.5
55.9
52.7
49.2
45.2
40.0
34.0
30.7
30.7
30.7
Total Interest Expense
62.4
60.9
58.4
55.2
51.7
47.6
42.5
36.2
31.7
31.7
31.7
Free Cash Flow
EBITDA
$162.0
$171.7
$178.6
$183.9
$189.5
$195.1
$201.0
$207.0
$213.2
$219.6
Less: Cash Interest Expense
Plus: Interest Income
Less: Income Taxes
Less: Capital Expenditures
Less: Increase in Net Working Capital
Free Cash Flow
$43.7
$52.0
$59.6
$65.7
$71.1
$77.2
$83.9
$89.5
$94.4
$99.6
Cumulative Free Cash Flow
43.7
95.8
155.4
221.1
292.1
369.3
453.2
542.7
637.2
736.7
Cash
-
-
-
-
-
-
-
$3.2
$92.7
$187.2
$286.7
Revolving Credit Facility
-
-
-
-
-
-
-
-
-
-
-
Term Loan B
450.0
406.3
354.2
294.6
228.9
157.9
80.7
-
-
-
-
Other Debt
-
-
-
-
-
-
-
-
-
-
-
Total Senior Secured Debt
$450.0
$406.3
$354.2
$294.6
$228.9
$157.9
$80.7
-
-
-
-
Senior Subordinated Notes
300.0
300.0
300.0
300.0
300.0
300.0
300.0
300.0
300.0
300.0
300.0
Total Debt
$750.0
$706.3
$654.2
$594.6
$528.9
$457.9
$380.7
$300.0
$300.0
$300.0
$300.0
Shareholders' Equity
Total Capitalization
% of Bank Debt Repaid
% Debt / Total Capitalization
EBITDA / Cash Interest Expense
2.5x 2.8x
3.1x 3.4x
3.7x 4.2x
4.9x 5.9x
6.8x 7.0x
7.2x
(EBITDA - Capex) / Cash Interest Expense
2.2x 2.4x
2.7x 2.9x
3.2x 3.6x
4.2x 5.1x
5.9x 6.0x
6.2x
EBITDA / Total Interest Expense
2.4x 2.7x
2.9x 3.2x
3.6x 4.0x
4.6x 5.6x
6.5x 6.7x
6.9x
(EBITDA - Capex) / Total Interest Expense
2.1x 2.3x
2.5x 2.8x
3.1x 3.4x
4.0x 4.8x
5.7x 5.8x
6.0x
Senior Secured Debt / EBITDA
3.0x 2.5x
2.1x 1.6x
1.2x 0.8x
0.4x NM
NM NM
NM
Total Debt / EBITDA
5.0x 4.4x
3.8x 3.3x
2.9x 2.4x
2.0x 1.5x
1.4x 1.4x
1.4x
Net Debt / EBITDA
5.0x 4.4x
3.8x 3.3x
2.9x 2.4x
2.0x 1.5x
1.0x 0.5x
0.1x
Transaction Summary
Historical Period
Capitalization
Credit Statistics
Summary Financial Data
(58.5)
(55.9)
(52.7)
(49.2)
(45.2)
(40.0)
(34.0)
(30.7)
(30.7)
(30.7)
-
-
-
--
-0
.0
1.4
4.2
7.1
(30.2)
(34.4)
(37.9)
(40.9)
(44.3)
(48.1)
(52.5)
(56.7)
(59.8)
(63.0)
(21.6)
(22.9)
(23.8)
(24.5)
(25.3)
(26.0)
(26.8)
(27.6)
(28.4)
(29.3)
(8.0)
(6.5)
(4.6)
(3.6)
(3.7)
(3.8)
(3.9)
(4.0)
(4.1)
(4.3)
370.0
419.3
475.3
537.1
603.9
676.2
754.7
840.3
1,030.4 1,133.1
$1,120.0 $1,125.5
$1,129.6 $1,131.7
$1,132.8 $1,134.0
$1,135.4 $1,140.3
$1,330.4 $1,433.1
-
9.7%
21.3%
34.5%
49.1%
64.9%
82.1% 100.0%
100.0%
932.5
$1,232.5
100.0%
100.0%
67.0%
62.7%
57.9%
52.5%
46.7%
40.4%
33.5%
26.3%
26.6%
20.9%
24.3%
239
P1: ABC/ABC P2:c/d QC:e/f T1:g
c05 JWBT063-Rosenbaum March 18, 2009 15:37 Printer Name: Hamilton
EXHIBIT 5.47
ValueCo LBO Income Statement
($ in millions, fiscal year ending December 31)
Historical Period
Projection Period
LTM Pro forma Year 1
Year 2 Year 3 Year 4
Year 5 Year 6 Year 7
Year 8 Year 9 Year 10
2005
2006
2007
9/30/2008
2008
2009
2010
2011
2012
2013
2014
2015
2016
2017
2018
Sales
$780.0 $850.0
$925.0
$977.8
$1,000.0 $1,080.0
$1,144.8
$1,190.6
$1,226.3
$1,263.1
$1,301.0
$1,340.0
$1,380.2
$1,421.6
$1,464.3
%0.9
NA
% growth
8.8%
NA 8.1%
8.0%
6.0%
4.0%
3.0%
3.0%
3.0%
3.0%
3.0%
3.0%
3.0%
Cost of Goods Sold
512.1
471.9
555.0
586.7
600.0
648.0
686.9
714.4
735.8
757.9
780.6
804.0
828.1
853.0
878.6
$308.1
Gross Profit
$337.9
$370.0
$391.1
$400.0
$432.0
$457.9
$476.2
$490.5
$505.2
$520.4
$536.0
$552.1
$568.7
$585.7
39.5%
% margin
39.8%
40.0%
40.0%
40.0%
40.0%
40.0%
40.0%
40.0%
40.0%
40.0%
40.0%
40.0%
40.0%
40.0%
Selling, General & Administrative
198.9 214.6
231.3
244.4
250.0 270.0
286.2
297.6
306.6
315.8
325.2
335.0
345.1
355.4
366.1
% sales
25.3%
25.5%
25.0%
25.0%
25.0%
25.0%
25.0%
25.0%
25.0%
25.0%
25.0%
25.0%
25.0%
25.0%
25.0%
Other Expense / (Income)
-
-
-
-
-
-
-
-
-
-
-
-
-
-
-
EBITDA
$109.2 $123.3
$138.8
$146.7
$150.0
$162.0
$171.7
$178.6
$183.9
$189.5
$195.1
$201.0
$207.0
$213.2
$219.6
14.0%
% margin
14.5%
15.0%
15.0%
15.0%
15.0%
15.0%
15.0%
15.0%
15.0%
15.0%
15.0%
15.0%
15.0%
15.0%
Depreciation & Amortization
17.0
15.6
18.5
19.6
20.0
21.6
22.9
23.8
24.5
25.3
26.0
26.8
27.6
28.4
29.3
$93.6
EBIT
$106.3
$120.3
$127.1
$130.0
$140.4
$148.8
$154.8
$159.4
$164.2
$169.1
$174.2
$179.4
$184.8
$190.4
12.0%
% margin
12.5%
13.0%
13.0%
13.0%
13.0%
13.0%
13.0%
13.0%
13.0%
13.0%
13.0%
13.0%
13.0%
13.0%
Interest Expense
Revolving Credit Facility
-
-
-
-
-
-
-
-
-
-
-
Term Loan B
29.3
27.8
25.3
22.1
18.6
14.5
9.4
3.3
-
-
-
Senior Subordinated Notes
30.0
30.0
30.0
30.0
30.0
30.0
30.0
30.0
30.0
30.0
30.0
Commitment Fee on Unused Revolver
0.5
0.5
0.5
0.5
0.5
0.5
0.5
0.5
0.5
0.5
0.5
Administrative Agent Fee
0.2
0.2
0.2
0.2
0.2
0.2
0.2
0.2
0.2
0.2
0.2
Cash Interest Expense
$59.9
$58.5
$55.9
$52.7
$49.2
$45.2
$40.0
$34.0
$30.7
$30.7
$30.7
5.2
Amortization of Deferred Financing Fees
2.5
2.5
2.5
2.5
2.5
2.5
2.2
1.0
1.0
1.0
Total Interest Expense
$62.4
$60.9
$58.4
$55.2
$51.7
$47.6
$42.5
$36.2
$31.7
$31.7
$31.7
Interest Income
-
-
-
-
-
-
(0.0) (1.4)
(4.2)
(7.1)
Net Interest Expense
$60.9
$58.4
$55.2
$51.7
$47.6
$42.5
$36.1
$30.2
$27.5
$24.6
Earnings Before Taxes
79.5
90.4
99.6
107.7
116.6
126.7
138.1
149.2
157.3
165.8
Income Tax Expense
30.2
34.4
37.9
40.9
44.3
48.1
52.5
56.7
59.8
63.0
Net Income
$49.3
$56.1
$61.8
$66.8
$72.3
$78.5
$85.6
$92.5
$97.5
$102.8
% margin
4.6%
4.9%
5.2%
5.4%
5.7%
6.0%
6.4%
6.7%
6.9%
7.0%
Income Statement Assumptions
Sales (% YoY growth)
4.0%
6.0%
8.0%
NA 8.1%
8.8%
NA 9.0%
3.0%
3.0%
3.0%
3.0%
3.0%
3.0%
3.0%
COGS (% margin)
60.0%
60.0%
60.0%
60.0%
60.0%
60.0%
60.3%
60.5%
60.0%
60.0%
60.0%
60.0%
60.0%
60.0%
60.0%
SG&A (% sales)
25.0%
25.0%
25.0%
25.0%
25.0%
25.0%
25.3%
25.5%
25.0%
25.0%
25.0%
25.0%
25.0%
25.0%
25.0%
Other Expense / (Income) (% of sales)
- %
- %
- %
- %
- %
- %
- %
- %
- %
- %
- %
- %
- %
- %
- %
Depreciation & Amortization (% of sales)
2.0%
2.0%
2.0%
2.0%
2.0%
2.0%
2.0%
2.0%
2.0%
2.0%
2.0%
2.0%
2.0%
2.0%
2.0%
Interest Income
3.0%
3.0%
3.0%
3.0%
3.0%
3.0%
3.0%
3.0%
3.0%
3.0%
3.0%
Tax Rate
38.0%
38.0%
38.0%
38.0%
38.0%
38.0%
38.0%
38.0%
38.0%
38.0%
Income Statement
240
P1: ABC/ABC P2:c/d QC:e/f T1:g
c05 JWBT063-Rosenbaum March 18, 2009 15:37 Printer Name: Hamilton
EXHIBIT 5.48
ValueCo LBO Balance Sheet
($ in millions, fiscal year ending December 31)
Projection Period
Opening Adjustments
Pro Forma Year 1 Year 2
Year 3 Year 4 Year 5
Year 6 Year 7 Year 8 Year 9
Year 10
2008
+
-
2008
2009
2010
2011
2012
2013
2014
2015
2016
2017
2018
Cash and Cash Equivalents
$25.0
(25.0)
-
-
-
-
-
-
- $3.2
$92.7
$187.2
$286.7
Accounts Receivable
165.0
165.0
178.2
188.9
196.4
202.3
208.4
214.7
221.1
227.7
234.6
241.6
Inventories
125.0
125.0
135.0
143.1
148.8
153.3
157.9
162.6
167.5
172.5
177.7
183.0
Prepaids and Other Current Assets
10.0
10.0
10.8
11.4
11.9
12.3
12.6
13.0
13.4
13.8
14.2
14.6
0.523$
stessA tnerruC latoT
0.003$
$324.0
$343.4
$357.2
$367.9
$378.9
$390.3
$405.2
$506.8
$613.6
$726.0
Property, Plant and Equipment, net
650.0
650.0
650.0
650.0
650.0
650.0
650.0
650.0
650.0
650.0
650.0
650.0
Goodwill and Intangible Assets
175.0
0.003
0.521
300.0
300.0
300.0
300.0
300.0
300.0
300.0
300.0
300.0
300.0
Other Assets
75.0
75.0
75.0
75.0
75.0
75.0
75.0
75.0
75.0
75.0
75.0
75.0
Deferred Financing Fees
-
0.02
20.0
17.5
15.1
12.6
10.2
7.7
5.3
3.1
2.1
1.0
0.0
0.522,1$
stessA latoT
0.543,1$
$1,366.5
$1,383.5
$1,394.8
$1,403.1
$1,411.7
$1,420.6
$1,433.3
$1,533.9
$1,639.7
$1,751.0
Accounts Payable
75.0
75.0
81.0
85.9
89.3
92.0
94.7
97.6
100.5
103.5
106.6
109.8
Accrued Liabilities
100.0
100.0
108.0
114.5
119.1
122.6
126.3
130.1
134.0
138.0
142.2
146.4
Other Current Liabilities
25.0
25.0
27.0
28.6
29.8
30.7
31.6
32.5
33.5
34.5
35.5
36.6
0.002$
seitilibaiL tnerruC latoT
0.002$
$216.0
$229.0
$238.1
$245.3
$252.6
$260.2
$268.0
$276.0
$284.3
$292.9
Revolving Credit Facility
-
-
-
-
-
-
-
-
-
-
-
-
Term Loan B
-
0.054
0.054
406.3
354.2
294.6
228.9
157.9
80.7
-
-
-
-
Existing Term Loan
300.0
(300.0)
-
-
-
-
-
-
-
-
-
-
-
Senior Subordinated Notes
-
0.003
0.003
300.0
300.0
300.0
300.0
300.0
300.0
300.0
300.0
300.0
300.0
Other Long-Term Liabilities
25.0
25.0
25.0
25.0
25.0
25.0
25.0
25.0
25.0
25.0
25.0
25.0
0.525$
seitilibaiL latoT
0.579$
$947.3
$908.2
$857.7
$799.2
$735.5
$665.9
$593.0
$601.0
$609.3
$617.9
Noncontrolling Interest
-
-
-
-
-
-
-
-
-
-
-
-
Shareholders' Equity
700.0
370.0 (700.0) 370.0
419.3
475.3
537.1
603.9
676.2
754.7
840.3
932.8
1,030.4
1,133.1
0.007$
ytiuqE 'sredloherahS latoT
0.073$
$419.3
$475.3
$537.1
$603.9
$676.2
$754.7
$840.3
$932.8
$1,030.4
$1,133.1
Total Liabilities and Equity
$1,225.0
0.543,1$
$1,366.5
$1,383.5
$1,394.8
$1,403.1
$1,411.7
$1,420.6
$1,433.3
$1,533.9
$1,639.7
$1,751.0
000.0000.0000.0000.0
000.0000.0000.000
0.0000.0000.0000.0
000.0
kcehC ecnalaB
0.001
latipaC gnikroW teN
0.001
108.0
114.5
119.1
122.6
126.3
130.1
134.0
138.0
142.2
146.4
(Increase) / Decrease in Net Working Capital
(8.0)
(6.5)
(4.6)
(3.6)
(3.7)
(3.8)
(3.9)
(4.0)
(4.1)
(4.3)
Balance Sheet Assumptions
2.06
)OSD( gnidnatstuO selaS syaD
2.06
60.2
60.2
60.2
60.2
60.2
60.2
60.2
60.2
60.2
60.2
0.67
)HID( dleH yrotnevnI syaD
0.67
76.0
76.0
76.0
76.0
76.0
76.0
76.0
76.0
76.0
76.0
Prepaid and Other Current Assets (% of sales)
%0.1 %0.1 %0.1 %
0.1 %0.1 %0.1 %0.1
%0.1
1.0% 1.0% 1.0%
1.0%
Days Payable Outstanding (DPO)
45.6
6.54
45.6
45.6
45.6
45.6
45.6
45.6
45.6
45.6
45.6
45.6
Accrued Liabilities (% of sales)
%0.01 %0.01 %0.01 %0
.01 %0.01 %
0.01 %0.01 %0.01
%0.01
10.0% 10.0% 10.0%
Other Current Liabilities (% of sales)
%5.2 %5.2 %5.2
%5.2 %5.2 %5.2 %5.2
%5.2
2.5% 2.5% 2.5% 2.5%
Balance Sheet
Current Assets
Current Liabilities
241
P1: ABC/ABC P2:c/d QC:e/f T1:g
c05 JWBT063-Rosenbaum March 18, 2009 15:37 Printer Name: Hamilton
EXHIBIT 5.49
ValueCo LBO Cash Flow Statement
($ in millions, fiscal year ending December 31)
Projection Period
Year 1 Year 2 Year 3
Year 4 Year 5 Year 6 Year 7
Year 8 Year 9 Year 10
2009
2010
2011
2012
2013
2014
2015
2016
2017
2018
Operating Activities
$49.3
Net Income
$56.1
$61.8
$66.8
$72.3
$78.5
$85.6
$92.5
$97.5
$102.8
21.6
Plus: Depreciation & Amortization
22.9
23.8
24.5
25.3
26.0
26.8
27.6
28.4
29.3
2.5
Plus: Amortization of Financing Fees
2.5
2.5
2.5
2.5
2.5
2.2
1.0
1.0
1.0
Changes in Working Capital Items
(Inc.) / Dec. in Accounts Receivable
(13.2)
(10.7)
(7.6)
(5.9)
(6.1)
(6.3)
(6.4)
(6.6)
(6.8)
(7.0)
(Inc.) / Dec. in Inventories
(10.0)
(8.1)
(5.7)
(4.5)
(4.6)
(4.7)
(4.9)
(5.0)
(5.2)
(5.3)
(Inc.) / Dec. in Prepaid and Other Current Assets
(0.8)
(0.6)
(0.5)
(0.4)
(0.4)
(0.4)
(0.4)
(0.4)
(0.4)
(0.4)
6.0
Inc. / (Dec.) in Accounts Payable
4.9
3.4
2.7
2.8
2.8
2.9
3.0
3.1
3.2
8.0
Inc. / (Dec.) in Accrued Liabilities
6.5
4.6
3.6
3.7
3.8
3.9
4.0
4.1
4.3
2.0
Inc. / (Dec.) in Other Current Liabilities
1.6
1.1
0.9
0.9
0.9
1.0
1.0
1.0
1.1
(Inc.) / Dec. in Net Working Capital
(8.0)
(6.5)
(4.6)
(3.6)
(3.7)
(3.8)
(3.9)
(4.0)
(4.1)
(4.3)
3.56$
Cash Flow from Operating Activities
$74.9
$83.4
$90.2
$96.3
$103.2
$110.7
$117.1
$122.9
$128.8
Investing Activities
Capital Expenditures
(21.6)
(22.9)
(23.8)
(24.5)
(25.3)
(26.0)
(26.8)
(27.6)
(28.4)
(29.3)
Other Investing Activities
-
-
-
-
-
-
-
-
-
-
Cash Flow from Investing Activities
($21.6)
($22.9)
($23.8)
($24.5)
($25.3)
($26.0)
($26.8)
($27.6)
($28.4)
($29.3)
Financing Activities
-
Revolving Credit Facility
-
-
-
-
-
-
-
-
-
Term Loan B
(43.7)
(52.0)
(59.6)
(65.7)
(71.1)
(77.2)
(80.7)
-
-
-
-
Existing Term Loan
-
-
-
-
-
-
-
-
-
-
Senior Subordinated Notes
-
-
-
-
-
-
-
-
-
Dividends
-
-
-
-
-
-
-
-
-
-
Equity Issuance / (Repurchase)
-
-
-
-
-
-
-
-
-
-
Cash Flow from Financing Activities
($43.7)
($52.0)
($59.6)
($65.7)
($71.1)
($77.2)
($80.7)
-
-
-
-
Excess Cash for the Period
-
-
-
-
-
$3.2
$89.5
$94.4
$99.6
-
Beginning Cash Balance
-
-
-
-
-
-
3.2
92.7
187.2
-
Ending Cash Balance
-
-
-
-
-
$3.2
$92.7
$187.2
$286.7
Cash Flow Statement Assumptions
Capital Expenditures (% of sales)
2.0% 2.0% 2.0%
2.0% 2.0% 2.0% 2.0%
2.0% 2.0% 2.0%
Cash Flow Statement
242
P1: ABC/ABC P2:c/d QC:e/f T1:g
c05 JWBT063-Rosenbaum March 18, 2009 15:37 Printer Name: Hamilton
EXHIBIT 5.50
ValueCo LBO Debt Schedule
($ in millions, fiscal year ending December 31)
Projection Period
Pro forma Year 1 Year 2
Year 3 Year 4
Year 5
Year 6 Year 7
Year 8 Year 9
Year 10
2008
2009
2010
2011
2012
2013
2014
2015
2016
2017
2018
Forward LIBOR Curve
4.80%
4.35%
4.00%
3.60%
3.30%
3.15%
3.00%
3.00%
5.25%
5.10%
4.85%
$65.3
Cash Flow from Operating Activities
$74.9
$83.4
$90.2
$96.3
$103.2
$110.7
$117.1
$122.9
$128.8
Cash Flow from Investing Activities
(21.6)
(22.9)
(23.8)
(24.5)
(25.3)
(26.0)
(26.8)
(27.6)
(29.3)
(28.4)
Cash Available for Debt Repayment
$43.7 $52.0
$59.6
$65.7
$71.1
$77.2
$83.9
$89.5
$94.4
$99.6
Total Mandatory Repayments
MinCash
(4.5) (4.5) (4.5)
(4.5) (4.5)
(4.5)
(4.5)
-
-
-
Cash from Balance Sheet
-
-
-
-
-
-
-
3.2
-
92.7
187.2
$39.2
Cash Available for Optional Debt Repayment
$47.5
$55.1
$61.2
$66.6
$72.7
$79.4
$92.7
$187.2
$286.7
Revolving Credit Facility
$100.0
Revolving Credit Facility Size
Spread
3.250%
Term
6 years
Commitment Fee on Unused Portion
0.50%
Beginning Balance
- - -
- - -
- -
-
-
Drawdown / (Repayment)
-
-
-
-
-
-
-
-
-
-
-
Ending Balance
-
-
-
-
-
-
-
-
-
Interest Rate
6.25% 6.40%
6.55%
6.85%
7.25%
7.60%
8.05%
8.10%
8.35%
8.50%
Interest Expense
- - -
- - -
- -
-
-
0.5
Commitment Fee
0.5
0.5
0.5
0.5
0.5
0.5
0.5
0.5
0.5
Term Loan B Facility
$450.0
Size
Spread
3.500%
Term
7 years
Repayment Schedule
1.0%
per Annum, Bullet at Maturity
$450.0
Beginning Balance
$406.3
$354.2
$294.6
$228.9
$157.9
$80.7
-
-
-
Mandatory Repayments
(4.5) (4.5) (4.5)
(4.5) (4.5)
(4.5)
(4.5)
-
-
-
Optional Repayments
(39.2)
(47.5)
(55.1)
(61.2)
(66.6)
(76.2)
(72.7)
-
-
-
$406.3
Ending Balance
$354.2
$294.6
$228.9
$157.9
$80.7
-
-
-
-
Interest Rate
6.50% 6.65%
6.80%
7.10%
7.50%
7.85%
8.30%
8.35%
8.60%
8.75%
27.8
Interest Expense
25.3
22.1
18.6
14.5
9.4
3.3
-
-
-
Senior Subordinated Notes
$300.0
Size
Coupon
10.000%
Term
10 years
$300.0
Beginning Balance
$300.0
$300.0
$300.0
$300.0
$300.0
$300.0
$300.0
$300.0
$300.0
Repayment
-
-
-
-
-
-
-
-
-
-
$300.0
Ending Balance
$300.0
$300.0
$300.0
$300.0
$300.0
$300.0
$300.0
$300.0
$300.0
30.0
Interest Expense
30.0
30.0
30.0
30.0
30.0
30.0
30.0
30.0
30.0
Debt Schedule
243
P1: ABC/ABC P2:c/d QC:e/f T1:g
c05 JWBT063-Rosenbaum March 18, 2009 15:37 Printer Name: Hamilton
EXHIBIT 5.51
ValueCo LBO Returns Analysis
20.1%
($ in millions, fiscal year ending December 31)
Projection Period
Pro forma Year 1 Year 2
Year 3 Year 4 Year 5
Year 6 Year 7 Year 8
Year 9 Year 10
2008
2009
2010
2011
2012
2013
2014
2015
2016
2017
2018
Entry EBITDA Multiple
7.5x
$385.0
Initial Equity Investment
EBITDA
$162.0 $171.7
$178.6
$183.9
$189.5
$195.1
$201.0
$207.0
$213.2
$219.6
Exit EBITDA Multiple
7.5x
Enterprise Value at Exit
$1,215.0
$1,287.9
$1,339.4
$1,379.6
$1,421.0
$1,463.6
$1,507.5
$1,552.8
$1,599.3
$1,647.3
Less: Net Debt
-
Revolving Credit Facility
-
-
-
-
-
-
-
-
-
Term Loan B
406.3
354.2
294.6
228.9
157.9
80.7
-
-
-
-
0.003
Senior Subordinated Notes
300.0
300.0
300.0
300.0
300.0
300.0
300.0
300.0
300.0
Other Debt
-
-
-
-
-
-
-
-
-
-
Total Debt
$706.3
$654.2
$594.6
$528.9
$457.9
$380.7
$300.0
$300.0
$300.0
$300.0
-
Less: Cash and Cash Equivalents
-
-
-
-
-
3.2
92.7
187.2
286.7
Net Debt
$706.3
$654.2
$594.6
$528.9
$457.9
$380.7
$296.8
$207.3
$112.8
$13.3
Equity Value at Exit
$508.7
$633.7
$744.8
$850.7
$963.1
$1,083.0
$1,210.7
$1,345.5
$1,486.5
$1,634.0
x2.4
x9.3
x5.3
x1.3
x8.2
x5.2
x2.2
x9.1
x6.1
x3.1
Cash Return
Year 1 Year 2 Year 3
Year 4 Year 5 Year 6
Year 7 Year 8 Year 9
Year 10
2009
2010
2011
2012
2013
2014
2015
2016
2017
2018
Initial Equity Investment
($385.0) ($385.0) ($385.0)
($385.0) ($385.0) ($385.0)
($385.0) ($385.0)
($385.0)
($385.0)
$508.7
Equity Proceeds
- - -
- - -
-
-
-
$633.7 - -
- - -
-
-
-
$744.8 - -
- - -
-
-
$850.7 - -
- -
-
-
$963.1 - -
-
-
-
$1,083.0 - -
-
-
$1,210.7 -
-
-
$1,345.5
-
-
$1,486.5
-
$1,634.0
IRR
32.1%
28.3%
24.6%
21.9%
20.1%
18.8%
17.8%
16.9%
16.2%
15.6%
7.25x
7.00x
6.75x
6.50x
7.50x
8.00x
7.75x
6.50x
34.7%
33.5%
32.2%
30.9%
29.5%
28.1%
26.6%
6.75x
23.0% 24.5%
30.9%
29.7%
28.5%
27.2%
25.9%
7.00x
21.4%
19.9%
22.7%
27.7%
26.5%
25.3%
24.1%
7.25x
Entry
20.0%
18.7%
17.3%
21.3%
24.9%
23.7%
22.6%
Multiple
7.50x
18.9%
17.7%
16.4%
15.0%
20.1%
22.4%
21.3%
7.75x
20.2%
19.1%
18.0%
16.8%
15.5%
14.3%
12.9%
8.00x
18.2%
17.1%
16.0%
14.8%
13.6%
12.4%
11.0%
Returns Analysis
IRR - Assuming Exit in 2013E
Exit Multiple
244